
Khiwe
@t_Khiwe

What symbols does the trader recommend buying?
Purchase History
پیام های تریدر
Filter
Khiwe
احتمال ریزش بیت کوین (BTCUSDT) به کجا میرسد؟ تحلیل تایم فریم ساعتی و سطوح کلیدی
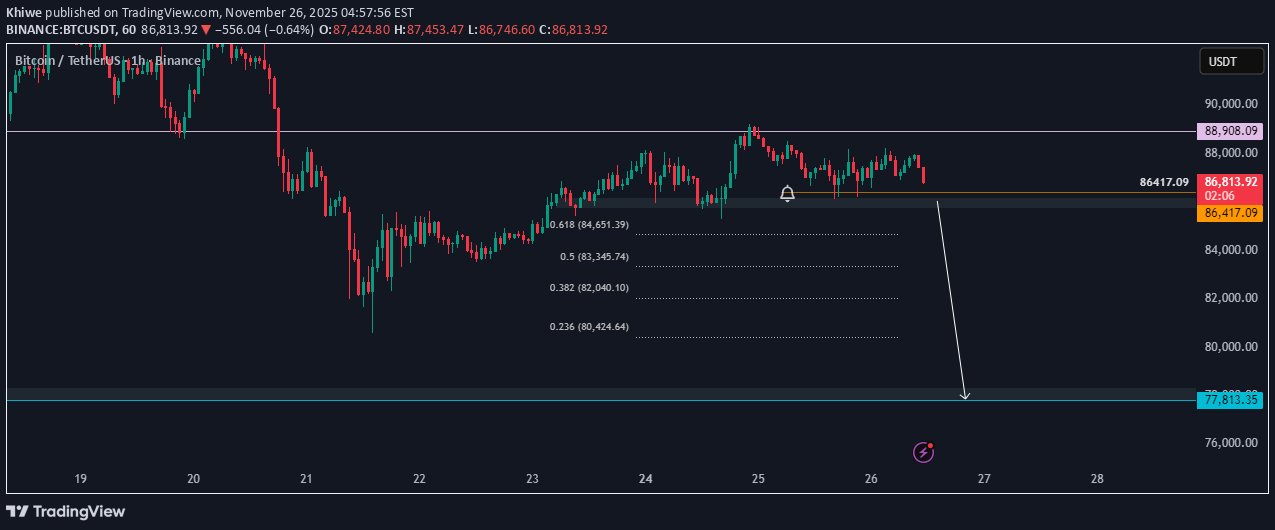
Hi, BTCUSDT at the 1-hour timeframe. Price looks bearish, responding to the 88908.09 level. We want to see the break of 86417.09 for a potential drop toward 77813.35. And we have four potential Fib price target levels. Happy Trading, K. Not trading adviceNo bell.
Khiwe
تحلیل بیت کوین (BTCUSDT): آیا سقوط به زیر ۸۳۰۰۰ قطعی است؟
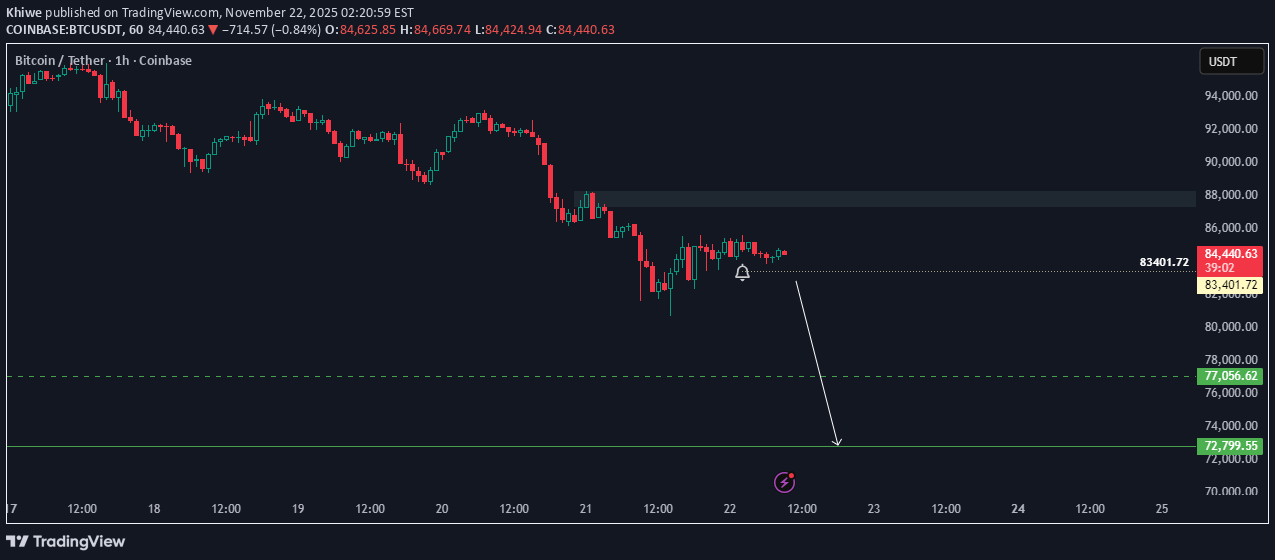
Hi, A look at BTCUSDT over a one-hour period. Based on the current daily low candle, the price is consolidating somewhat above the price low of 82129.49. We have bearish pressure at 88K that could potentially resist the current bullish pressure. We want to see price break below 83401.72 for bearish bias to aim for potential targets of 77056.62 and 72799.55 Happy Trading, K. This is not financial advice.No bell
Khiwe
تحلیل بیت کوین: آیا روند صعودی BTC/USD در خطر است؟ (سطح کلیدی ۱۰۰,۶۸۹)
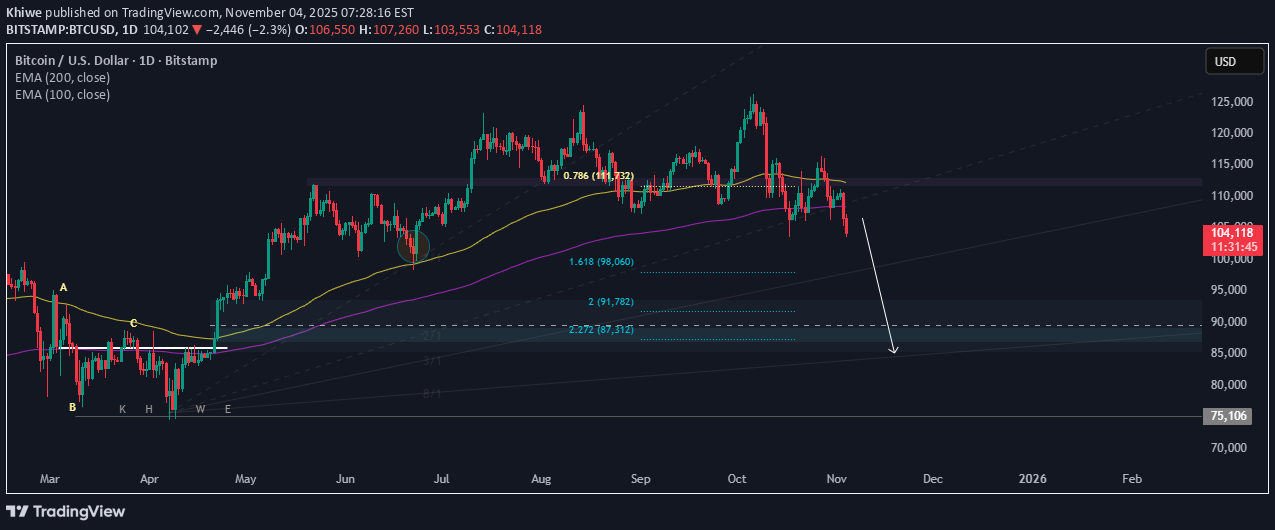
Hello BTCUSD Daily Analysis: - The price is currently below the 100 EMA, which remains above the 200 EMA, indicating a bearish trend overall. - The 21 and 50 EMAs are also below the 100 EMA, reinforcing the bearish pressure over the 200 EMA. The key resistance level then is 109,588. - Currently, bearish movements are driven by pressure around the 111,732 area. However, the trend has not yet reversed. 🧩 The level of 100,689 acts as support. As long as this level holds, the bullish trend remains intact. - If the price breaks below 100,689, there is potential for the trend to shift to bearish. Overall: 🎙️A break below 100,689 could signal a trend reversal, while holding above this level may keep the bullish outlook alive. Happy Trading; K. __ Not trading advice.
Khiwe
پیشبینی سقوط لایت کوین (LTCUSDT): هشدار خرسها از مقاومت ۱۰۰ دلاری!
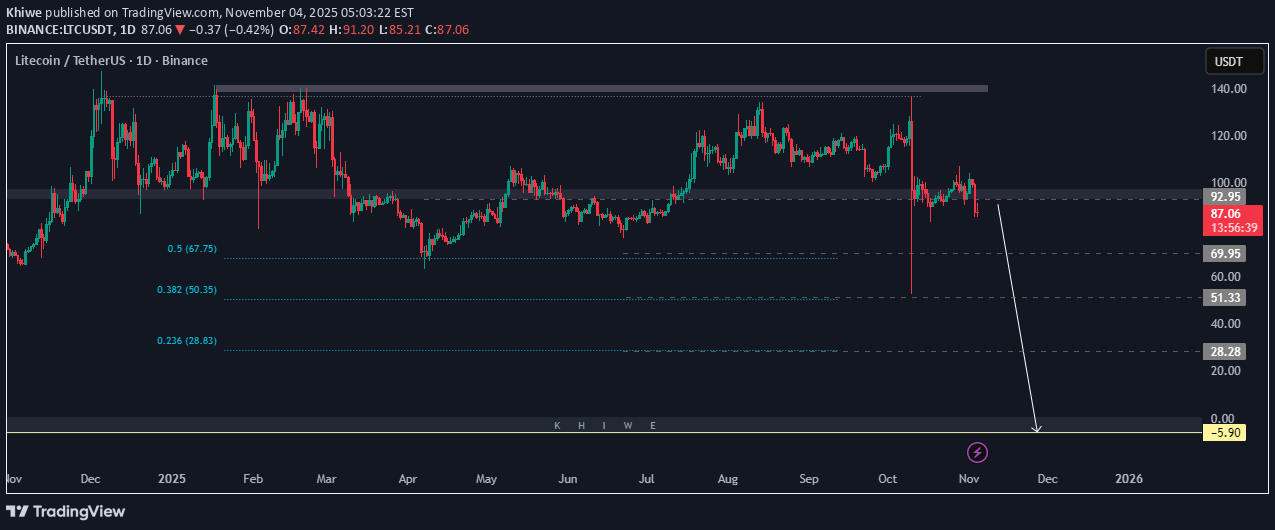
Hi there, Let's take a look at LTCUSDT. It appears bearish on the Daily timeframe, with the significant resistance at 100.00. The next meaningful support levels are 80.19 and 67.75. It is possible that the price will fall even more to the range of 50.35 to 28.83. Because of that strong red lower wick, watch sentiment and related news; it will be necessary to monitor price changes. Consider your risk tolerance, as market volatility can potentially lead to large losses. Happy Trading, K. __ This analysis employs custom mathematical theories and patterns; it is not financial advice
Khiwe
پیشبینی صعودی بیت کوین (BTCUSD): منتظر کدام سطح برای جهش بزرگ باشیم؟
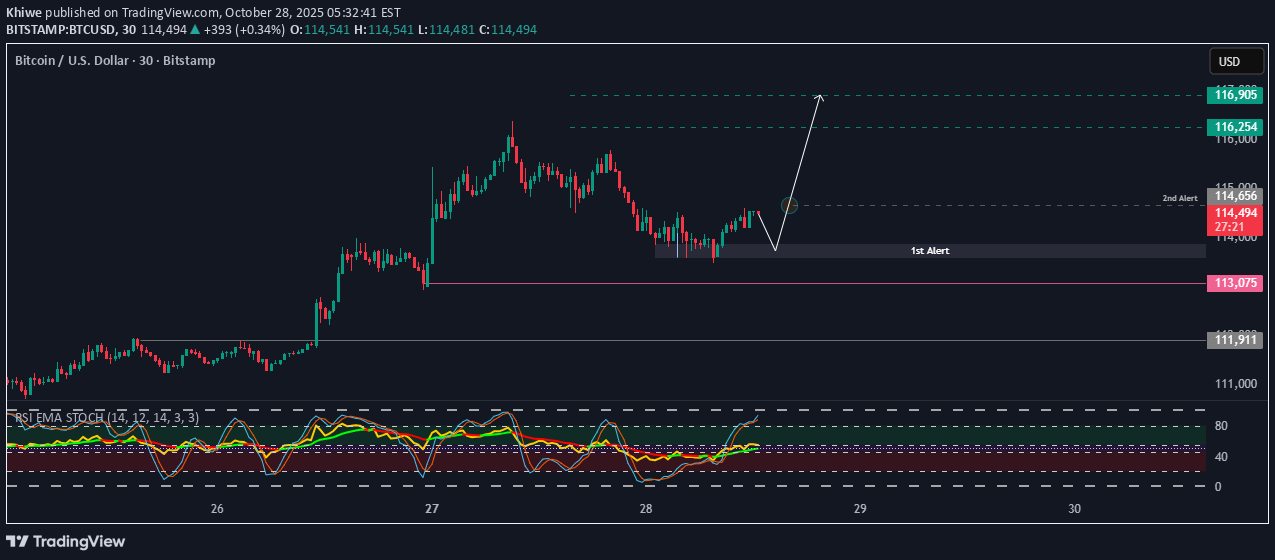
BTCUSD at the M3O looks bullish. There are two areas where we want to see how the price will behave, marked as the first and second alerts. Currently, the price appears to be consolidating within four candles. The bullish bias is potentially toward 116,254 - 116,905. If the price breaks below 113,075, it will invalidate the setup. Happy Trading, K. ------ Not a financial advice.
Khiwe
احتمال ریزش طلا (XAUUSD) جدی شد: سطوح کلیدی که باید زیر نظر بگیرید!
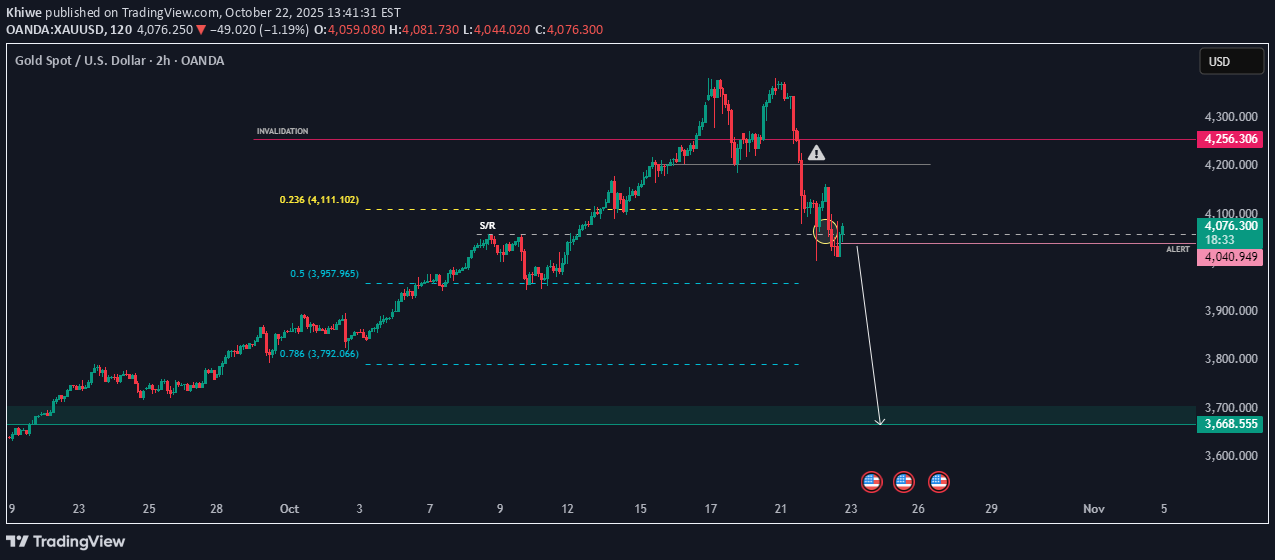
Hi there, XAUUSD appears to be trending bearish on the H2 timeframe. A break below 4040.949 could suggest continued bearish momentum to me, possibly moving toward the 3957.965 – 3792.066 zone, with a broader downside area of interest near 3668.555. The 4059.496 level stands out as a key area of support/resistance right now. Happy Trading, K. __ This is not financial advice. The analysis is based solely on my support and resistance concepts, chart patterns, and technical indicators.
Khiwe
پیشبینی صعودی DASH/USDT: آیا قیمت به هدف ۴۹ دلار میرسد؟
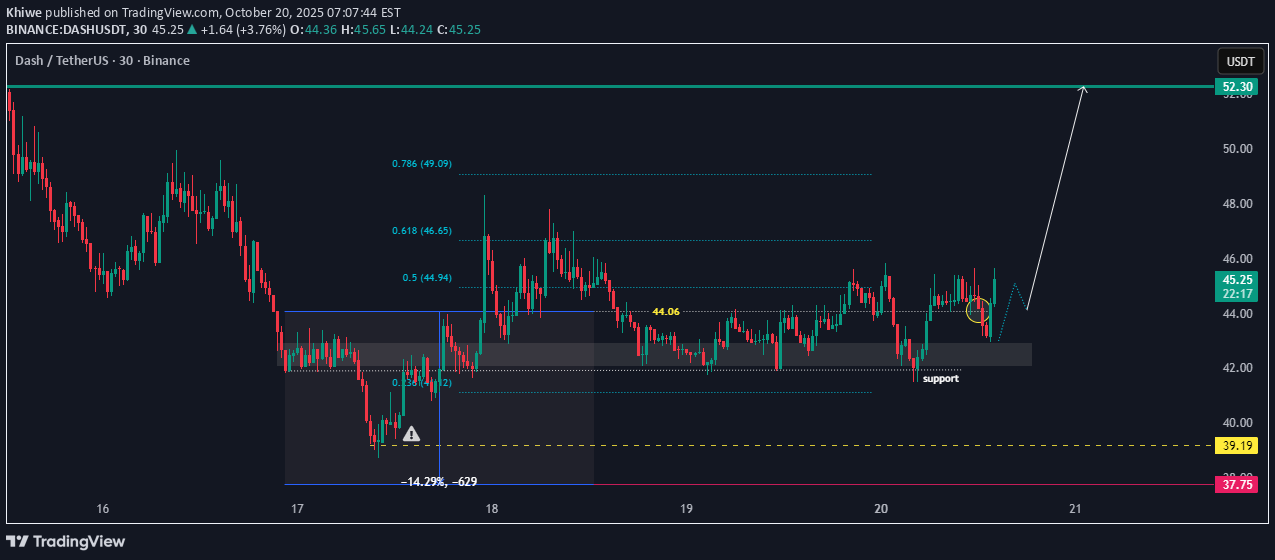
Hi there, DASHUSDT looks bullish on the M30 timeframe. The price must form a higher low above 44.06 to maintain bullish interest. The price is responding to the support area at 42.00, but there is significant resistance around 46.65. The potential target area is 49.09, with a bias toward 52.30. Happy Trading, K. -- Not trading adviceThat is fine
Khiwe
طلا در دوراهی: آیا پس از این توقف کوتاه، به قله 4482 خواهیم رسید؟
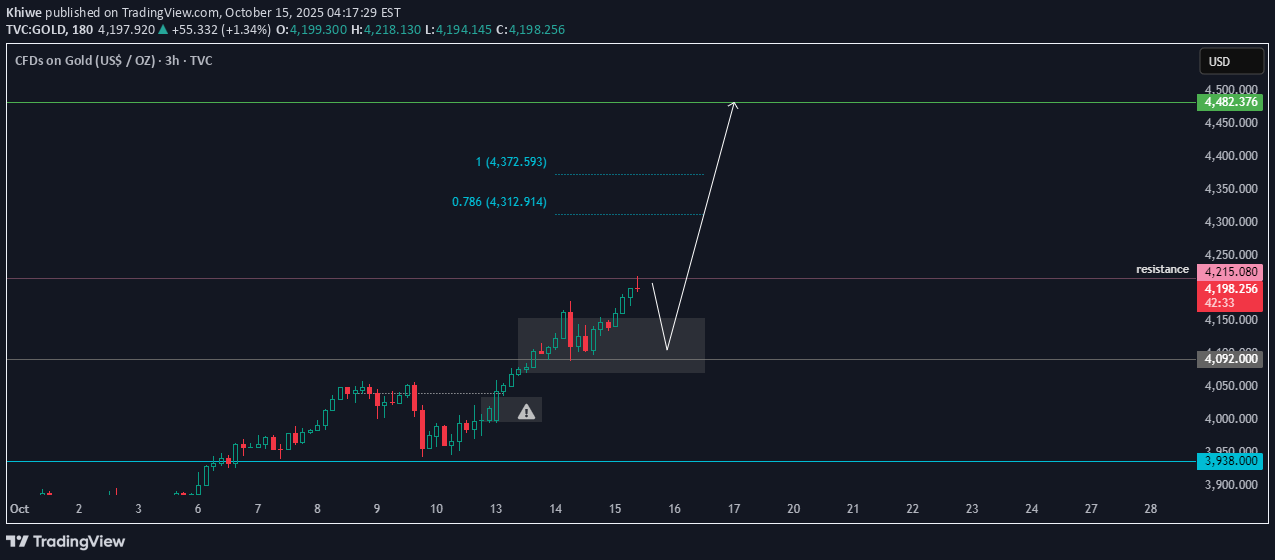
Hi The price at 4215.080 is showing hesitation and acting as resistance. Gold may drop before rising again, with a target price of 4482.376. There are two price targets to watch. If the price falls deeper, it could reach 4039.060. Happy Trading! K. _ Not trading advice
Khiwe
تحلیل اسکالپینگ دوج کوین: آیا پامپ قیمتی DOGE ادامه پیدا میکند؟
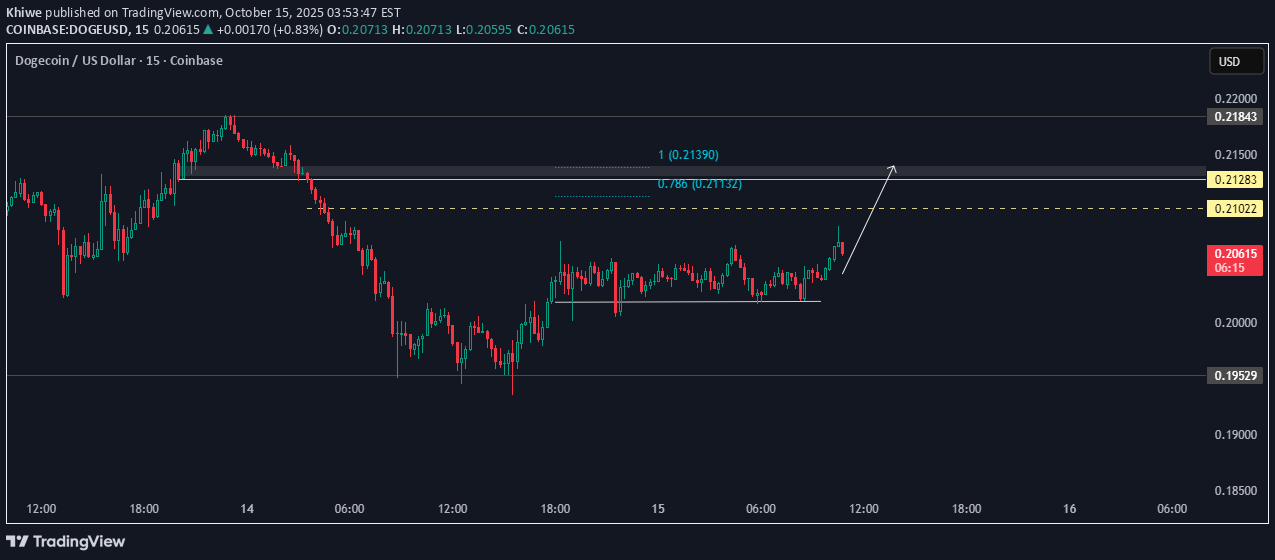
Hi, DOGEUSD currently has the potential to rise to 0.2122, with a target bias toward 0.21283. The price movement faces light selling pressure, which could reduce momentum. Additionally, trading volume is declining around 0.21022, indicating a possible weakening of the upward trend. If support near this level fails to hold, the price may slow down or reverse. Recent market analysis shows DOGE trading above $0.20, with intraday highs near 0.2182. Experts forecast that Dogecoin could fluctuate between 0.192 and 0.218 in October 2025, with potential to reach higher levels later in the year. To those who share my analtics: Be zendegi-ye porbâr! Happy Trading, Khiwe, Not trading advice
Khiwe
اتریوم آماده صعود: سه هدف قیمتی هیجانانگیز تا مرز ۴۵۰۰ دلار!
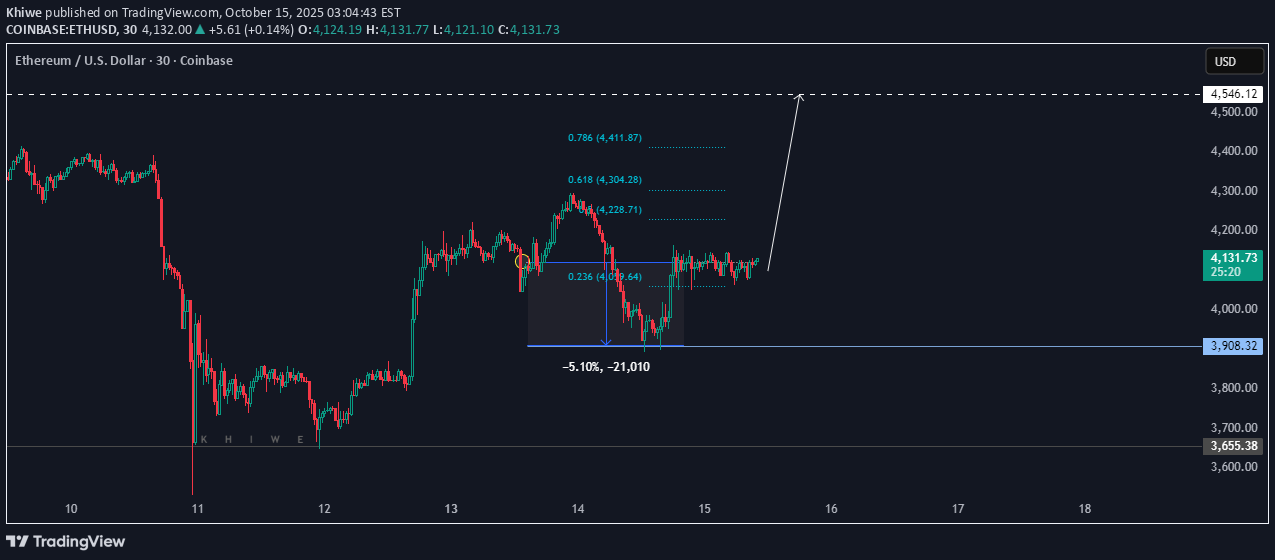
Hi, ETHUSD looks bullish on the M30 timeframe with three potential target areas: 4,228.71, 4,304.28, and 4,411.87, moving toward the bias at 4,546.12. Price is showing upward momentum on higher timeframes, with 3,800.00 maintaining support. There is strong resistance around 4,369.20, applying pressure over 4,280.60, but the current price counters this with volume around 3,700.00 to 3,961.66. Happy Trading, K. - Not trading advice.
Disclaimer
Any content and materials included in Sahmeto's website and official communication channels are a compilation of personal opinions and analyses and are not binding. They do not constitute any recommendation for buying, selling, entering or exiting the stock market and cryptocurrency market. Also, all news and analyses included in the website and channels are merely republished information from official and unofficial domestic and foreign sources, and it is obvious that users of the said content are responsible for following up and ensuring the authenticity and accuracy of the materials. Therefore, while disclaiming responsibility, it is declared that the responsibility for any decision-making, action, and potential profit and loss in the capital market and cryptocurrency market lies with the trader.