
Jerome-Leon
@t_Jerome-Leon

What symbols does the trader recommend buying?
Purchase History
پیام های تریدر
Filter
Jerome-Leon
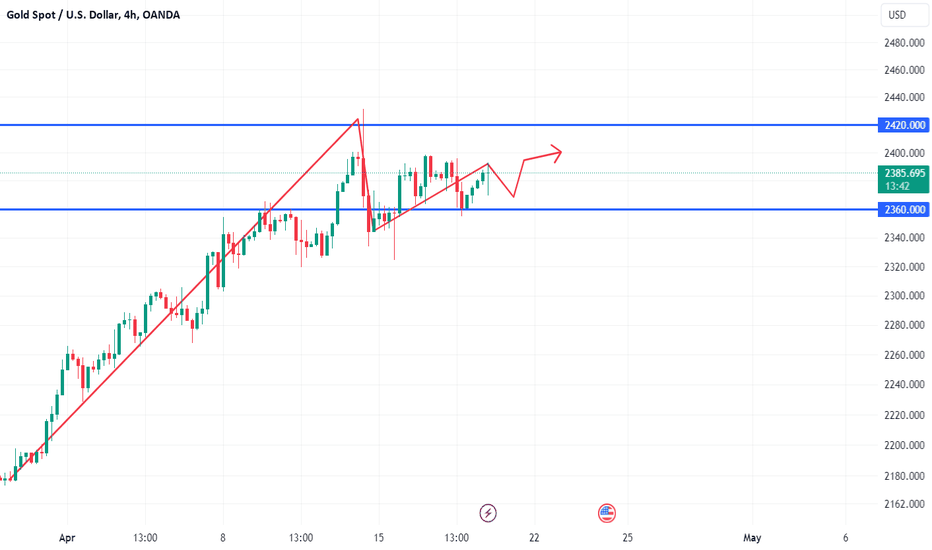
Gold trade analysis

On May 30, the price of gold (2353.87, -10.23, -0.43%) fell nearly 1% on Wednesday to close at $2,337.88 per ounce. The U.S. dollar strengthened to a two-week high, U.S. Treasury bond yields rose to a four-week high and hawkish statements from Federal Reserve officials dampen market sentiment. Market focus turns to the release of U.S. inflation data later this week. The U.S. dollar index rose 0.49% on Wednesday, hitting an intraday high of 105.19, a new high since May 14, making gold more expensive for investors holding other currencies. The market is watching the U.S. core personal expenditures (PCE) price index report due out on Friday for more clues on the timing and scale of interest rate cuts. PCE is the Fed's favored inflation measure. In the short term, the rebound in gold prices has ended. H4 has once again entered a short-selling and heavy-volume trend, and fell in the early morning. Then the high in the early morning will be the dividing line between strength and weakness during the day, that is, if 2344 is not broken, the gold price will be extremely weak. If it breaks above, just watch the shock. , the Asian market opened directly down in the morning, there is no need to chase, everyone can wait for 2337-39 to go short, add positions to 2344, defend 2349, and look at 2325-20. The focus is still on the strength of the European market. If the European market is strong, the U.S. market will rise first and then fall. If the European market is weak, just continue to be short after the rebound before the U.S. market.active tradeactive trade
Jerome-Leon
Gold Global Analysis

Gold began to correct after the opening yesterday, and it temporarily stopped after hitting a maximum of around 2358 at the end of the US market. However, the upward trend was weak in the morning of the day, and it retreated in the opposite direction. Currently, the European market has retreated to around 2340, and the intraday discontinuity It also allows us to directly consider whether yesterday's retracement was a correction by the shorts, not a counterattack by the bulls. Furthermore, combined with last week's retracement and downward channel, it is not a reversal in the short term, and we still need to continue in the later period. We are short gold, and it is currently retracing above 2340. Overall, the short energy remains during the day, and there is still some room for downside in the evening. Judging from the current trend of gold, the first support below is maintained at the 2328-30 line, focusing on the 2320 line. This position is also related to whether short sellers can start a new round of action in the later period, while the key suppression port above will remain at 2320. Last week's retracement high point was around 2360-65. This position is also our ideal short selling point in the evening. The hourly line is currently repaired and there is a signal to turn around. In the middle position, watch more and move less and pursue orders cautiously. Wait patiently for the key point. Bit entry. 1. Go short on the rebound at 2350-55, cover the short position at the 2360-65 line, stop loss at 2372, and target the 2338-2340 line;active tradeactive tradeactive trade
Jerome-Leon
Gold trade analysis

The international gold price continued the downward trend of the previous two days and is currently testing the 2310 support level. Yesterday, the gold price once fell below the 2300 mark, but it rebounded under the stimulation of weaker than expected PMI data. After closing in the red for two consecutive trading days, spot gold came under further pressure during the day and is currently trading around $2,310. Yesterday it hit its lowest point since April 5 at $2,291. The price of gold has tentatively positioned the market in the range of 2300-2342 during the day. There is a battle for two key points. The bottom is likely to rebound around the 2300 mark, while the key resistance above is the fight for 2332. If it can break through and stand firm, it will still be It will continue to test 2342 and 2350. It is recommended to focus on rebound operations during day trading.active tradeactive tradeactive tradeactive trade
Jerome-Leon
xauusd Gold technical analysis

Spot gold prices continued their sharp downward trend during the day, with gold prices effectively falling below the key level of $2,363 per ounce, which may open room for further falls in gold prices. Gold prices fell on Monday amid optimism that the conflict between Iran and Israel would not escalate further. In addition, market expectations for the Federal Reserve to cut interest rates have weakened, causing U.S. bond yields to remain at a high level, putting pressure on gold prices. As the price of gold fell below US$2,365.10 per ounce and reached the key support level of US$2,325.90 per ounce, the price of gold effectively fell below this level, which may trigger technical selling and push the price of gold down further to the round mark of US$2,300 per ounce.active tradeactive tradeactive tradeactive tradeactive trade
Jerome-Leon
Global analysis of gold trade

Gold prices held firm on Friday and were on track for a fifth straight weekly gain as concerns about further tit-for-tat retaliation between Iran and Israel stoked safe-haven demand. Spot gold prices rose to a high of $2,417.92 earlier in the session, with prices up more than 1% for the week. U.S. gold futures fell 0.2% to $2,393.50. Gold prices soared early Friday, with the overnight spot market topping $2,400 after an explosion over an Iranian city that sources said was an Israeli attack. “The escalation and de-escalation of the situation in the Middle East has taken control of the market. If the situation does de-escalate, then gold prices will correct or consolidate as safe-haven buying dries up. In the long term, since the Fed may not cut interest rates as soon as the market expects, Gold’s upward trend will continue.”active tradeactive tradeactive tradeactive trade
Jerome-Leon
Global analysis of gold trade
In early trading in the European market on Thursday (April 18), spot gold continued its strong intraday trend. The price of gold exceeded US$2,380 per ounce, reaching a maximum of US$2,392.72 per ounce, rising by nearly US$30 during the day. Investors remain concerned about another conflict between Israel and Iran, driving safe-haven funds into gold. Additionally, fresh losses in the U.S. dollar and U.S. Treasury yields remained supportive of gold. Amid geopolitical concerns, gold prices are likely to continue to find safe-haven demand with every pullback. Weekly U.S. jobless claims and housing data will also provide some incentives for gold traders this session. If the gains are sustained, gold prices could retest this week's key resistance near $2,400 an ounce. A break above this level is critical for gold prices to resume their upward trend and retest record highs of $2,432 an ounce. On the downside, gold sellers would need a close below the 50-period simple moving average (SMA) of $2,360/oz to extend the correction and move towards the April 15 low of $2,324/oz.active tradeactive trade
Jerome-Leon
Gold prices fluctuate ahead

Last week, the Asian market opened. Affected by geopolitics in the Middle East, international gold prices opened high and then fell back, causing large market fluctuations. Several Federal Reserve officials will speak this week, and investors will need to pay close attention. From a technical point of view, the international gold price is under heavy selling pressure. The dividing line between long and short prices this week has been adjusted to US$2,360 per ounce, and is currently hovering near the dividing line. However, judging from the 1-hour chart, the international gold price has entered the short model again. If it cannot regain its footing above this week's watershed, then the probability of continued correction is relatively high. On the downside, support can be focused on around US$2,287/ounce, while on the upside, resistance can be focused on around US$2,416/ounce.active tradeactive tradeactive tradeactive tradeactive tradeactive tradeactive tradeactive tradeactive trade
Jerome-Leon
Global analysis of gold trade

Gold prices hit a record high on Friday as demand for safe-haven gold surged amid concerns about geopolitical risks in the Middle East and was on track to rise for a fourth consecutive week. Gold prices are expected to rise further as demand for safe-haven assets rises as central banks ramp up asset purchases and investors become increasingly concerned about escalating geopolitical conflicts. In addition, the U.S. Producer Price Index (PPI) released on Thursday was lower than expected, enhancing market expectations that the Federal Reserve will cut interest rates soon, providing additional support for gold prices. From a technical analysis point of view, although the relative strength index (RSI) on the daily chart is extremely overbought, the bullish trend of gold prices has not been significantly affected. However, bulls may choose to take profits near the $2,400 mark before the weekend, so caution is warranted before further appreciation. It is worth noting that any meaningful corrective decline below the Asian session lows ($2370 area) is likely to find decent support near the $2352-2350 area. Some follow-on selling could expose the next relevant support near the $2,332 area before gold eventually falls to around $2,300 or weekly lows.active tradeactive tradeactive trade
Jerome-Leon
golden trading range

In terms of technical analysis, gold prices are showing a bullish trend and are expected to challenge all-time highs again. Geopolitical tensions may intensify, pushing investors to turn to gold as a safe haven, thereby helping gold prices resume their sustained upward trend. However, this process may be affected by US PPI data and European Central Bank policy statements. The European Central Bank is widely expected to keep borrowing costs at historically high levels, while focus will be on whether officials signal a rate cut in June. Gold's relative strength index (RSI) is moving higher above its midline, approaching the 59.00 level, suggesting there is still room for further gains in gold prices. The main resistance levels faced by gold prices in the near future are the psychological mark of $2,350 per ounce and the historical high of $2,365 per ounce. If gold prices can break through these resistance levels, another rebound to the $2,400/ounce level cannot be ruled out. However, if gold pulls back and regains upward momentum, support at $2,330 an ounce will play a key role. If it fails to hold this support level, gold prices may fall further to the high of $2,305/ounce on April 4; if it falls below this level, it may test the low of $2,268/ounce on April 5.active tradeactive tradeactive tradeactive tradeactive trade
Jerome-Leon
XAUUSD Gold trade analysis

Yesterday, gold had a sharp decline. The Asian market rose slightly, the European market began to fall, and the US market refreshed a recent low of 2,319 US dollars. However, it stabilized and returned to around 2,350 again. Finally, the gold price closed at 2,333 US dollars. The daily line Closed on a negative line. Stronger-than-expected inflation data in the U.S. last night weakened expectations of an early interest rate cut in the U.S., and the U.S. dollar and government bond yields strengthened. In addition, the minutes of the Federal Reserve meeting in the early morning showed that high interest rates may need to be maintained for a longer period, which also put pressure on gold prices. However, geopolitical tensions in the Middle East Concerns about the situation still provide some support for gold prices. During the day, gold continues to focus on the short-term pressure near 2350. Although the current market has rebounded, the overnight situation also shows that the power of the bulls is weakening. Even if they want to continue to rebound, the price the bulls will pay will be very high, so it is not worth the bullish position. To maintain the strong rise, we should pay attention to the risk that bulls may sell off short-term profits. Then the current rebound may become an opportunity for short-term bulls to take the opportunity to leave the market. At the bottom of the day, we will continue to focus on the competition around 2330-20. On the hourly chart, we also expect the market to retrace to the 2305-00 area to confirm the effectiveness of the support.active tradeactive tradeactive tradeactive tradeactive trade
Disclaimer
Any content and materials included in Sahmeto's website and official communication channels are a compilation of personal opinions and analyses and are not binding. They do not constitute any recommendation for buying, selling, entering or exiting the stock market and cryptocurrency market. Also, all news and analyses included in the website and channels are merely republished information from official and unofficial domestic and foreign sources, and it is obvious that users of the said content are responsible for following up and ensuring the authenticity and accuracy of the materials. Therefore, while disclaiming responsibility, it is declared that the responsibility for any decision-making, action, and potential profit and loss in the capital market and cryptocurrency market lies with the trader.