
IsekaiFx
@t_IsekaiFx

What symbols does the trader recommend buying?
Purchase History
پیام های تریدر
Filter
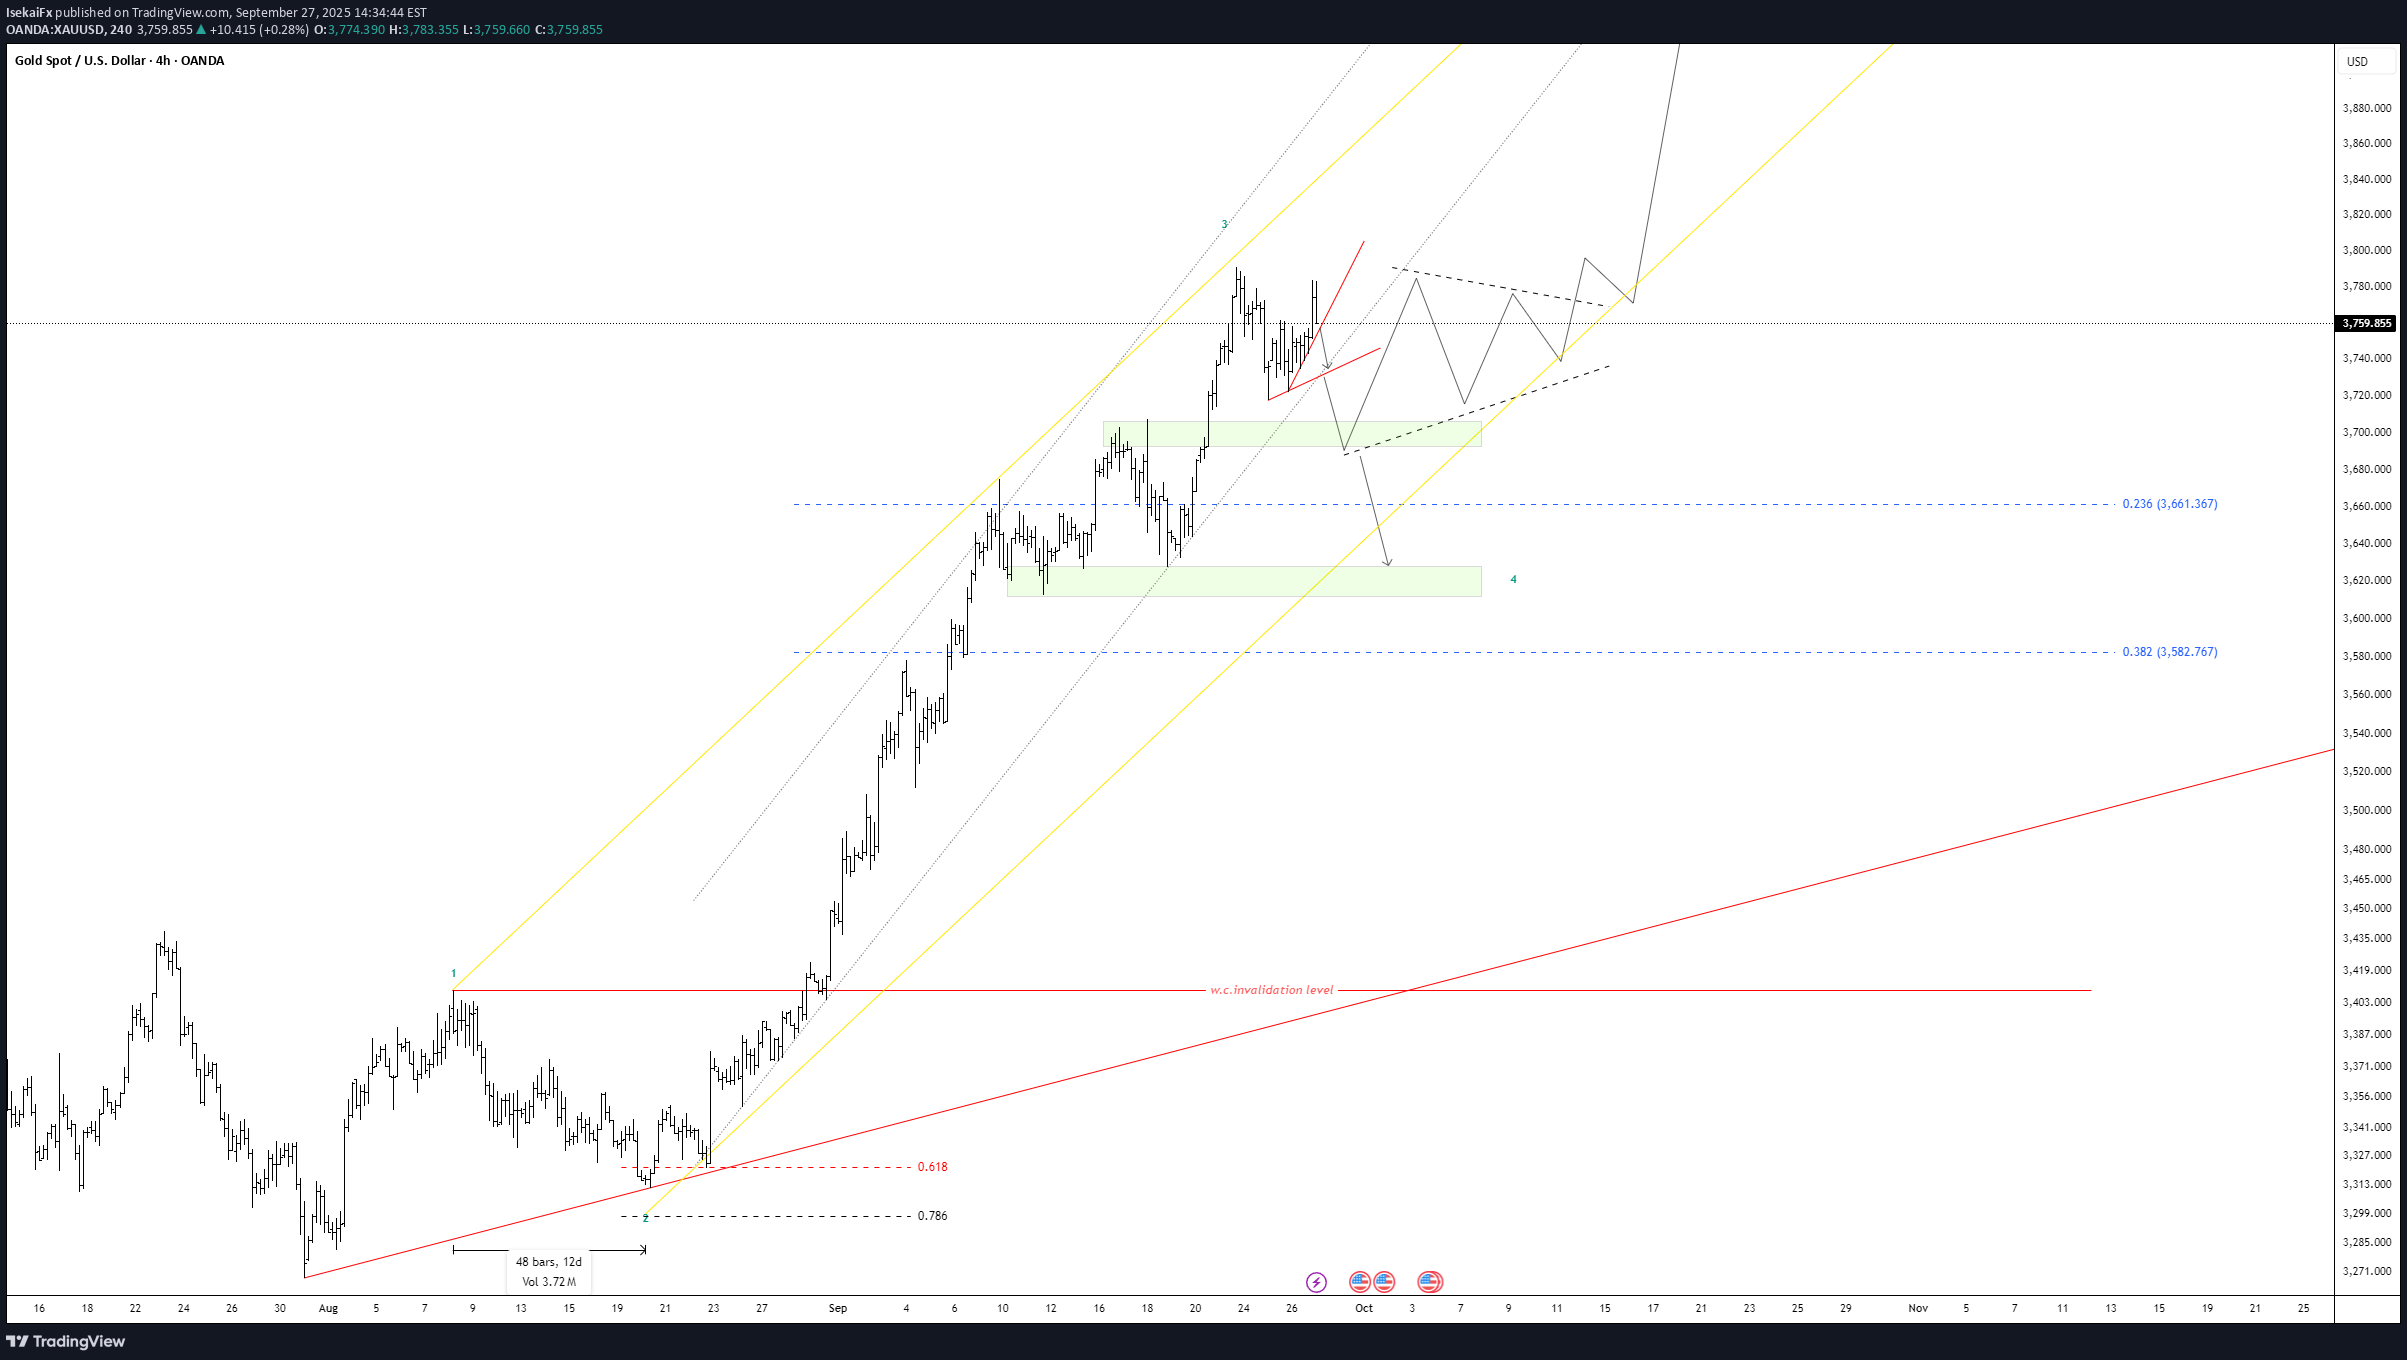
Market Overview The broader price structure clearly remains in an uptrend. However, a short-term bearish formation recently developed but was quickly invalidated as the market reversed into bullish momentum again on Friday. Before the market closed, price retraced to retest the breakout level. If it can hold above this area and establish a higher structure, the uptrend is likely to continue until the trend shows signs of exhaustion. Conversely, if the retest fails and price breaks back below the ascending trendline, the market may enter a sideways consolidation phase, potentially forming a corrective pattern before the next decisive move.
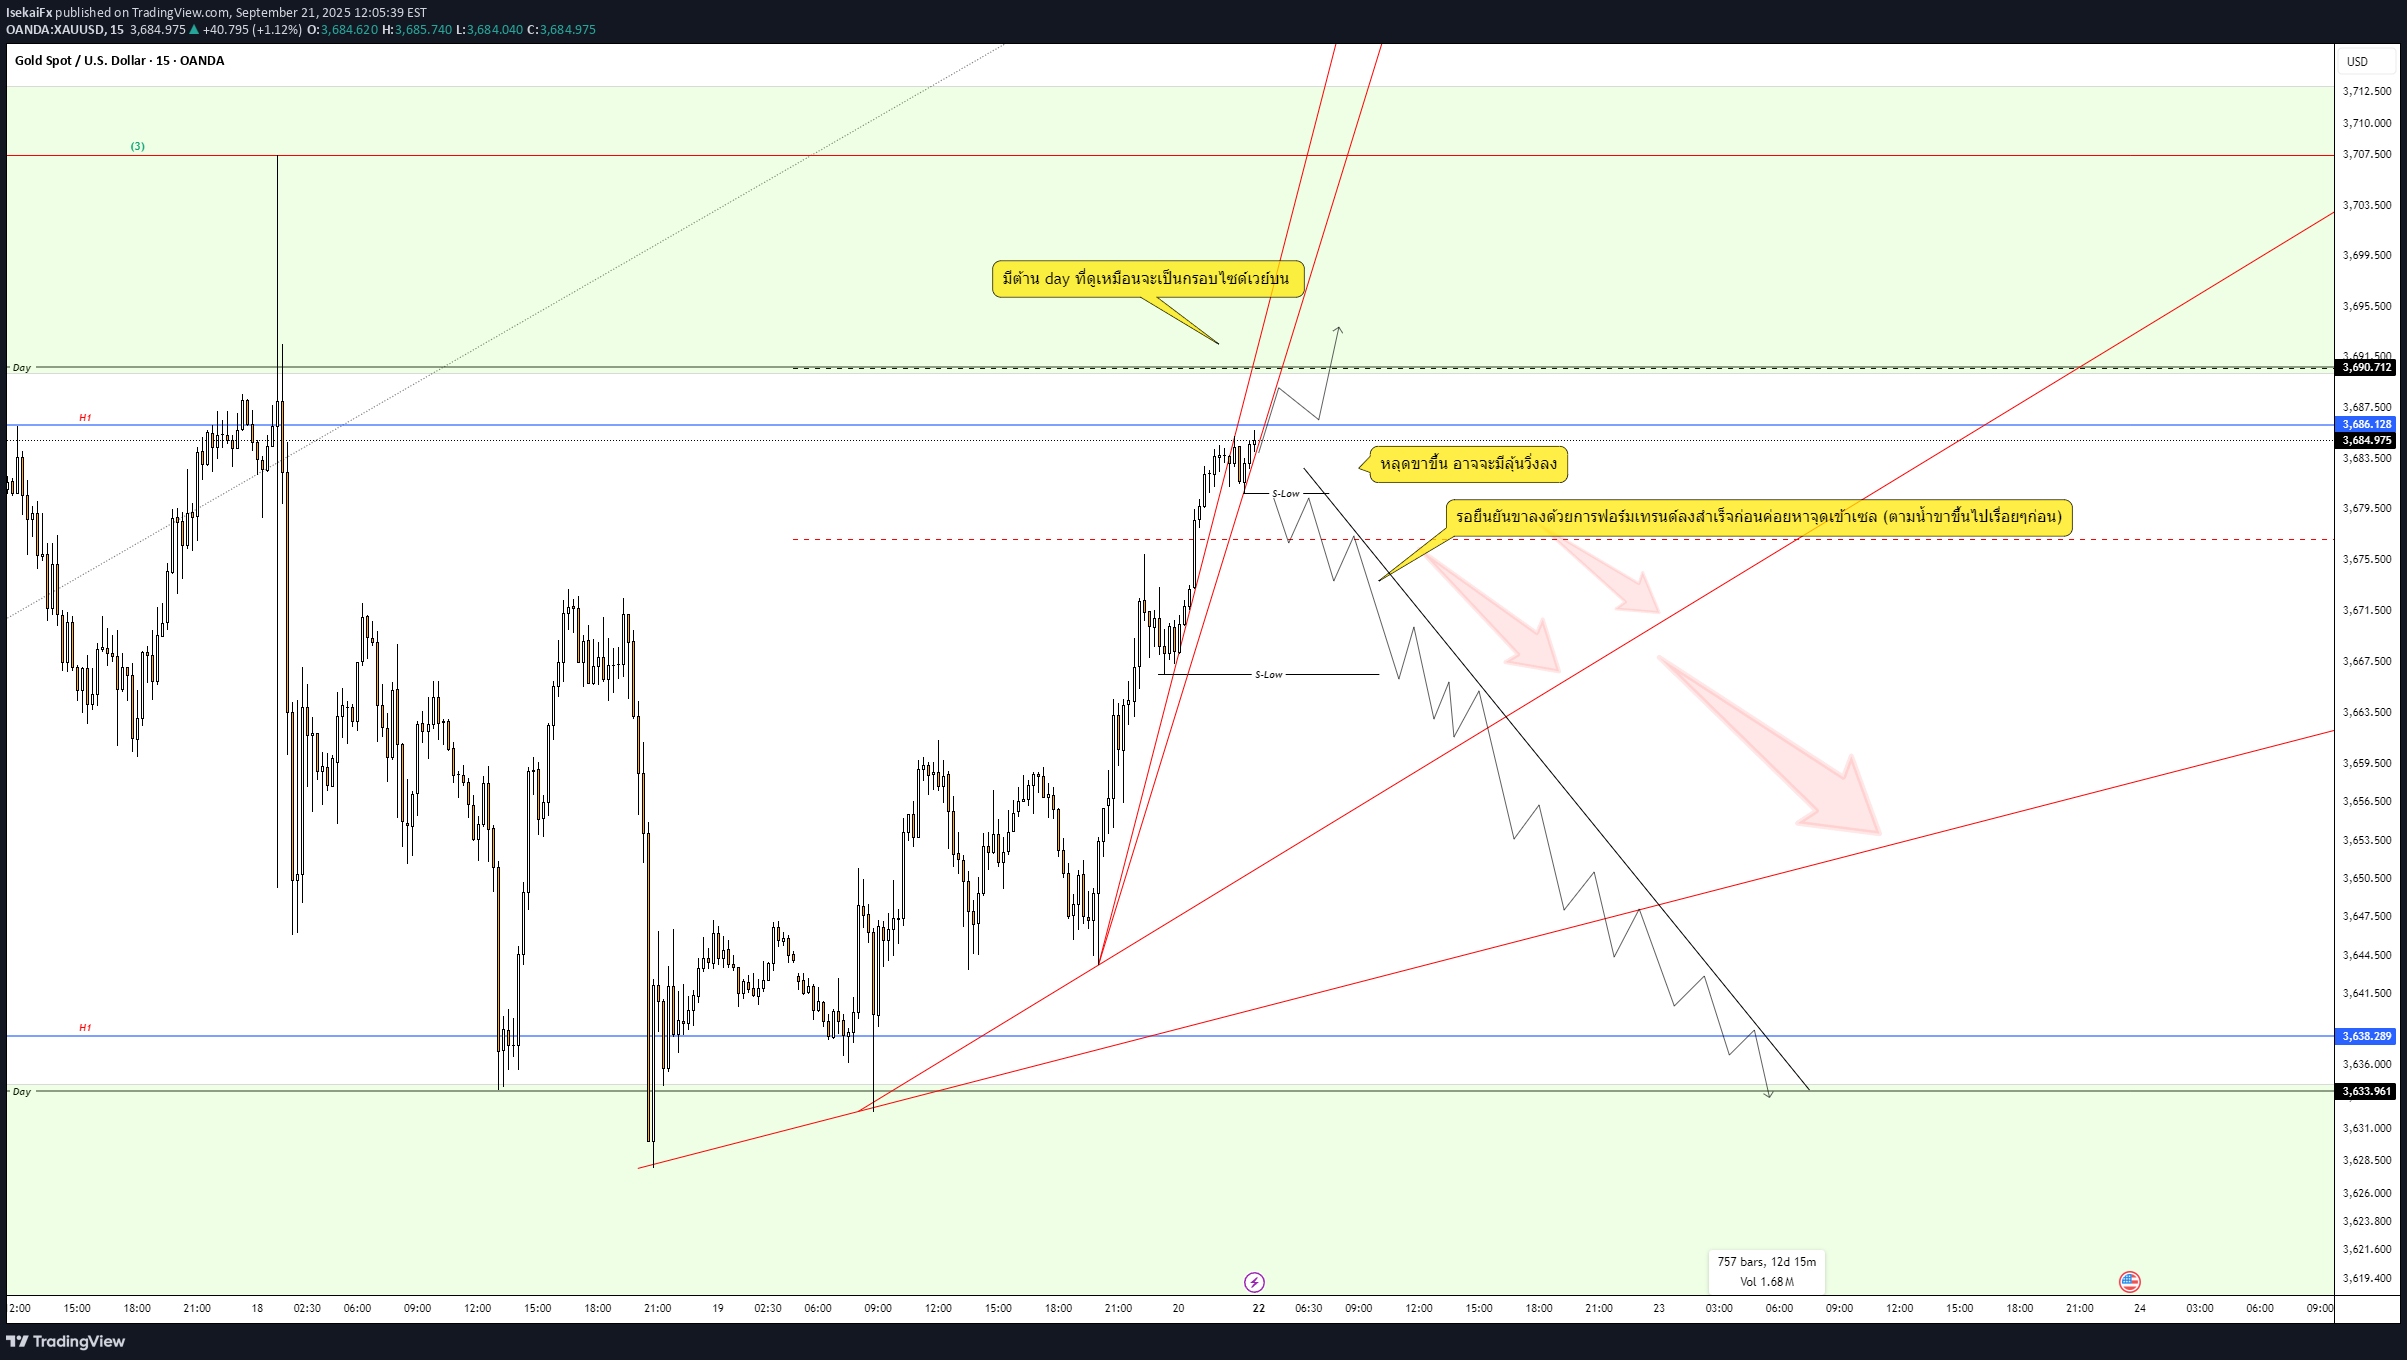
Daily (D1) The overall trend is clearly bullish. There has been an upside breakout on the daily timeframe, which could potentially mark the end of wave 3. Price is now consolidating in what looks like a sideways correction, likely forming wave 4. H1 Price has rebounded from the daily support (lower range of the sideways zone). As long as the short-term uptrend on H1 holds, price should be able to test the upper boundary of the range without much difficulty. m15 Not the best setup for buying at the moment, since price is already close to the daily range resistance. A valid buy could be considered only if a breakout occurs followed by a retracement with a favorable risk–reward setup. For selling, it’s better to wait until a clear downtrend structure forms rather than attempting to counter-trade prematurely. Summary Price is moving within a range until either a breakout or a clearer correction structure develops. Possible approaches are: Trade the range (buy near the lower boundary, sell near the upper boundary). Or wait for a breakout and confirmation of continuation before entering.
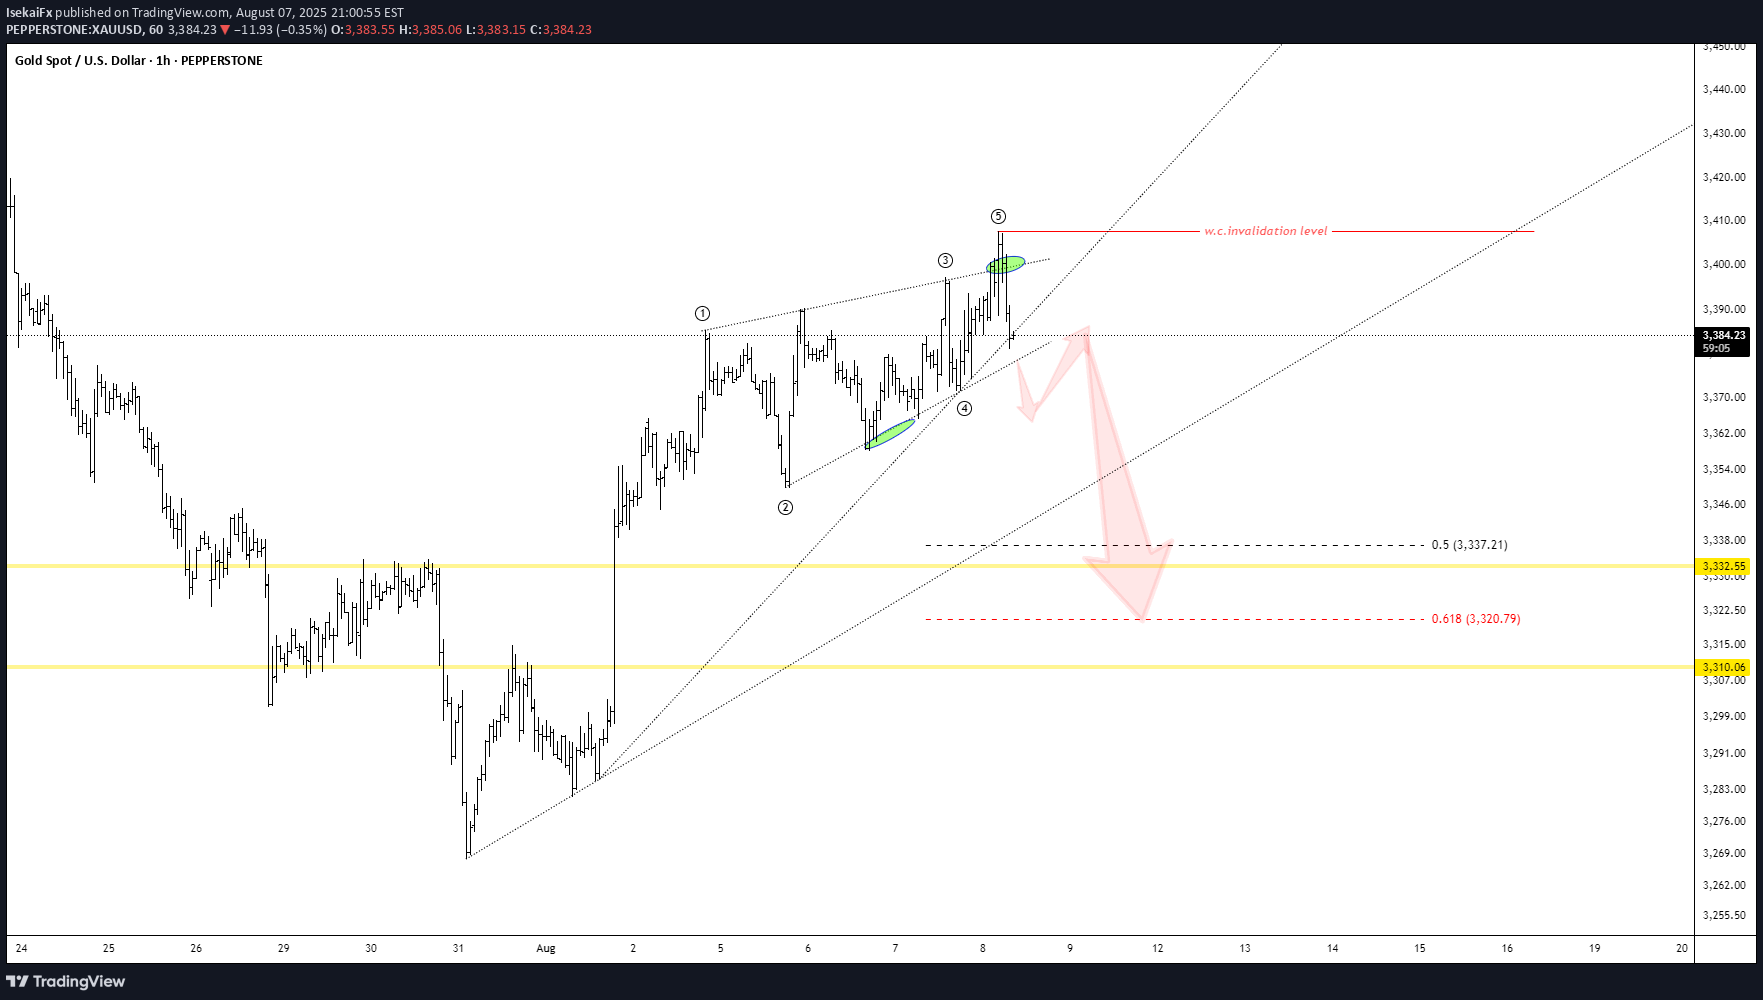
What we know: - Price has moved up strongly but is now forming a sideway-up structure. - The range can be drawn as a wedge. - Structure looks similar to a Motive wave. - There are signs of Throw-under and Throw-over. - This could be interpreted as a Leading Contracting Diagonal, or possibly evolving into a Flat pattern. What to do: - Wait for the uptrend to be invalidated by a breakout to the downside, - Then observe the sideways movement to assess the next trend direction.
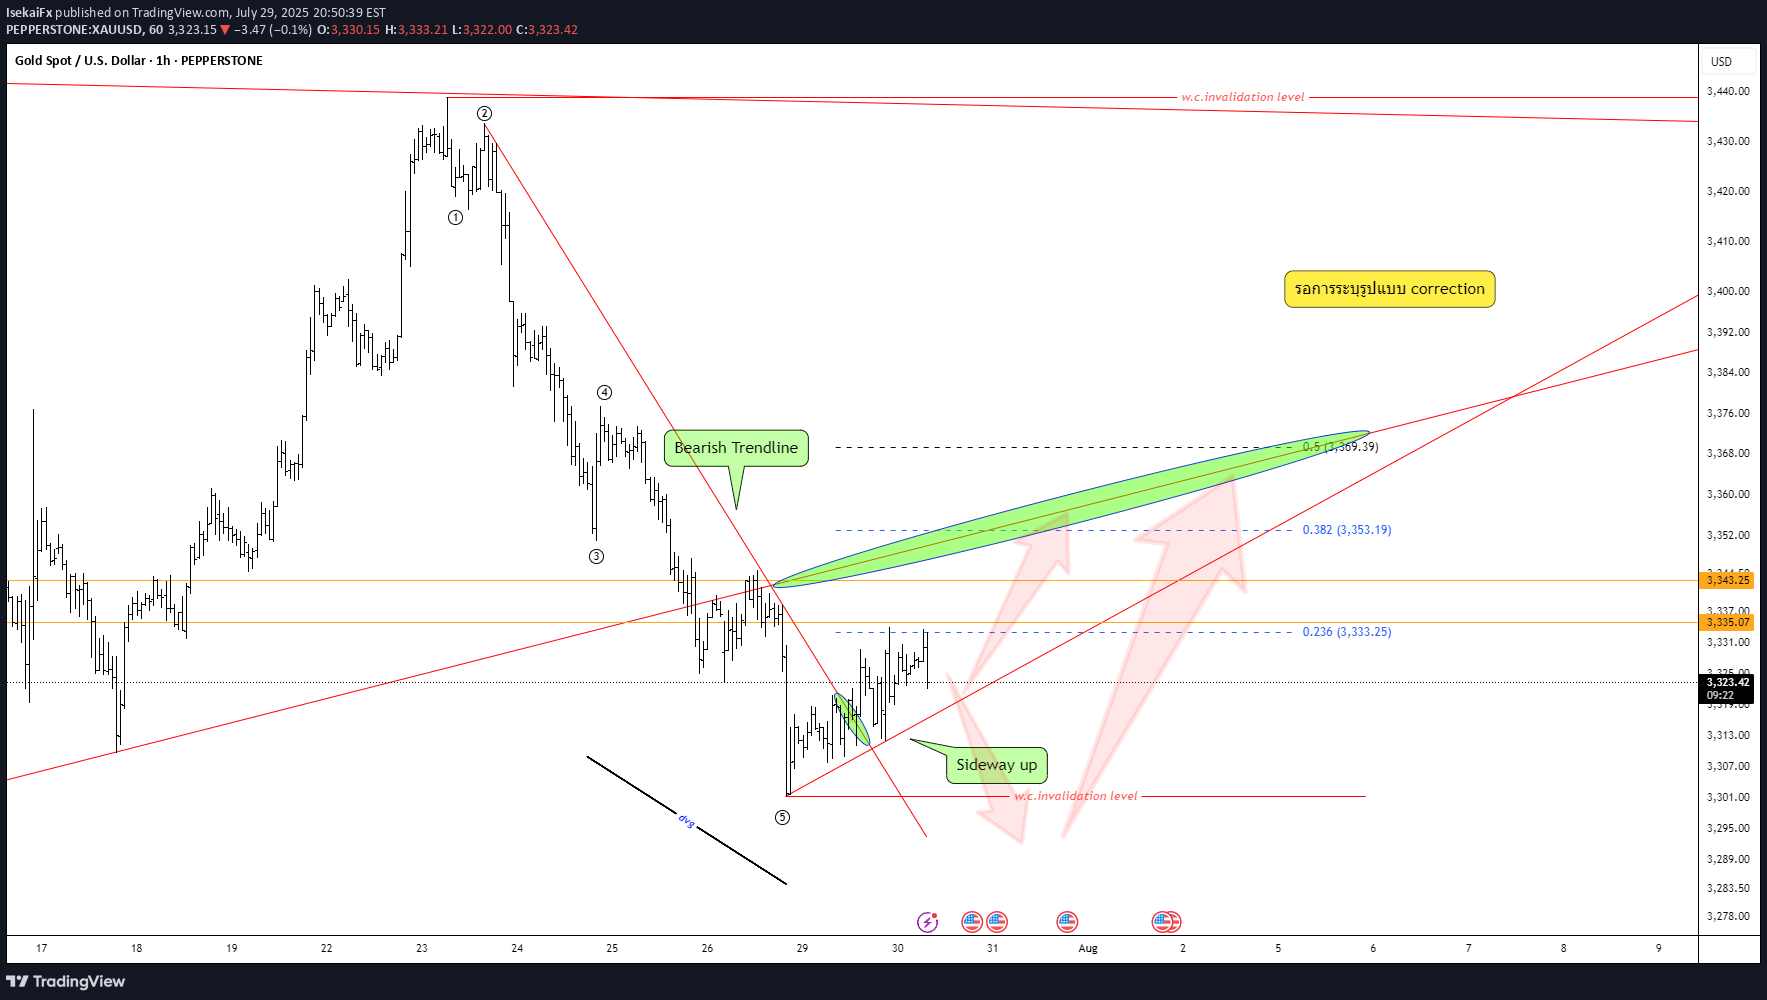
Quick Take: - Strong bearish move, but wave structure still unclear — not a confirmed impulse. - Bear trendline has broken; market now leaning toward sideways-up. - Divergence is visible. Plan: Wait for correction pattern → confirm with your system → execute only with full data and strict risk management.
Disclaimer
Any content and materials included in Sahmeto's website and official communication channels are a compilation of personal opinions and analyses and are not binding. They do not constitute any recommendation for buying, selling, entering or exiting the stock market and cryptocurrency market. Also, all news and analyses included in the website and channels are merely republished information from official and unofficial domestic and foreign sources, and it is obvious that users of the said content are responsible for following up and ensuring the authenticity and accuracy of the materials. Therefore, while disclaiming responsibility, it is declared that the responsibility for any decision-making, action, and potential profit and loss in the capital market and cryptocurrency market lies with the trader.