HTC-ForexCryptoTrader
@t_HTC-ForexCryptoTrader
What symbols does the trader recommend buying?
Purchase History
پیام های تریدر
Filter
Signal Type

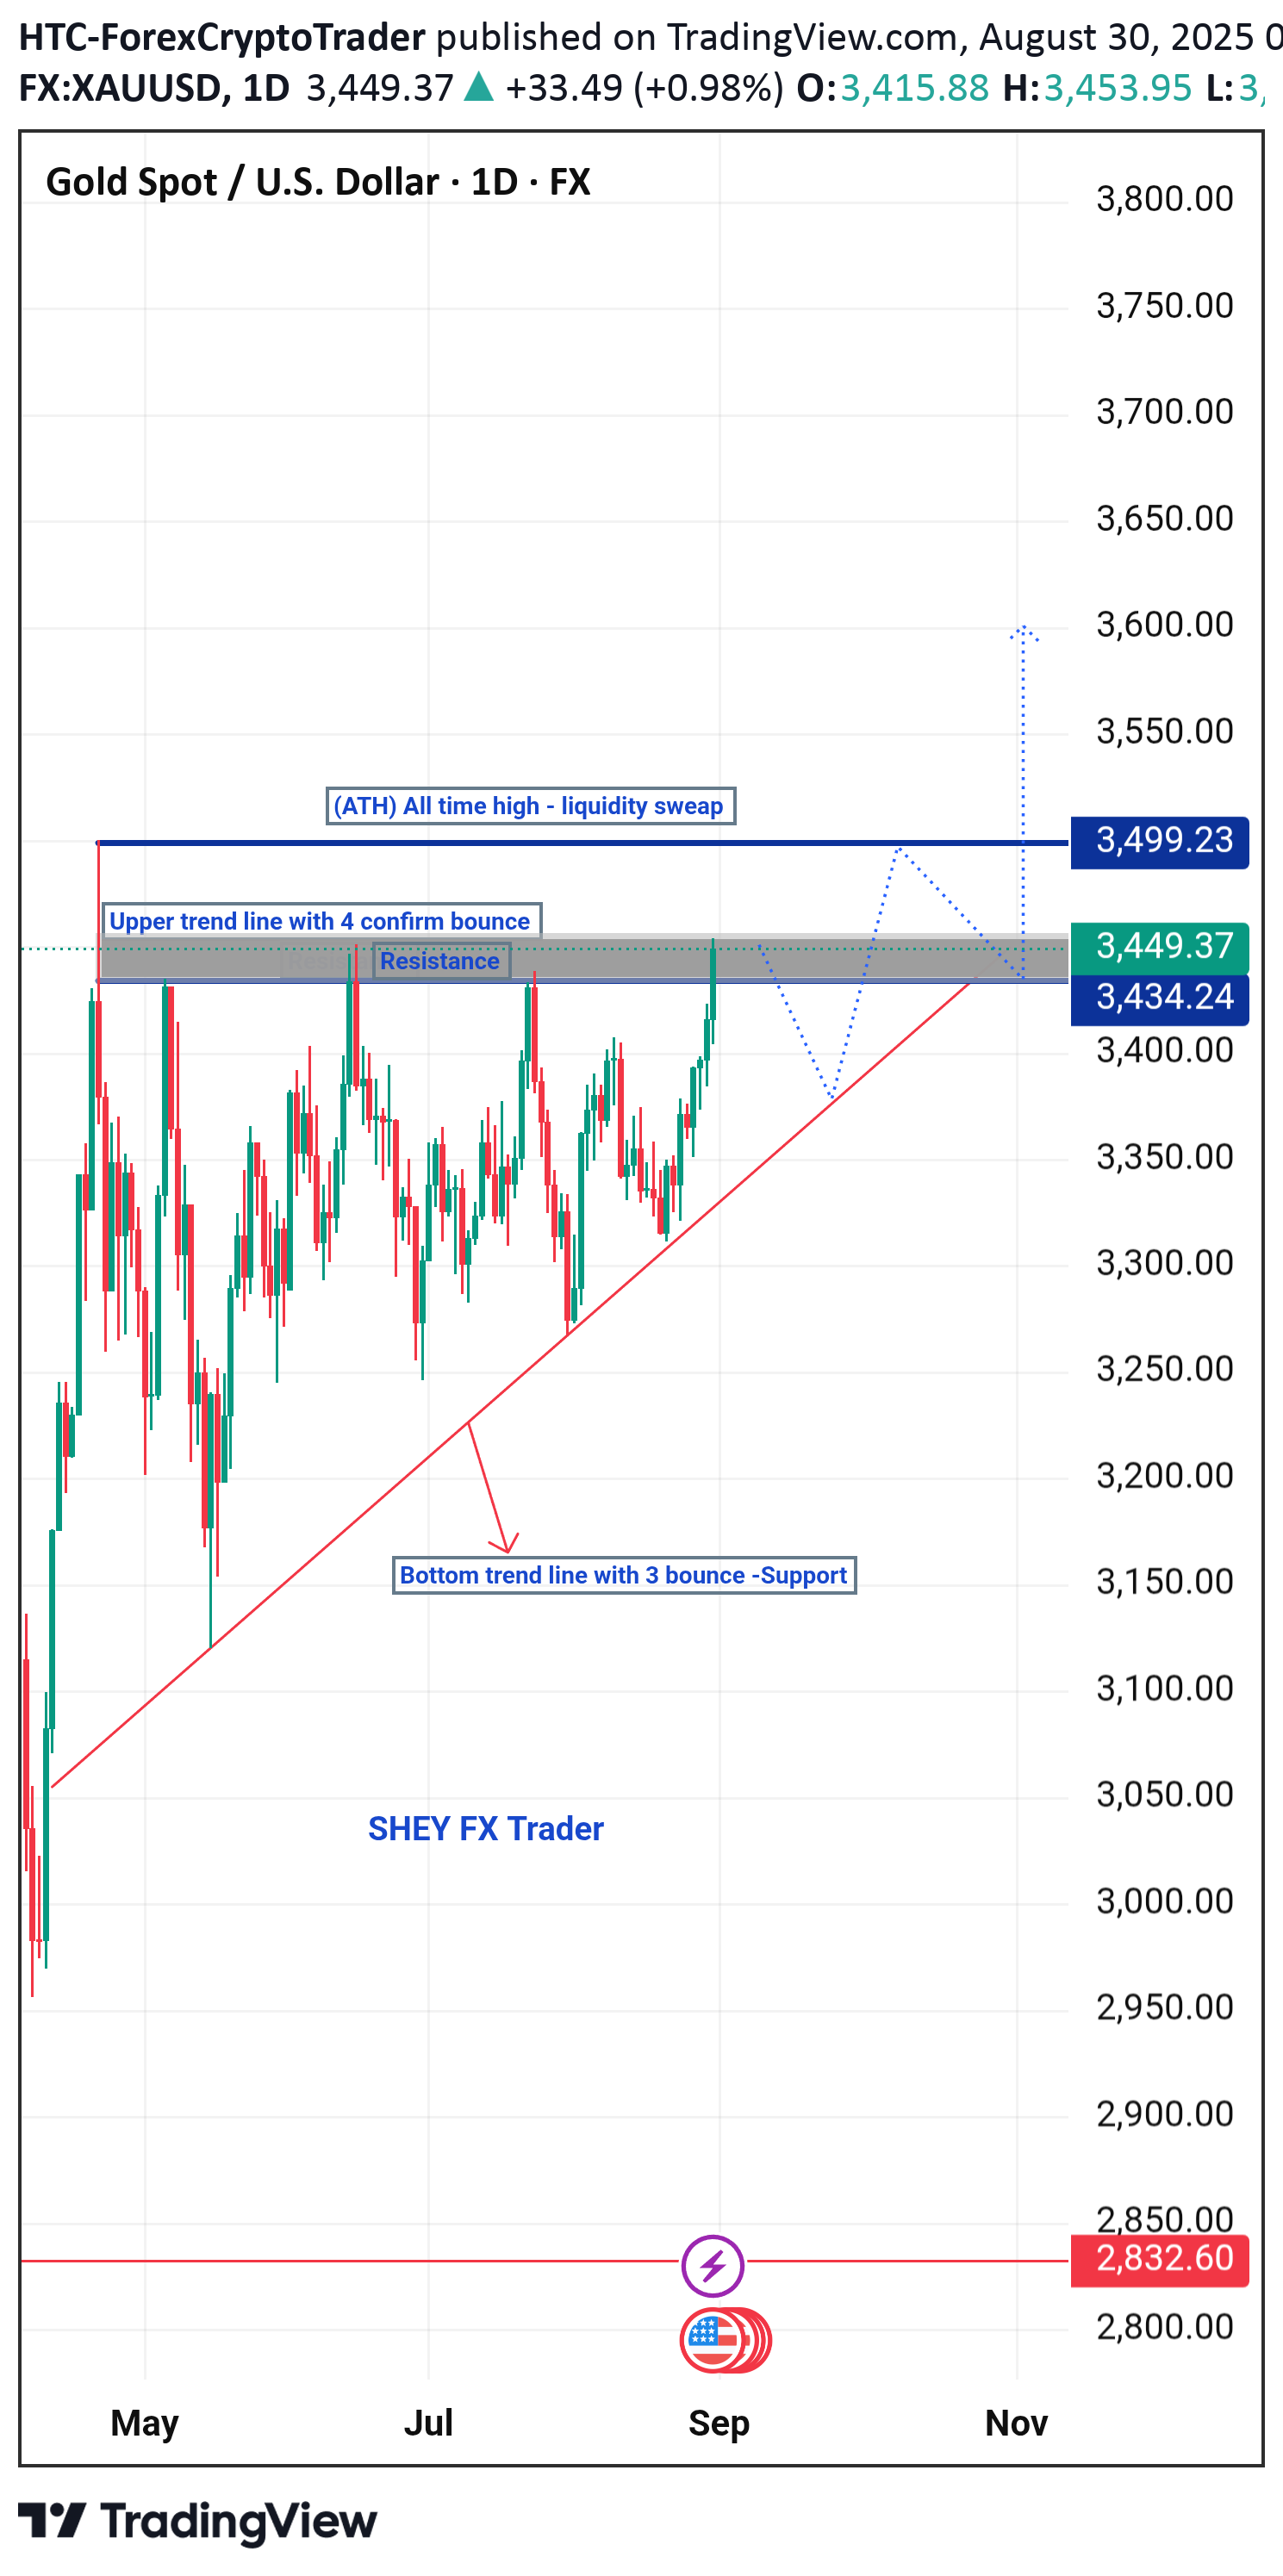
Here is an analysis of the Gold/U.S. Dollar (XAU/USD) daily chart. The chart displays a classic ascending triangle pattern, which is typically considered a bullish continuation pattern. This suggests that after a period of consolidation, the price is likely to break out to the upside. Key Observations 1.) Ascending Triangle: The price is consolidating between a horizontal resistance level and a rising support trendline. This creates a series of "higher lows," indicating increasing buying pressure. 2.) Horizontal Resistance: There is a strong resistance zone identified between approximately $3,434.24 and $3,449.37. The chart notes that the price has tested and rejected this level four times, confirming it as a significant barrier. 3.) Rising Support: An upward-sloping trendline acts as support. The price has bounced off this line three times, showing that buyers are consistently stepping in at higher prices. 4.) Price Action: The price is currently testing the upper resistance line again. A decisive breakout above this level would confirm the bullish pattern. Potential Scenarios. 5.) Bullish Breakout (Most Likely Scenario): The ascending triangle pattern suggests a high probability of an upward breakout. If the price closes decisively above the resistance zone (~$3,450), the next major target would likely be the All-Time High (ATH) noted at $3,499.23. The dashed lines on your chart illustrate this potential path: a small pullback, a final bounce off the support line, and then a strong push through resistance. 6.) Bearish Breakdown (Less Likely Scenario): If the price fails to break the resistance and instead breaks below the rising support trendline, the bullish pattern would be invalidated. This could lead to a significant move downward. In summary, the technical setup on this chart is bullish, with the price coiling up for a potential move higher. The key event to watch for is a confirmed breakout above the horizontal resistance.

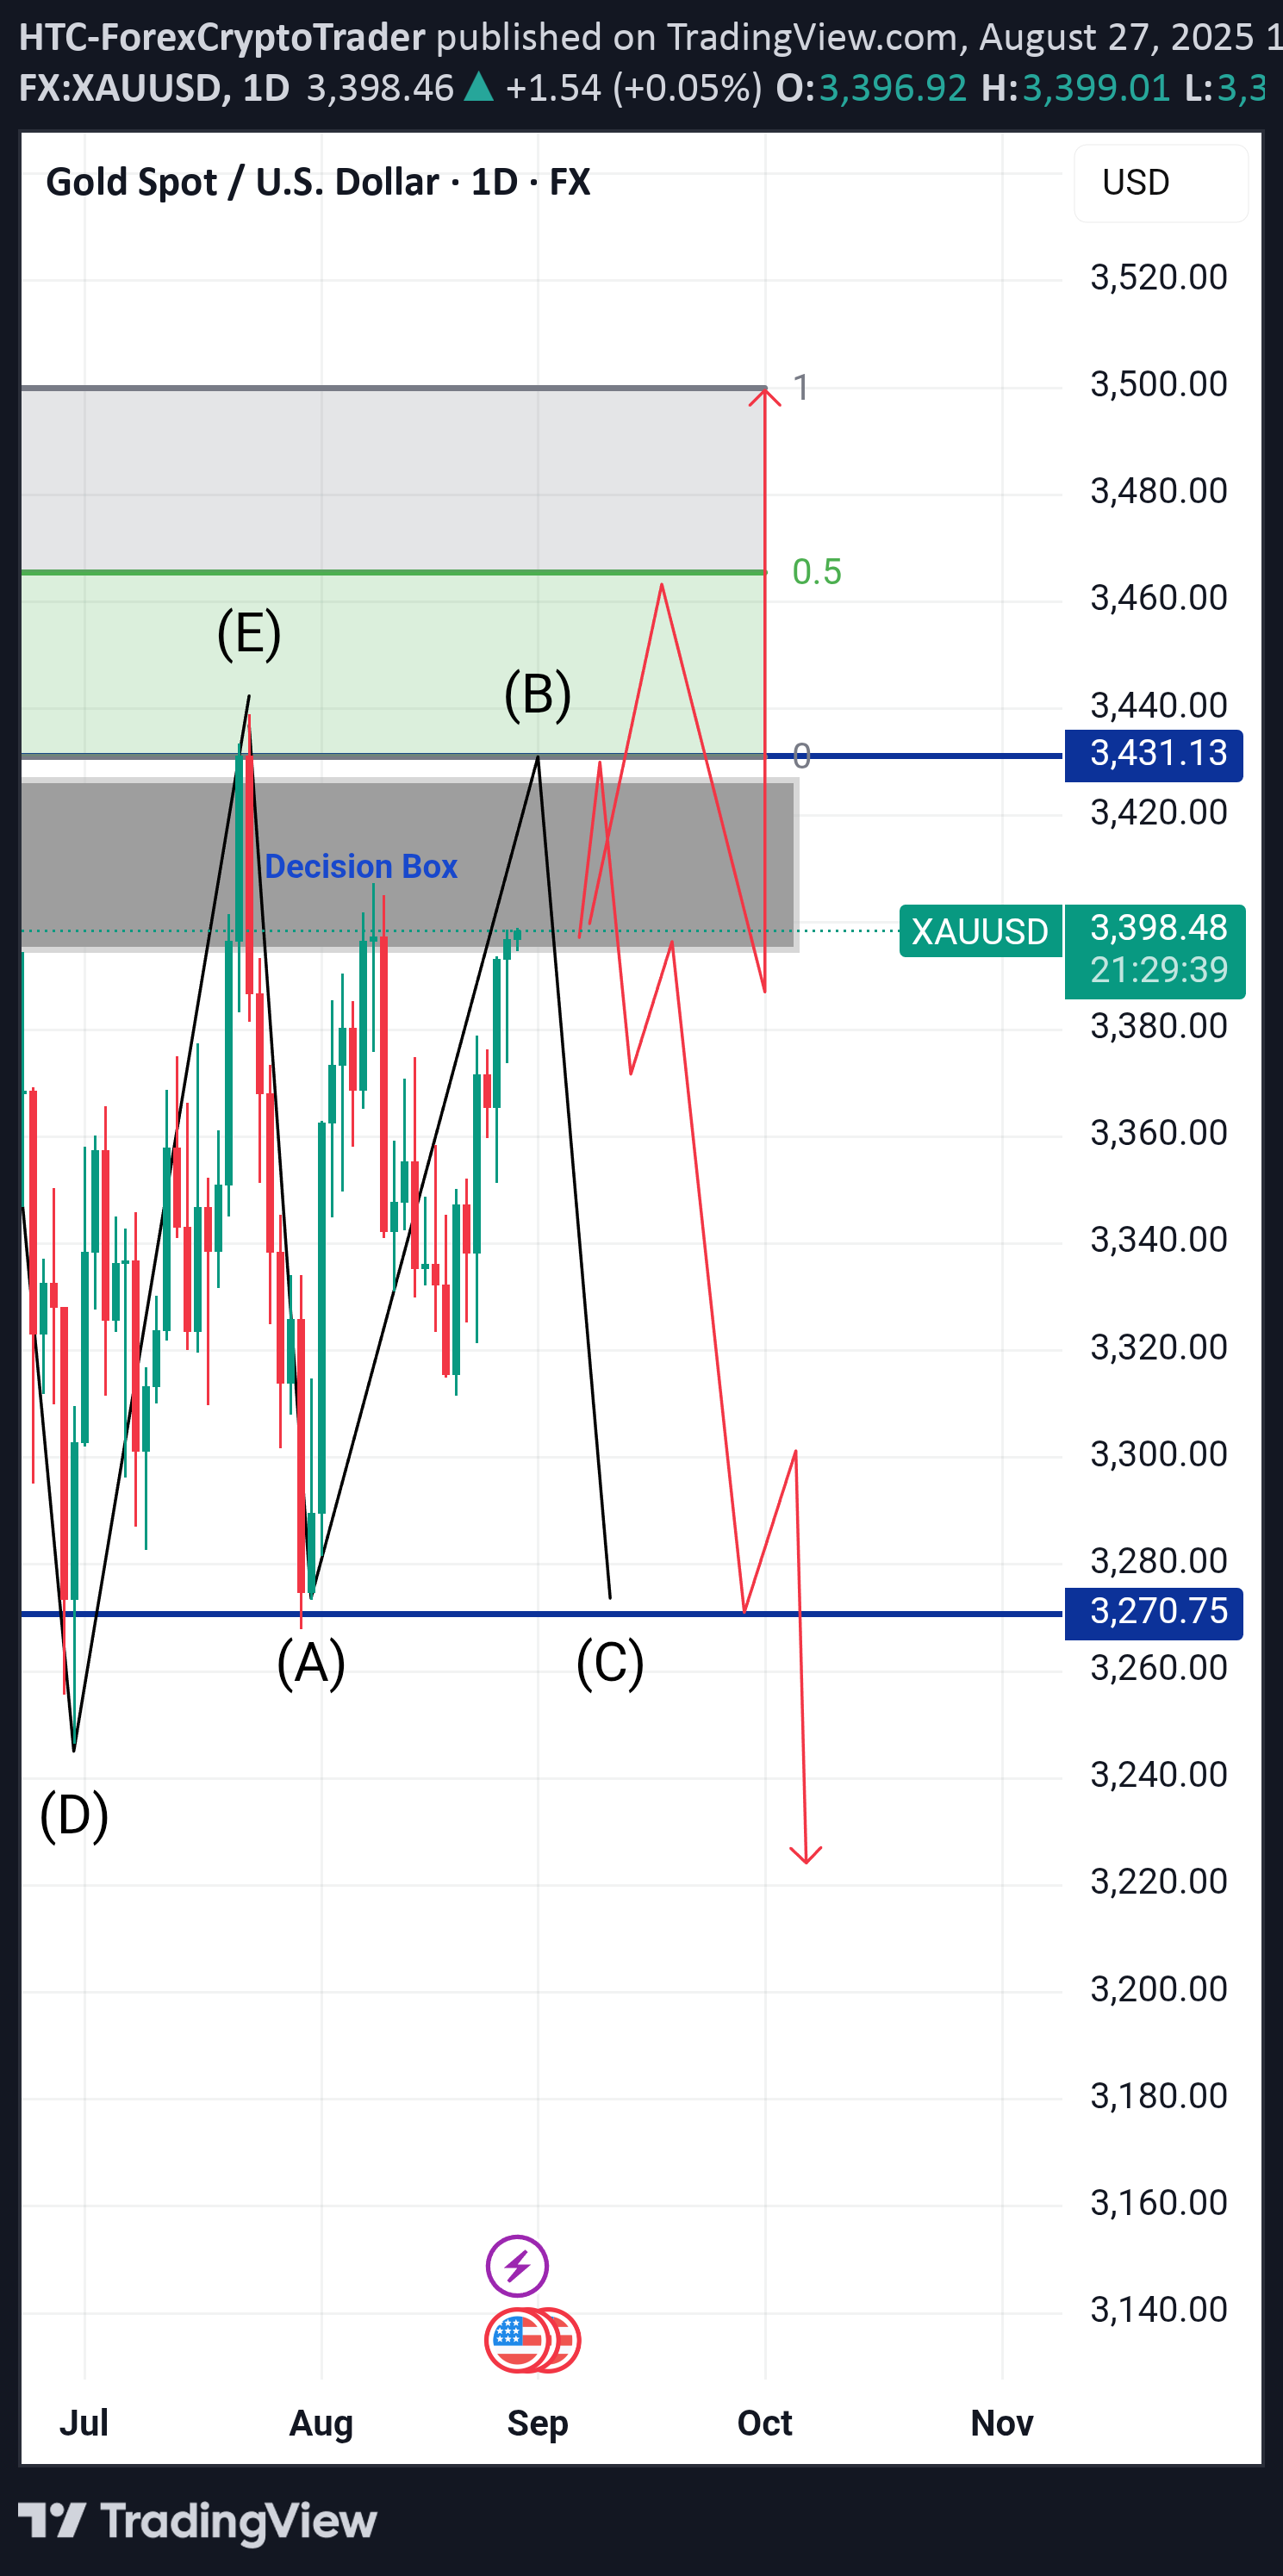
The chart shows that after a significant rally in April, gold has been trading within a large horizontal range or a "channel" between roughly $3,270.75 and $3,431.13. This indicates a period of consolidation where neither buyers nor sellers have been able to gain a clear advantage. Support and Resistance: Resistance: The upper boundary of the channel is around $3,431.13. The chart labels a breakout above this level as a "Resistance BO" (breakout). This level has been tested multiple times in May, July, and August, holding as a strong ceiling for the price. * Support: The lower boundary is around $3,270.75. This level has also been tested multiple times (in May, July, and August), acting as a solid floor. "Decision Box": A smaller, more recent range is highlighted between roughly $3,380 and $3,400, labeled as a "Decision Box." The price is currently at a critical point, and a move outside of this box could signal the next major trend. This is pattern recognition approach First Move Down (A-B): The initial drop from the April high is labeled as A to B. Mid-Range Swings (C-D-E-A-B): The subsequent movements within the range are labeled C, D, E, and then a new A and B, indicating that the price is moving between support and resistance levels. Future Projections I have two potential scenarios for future price movement, indicated by the red and pink arrows: Bearish Scenario (Red Arrows): ✅ The primary path shows the price failing to break the resistance at $3,431.13. ✅ It then projects a move back down to the support level at $3,270.75. ✅ A breakdown below this support could lead to a further decline, potentially toward $3,200 or lower. ✨ Bullish Scenario (Pink Arrows): ✨This path shows the price successfully breaking above the resistance at $3,431.13. ✨The target for this breakout is the Fibonacci extension level at $3,580, which is the next major resistance level. This level is also labeled "1" on the Fibonacci tool. * The "0.5" level around $3,500 is also marked as potential resistance on the way up.

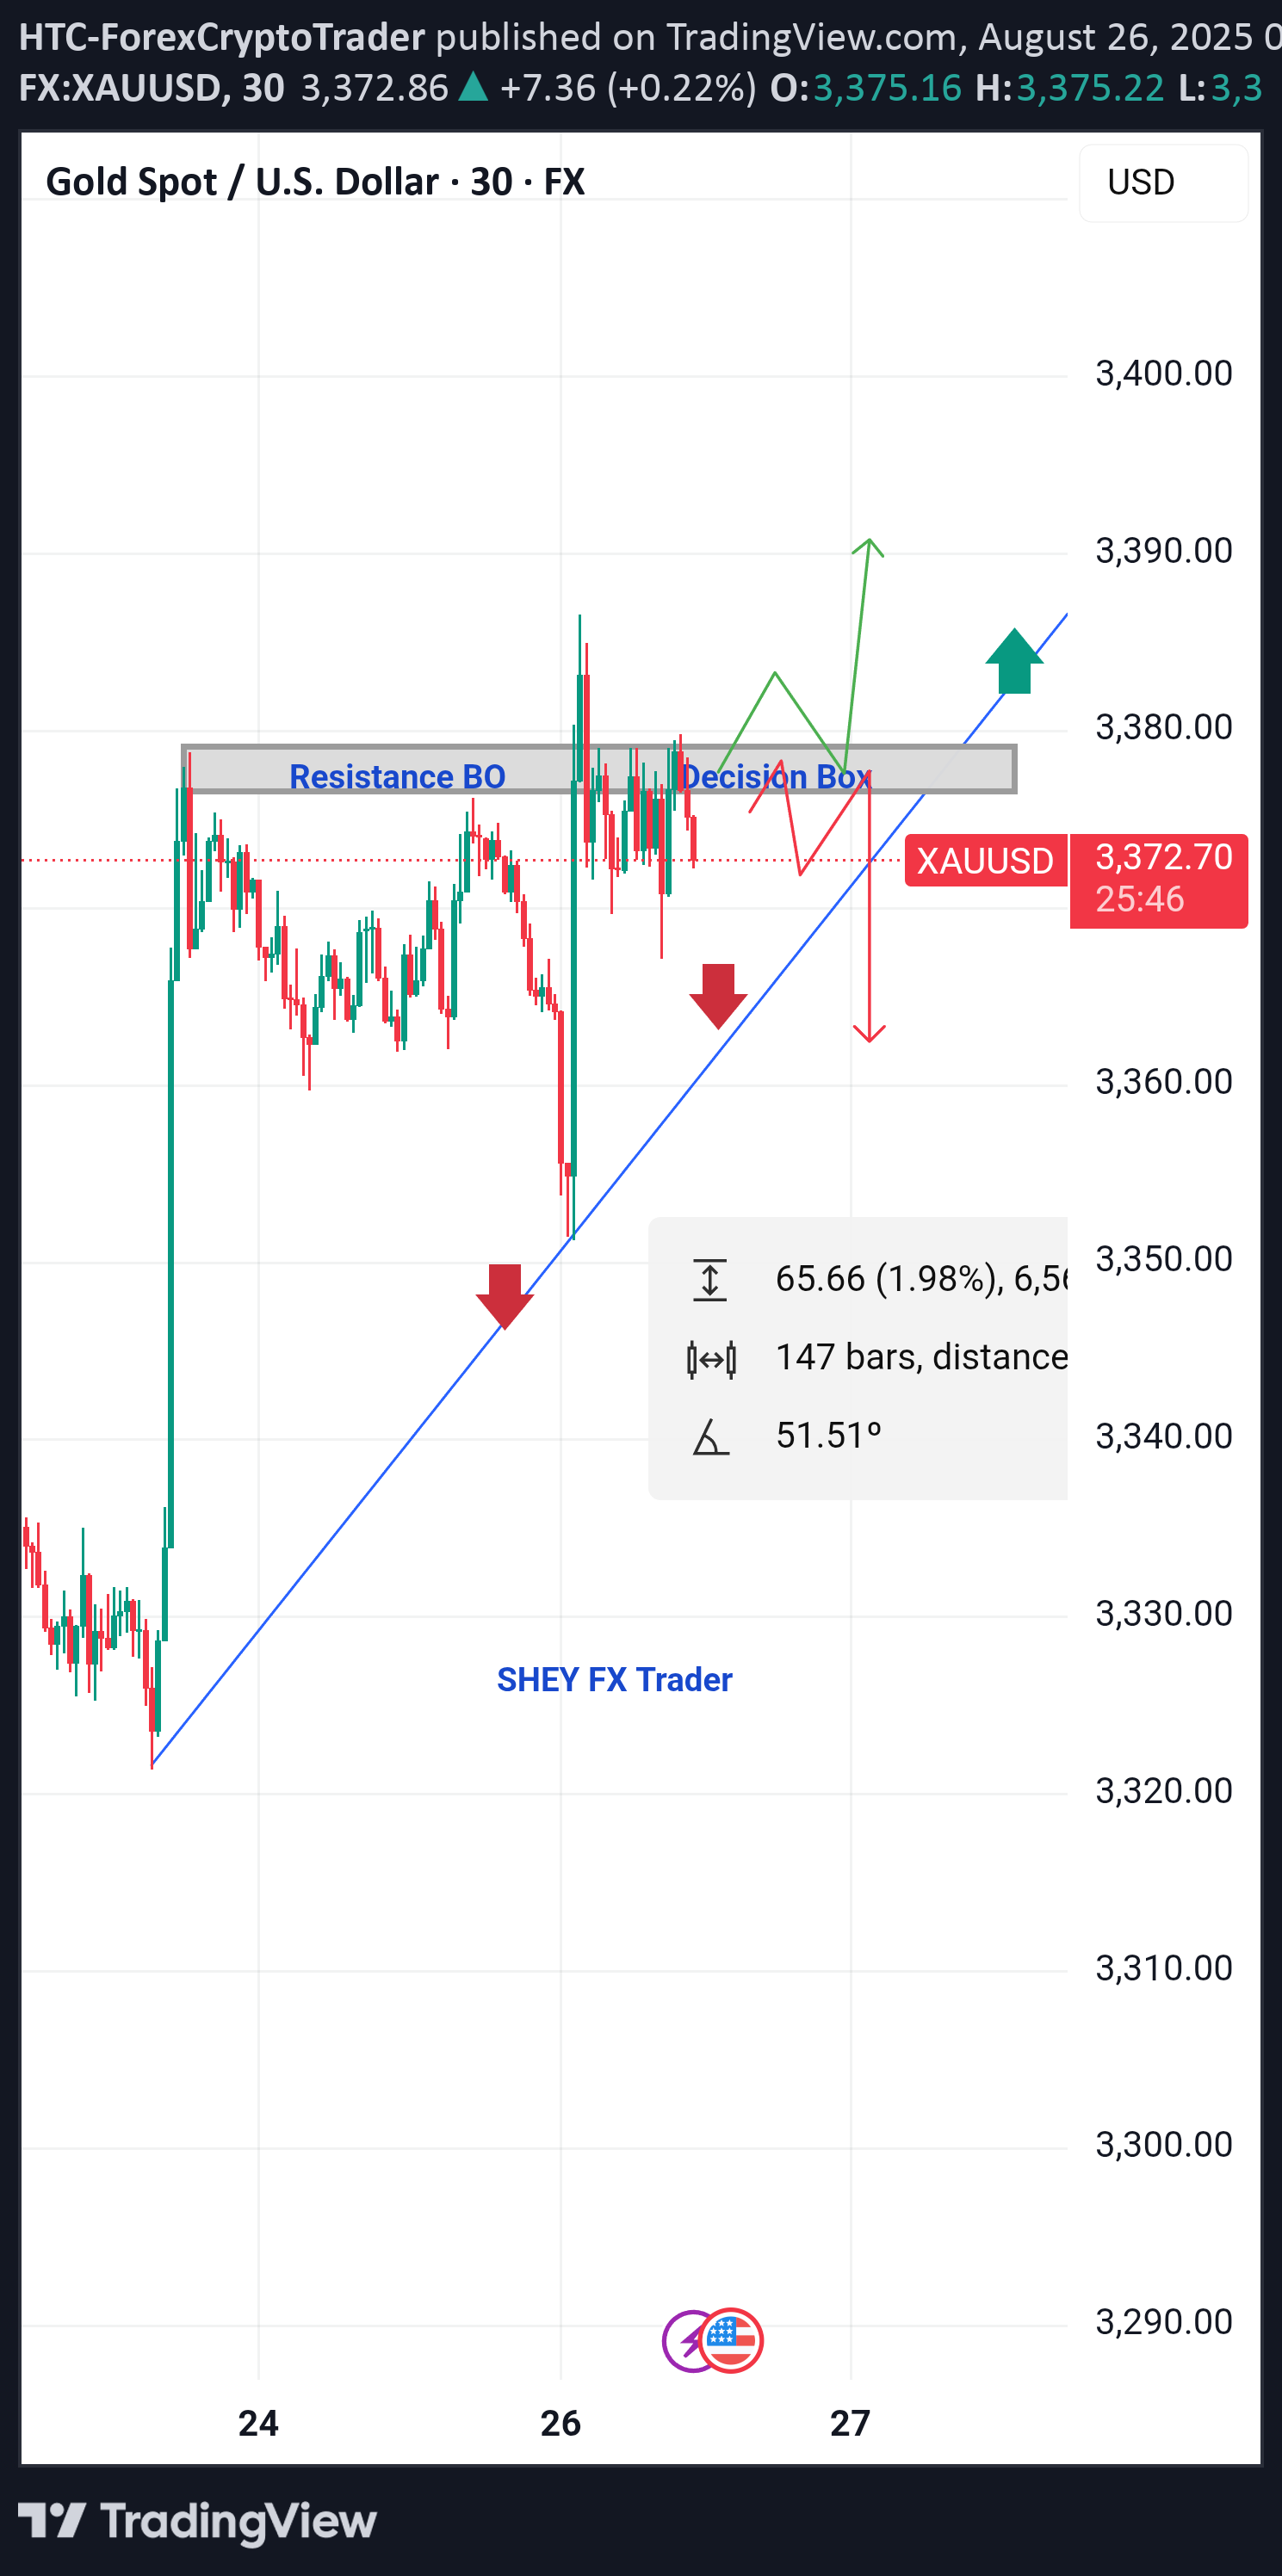
Strong momentum of bullish during Asia session M30 EG sell will be my decision movement for today, will price continue bullish after break of resistance zone. Let's monitor from a lower TF. I will just wait for clear break out and clear market structure before riding the wave 🌊
Disclaimer
Any content and materials included in Sahmeto's website and official communication channels are a compilation of personal opinions and analyses and are not binding. They do not constitute any recommendation for buying, selling, entering or exiting the stock market and cryptocurrency market. Also, all news and analyses included in the website and channels are merely republished information from official and unofficial domestic and foreign sources, and it is obvious that users of the said content are responsible for following up and ensuring the authenticity and accuracy of the materials. Therefore, while disclaiming responsibility, it is declared that the responsibility for any decision-making, action, and potential profit and loss in the capital market and cryptocurrency market lies with the trader.