
Guapeva
@t_Guapeva

What symbols does the trader recommend buying?
Purchase History
پیام های تریدر
Filter
Guapeva
الگوی شگفتانگیز لایتکوین ۲۰۲۴: آیا منتظر تکرار رالی ۲۰۱۷ هستید؟
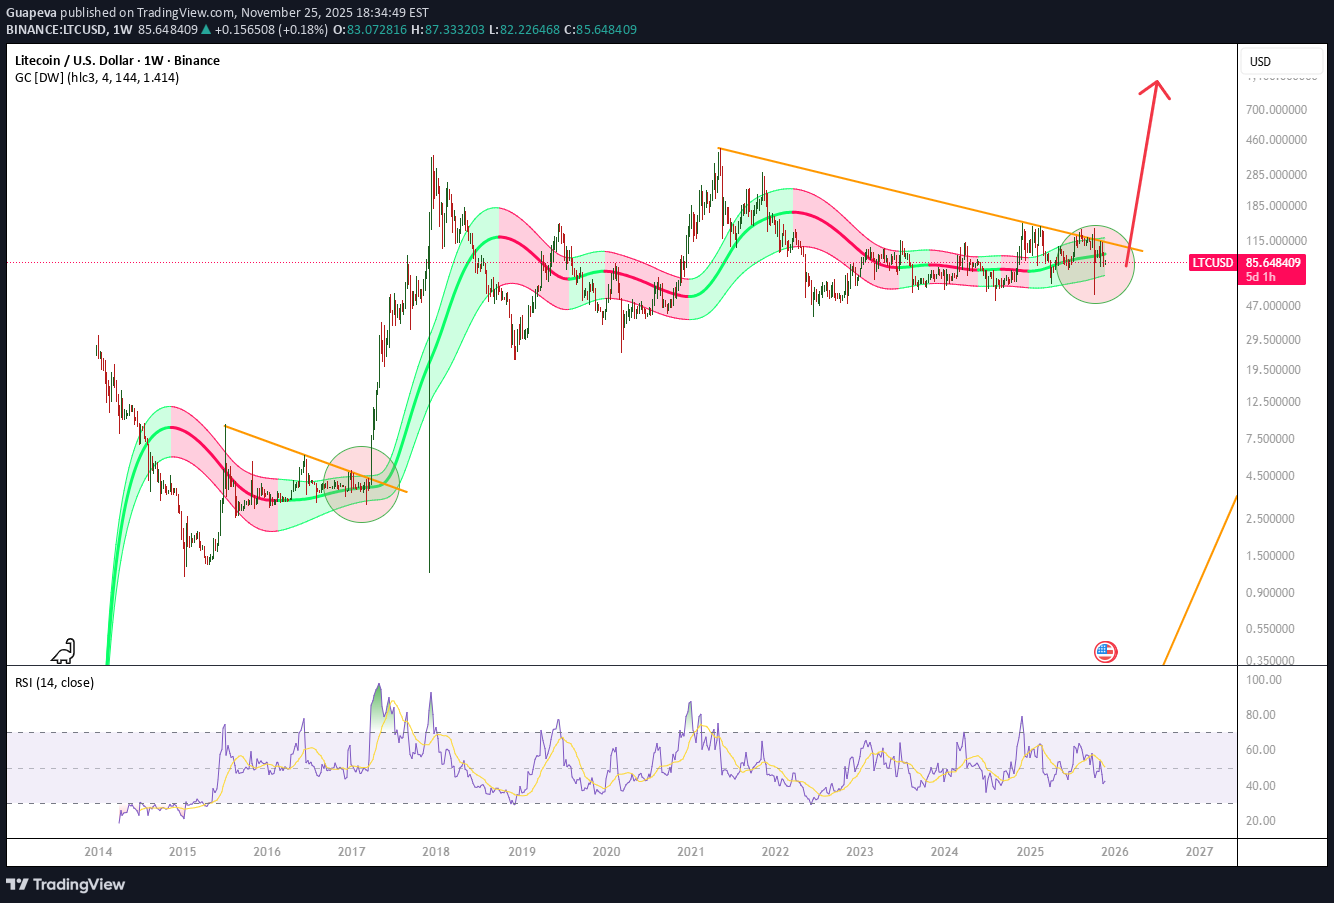
Litecoin trades in really similar pattern to 2017. If you are afraid of bear market with coins priced like they are now, you could miss a great opportunity
Guapeva
اتریوم در آستانه انفجار صعودی؟ تحلیل ساده نمودار ETH و زمان شروع بازی بزرگ!
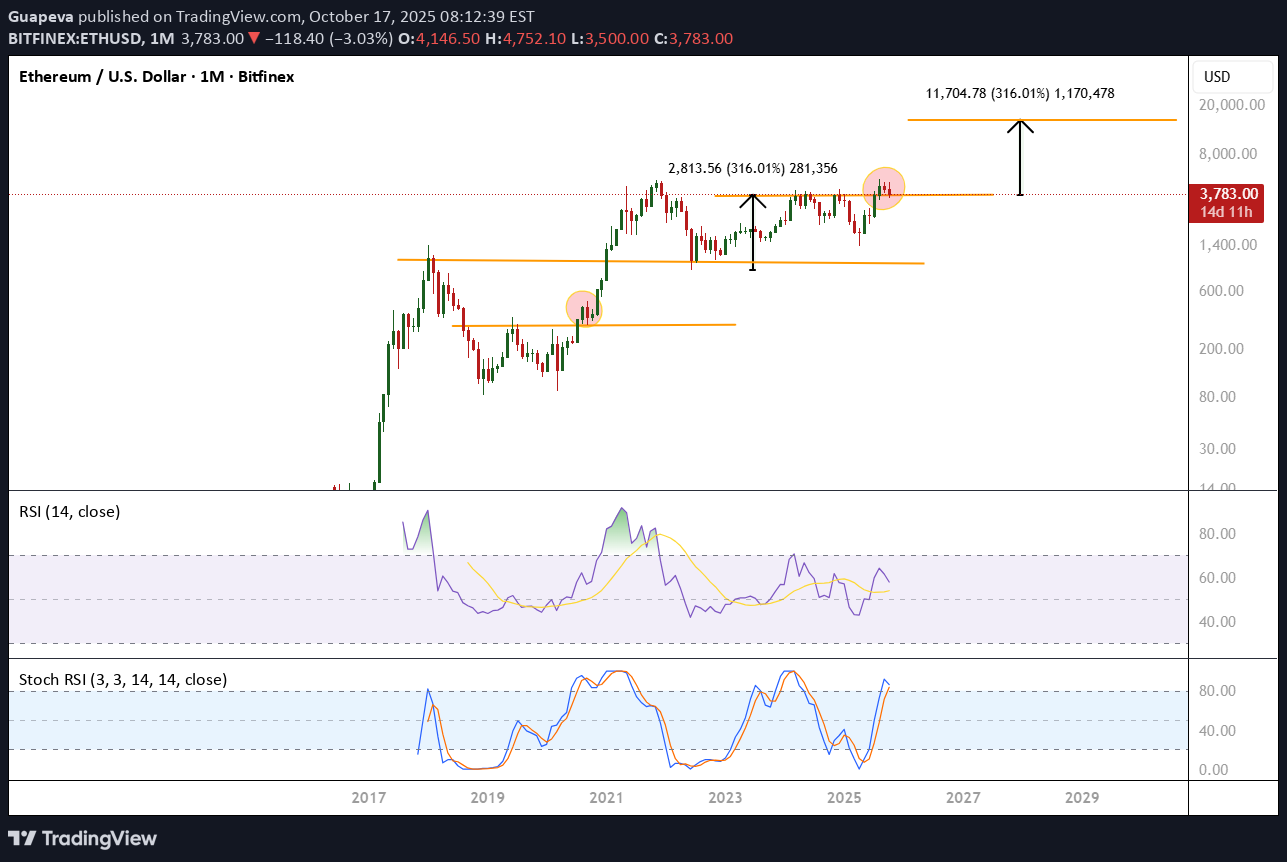
ETHEREUM is not bearish at all. we still sitting above support and retesting it. In my opinion a matter of time to reject to upside. The game has not even started yet
Guapeva
نئو (NEO) آماده جهش ۳ برابری؟ تحلیل سطوح فیبوناچی و سیگنال خرید قوی
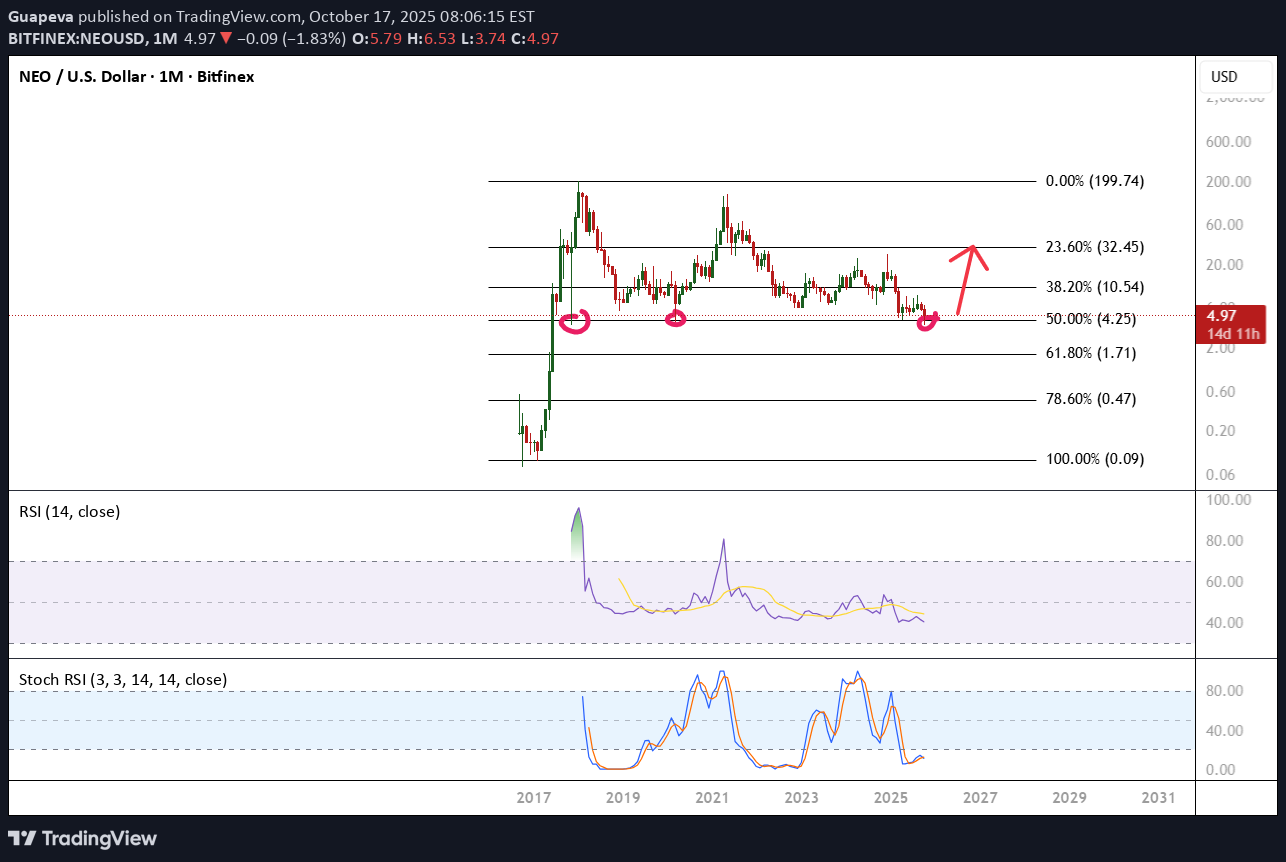
We can see NEO trades above a strong fib level. historically, it rejected to the upside 3x from here. Expecting happening again. Indicators oversold weekly and monthly
Guapeva
ETHUSD → Inverted Head & Shoulders Again
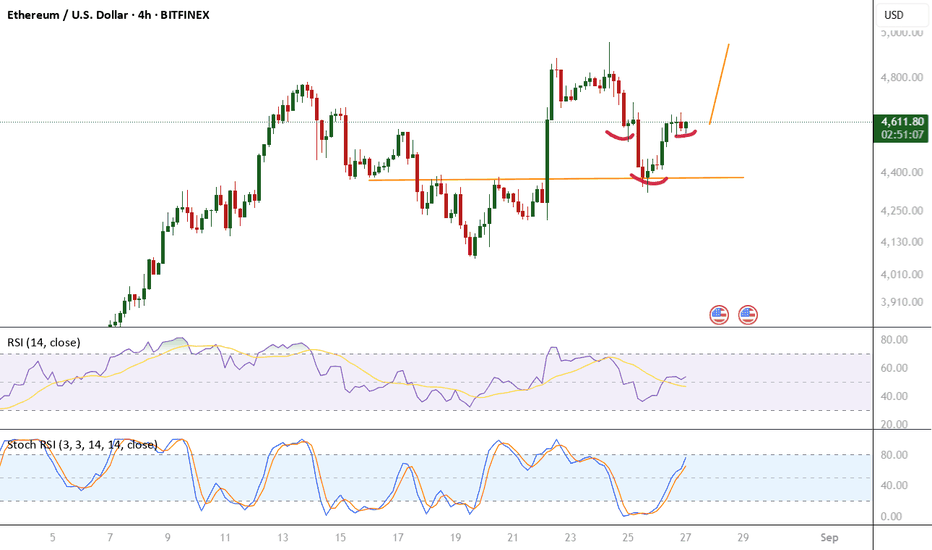
After the previous inverted H&S breakout (with price action coming back for a retest), Ethereum is now forming another inverted head and shoulders pattern. Currently, the 4H indicators are lining up in a very similar way as before, suggesting potential continuation. If confirmed, we could see a break to the upside again. Watching neckline levels closely for confirmation. Then going up till 6k as previously mentioned.
Guapeva
ETH/USD – Inverted Head & Shoulders and Bull Flag Setup
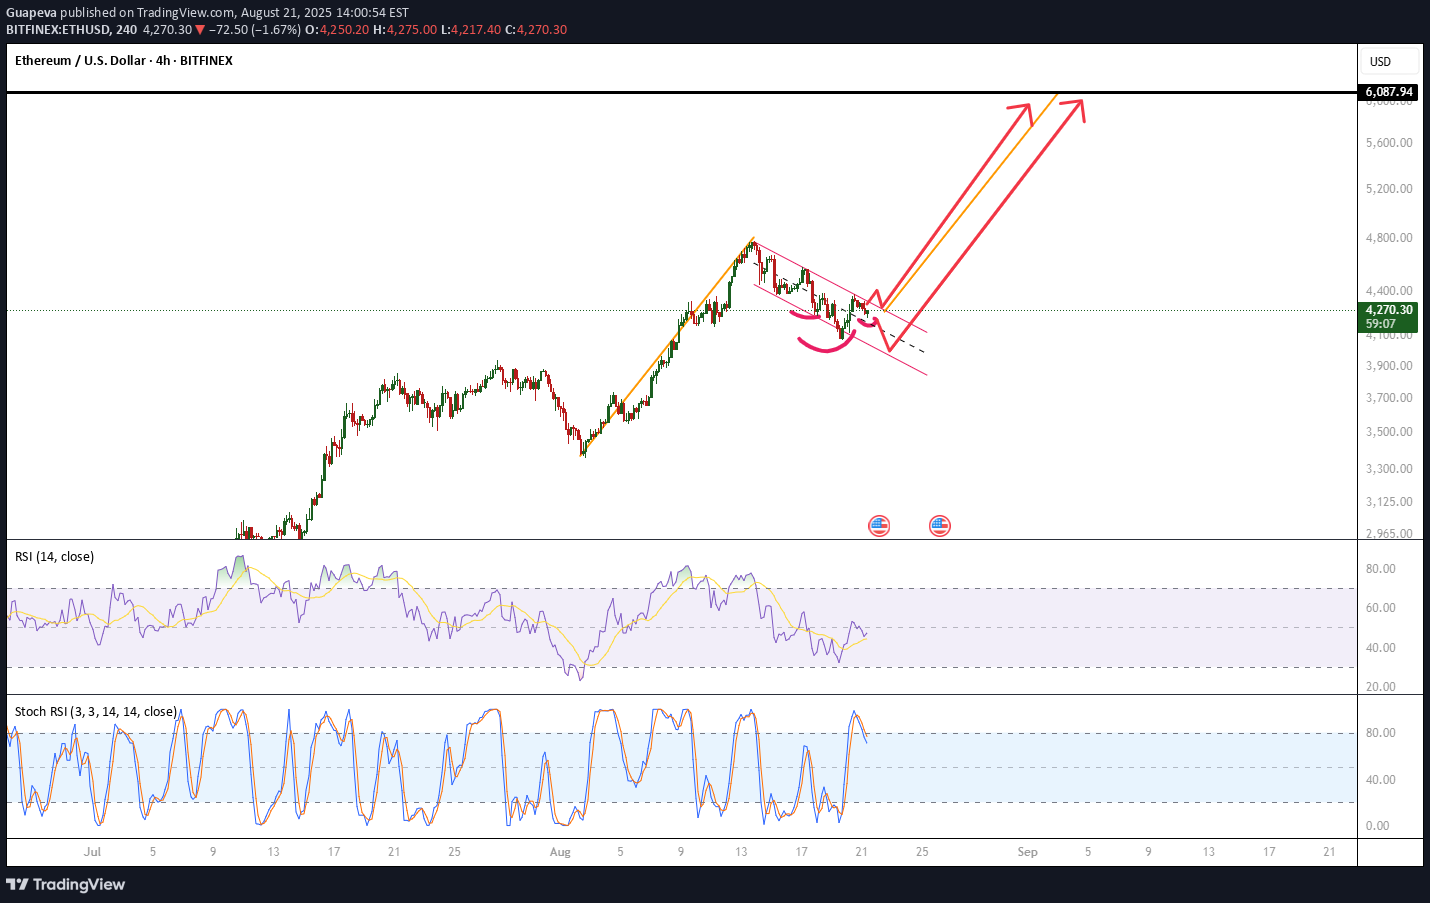
Ethereum is currently trading within a bullish flag formation, consolidating above strong support inside a parallel channel. The structure suggests a potential breakout targeting the $6,000 zone, aligning with the measured move of the flag. A short-term pullback towards $3,900 remains possible, but this level is expected to act as a key support. The inverted Head & Shoulders pattern adds further confluence to the bullish case, with a neckline breakout likely to accelerate momentum. Both RSI and Stochastic oscillators are showing early signs of bullish momentum recovery. 📈 Bias remains bullish as long as price holds above $3,800–$3,900. A confirmed breakout above $4,400–$4,500 could open the way toward the $6,000 target.
Guapeva
BNBUSD – If You Need More Clarity Than This...
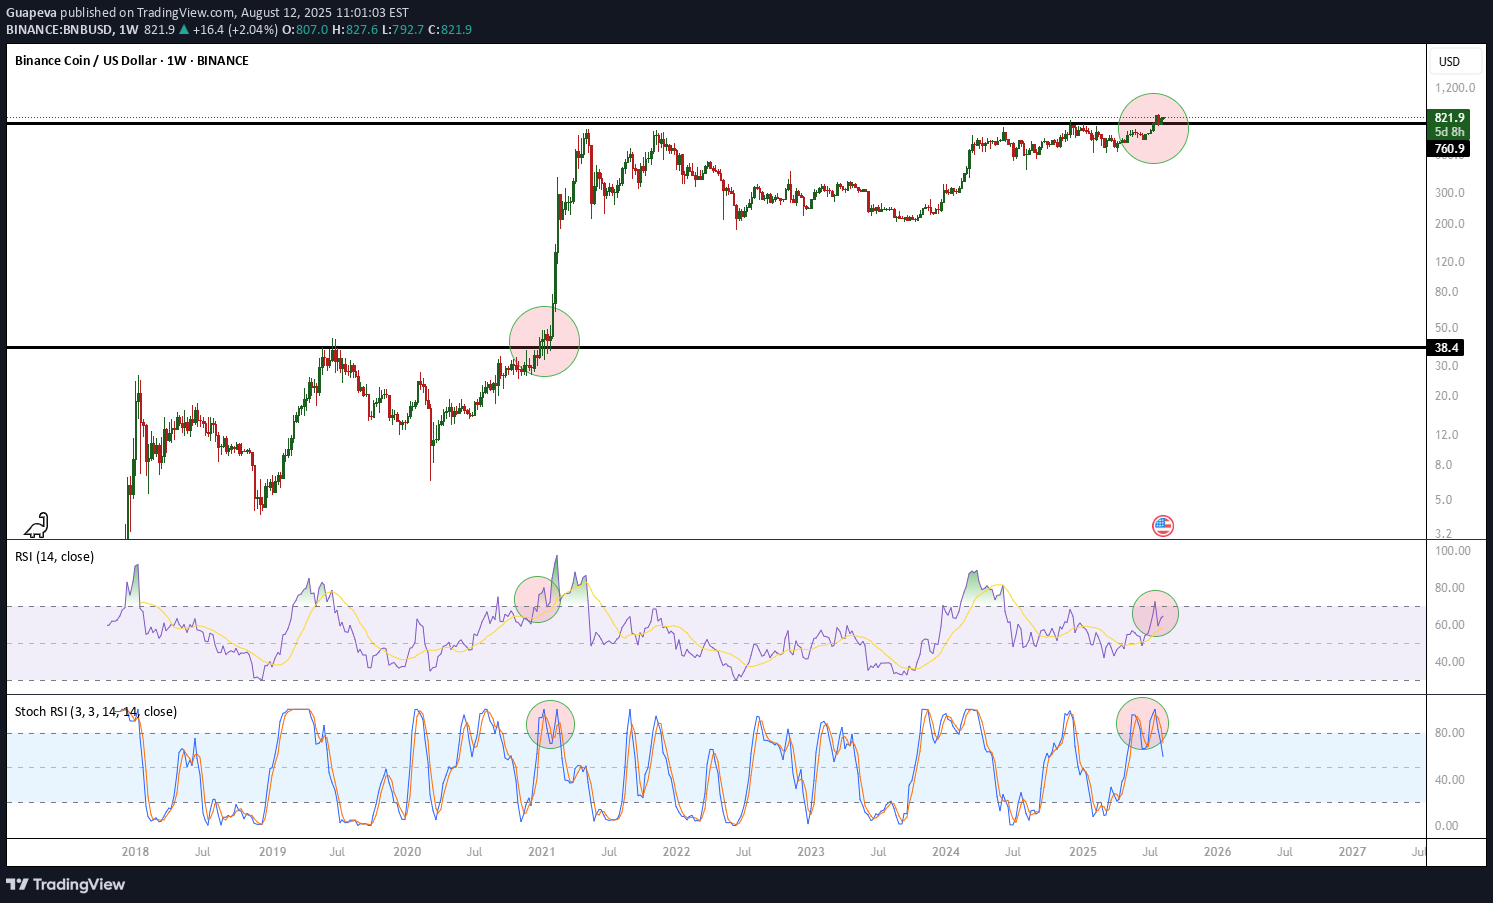
If you need more clarity than this... I do not understand your mind. Previous ATH breakout, RSI and Stoch aligned. what else is necessary for jumping in? ALTSEASONNNNN If you’re still unsure about the setup, ask yourself: what more do you need to see? This is one of those moments where the technicals and price action are in sync. Clean breakout, strong momentum, aligned oscillators – if you wait too long, the train might already be gone. Not financial advice, but the chart is doing all the talking.
Guapeva
ETHUSD Update – Key Support After Channel Break
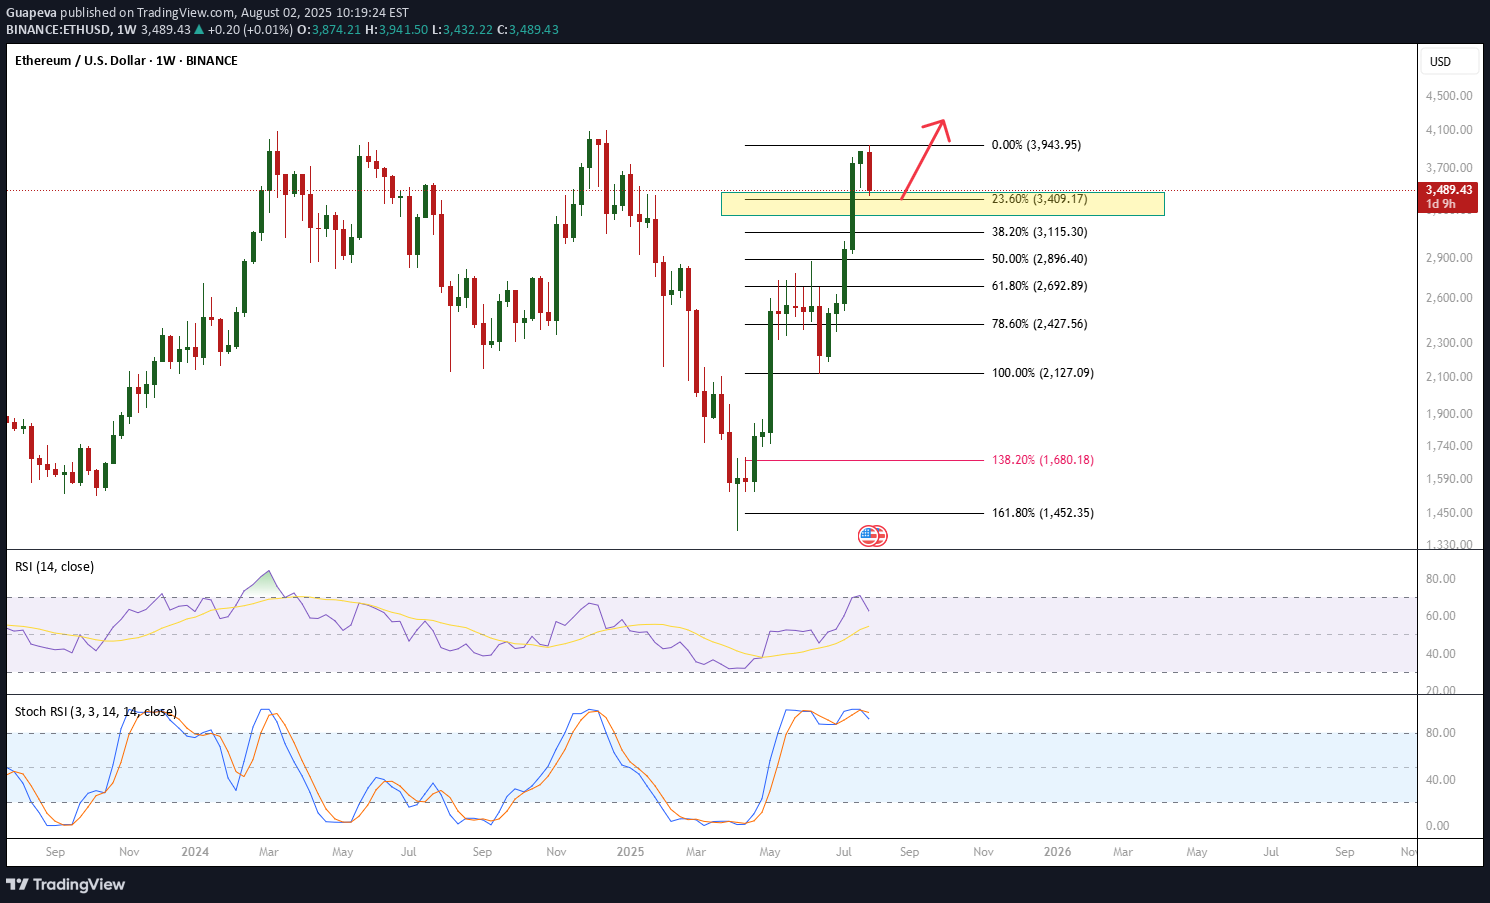
ETHUSD has recently broken the channel, but it’s now sitting at a key Fibonacci support level. At this level, we may see: A rejection to the upside with a continuation of the bullish trend, Or some accumulation phase as buyers and sellers find balance. Weekly Stochastic is overbought, signaling the possibility of some sideways consolidation or accumulation before the next move. 📌 Watch price action closely for confirmation before committing. This support zone is critical for the next directional move.
Guapeva
ETHUSD -> Parallel channel could trigger major pump
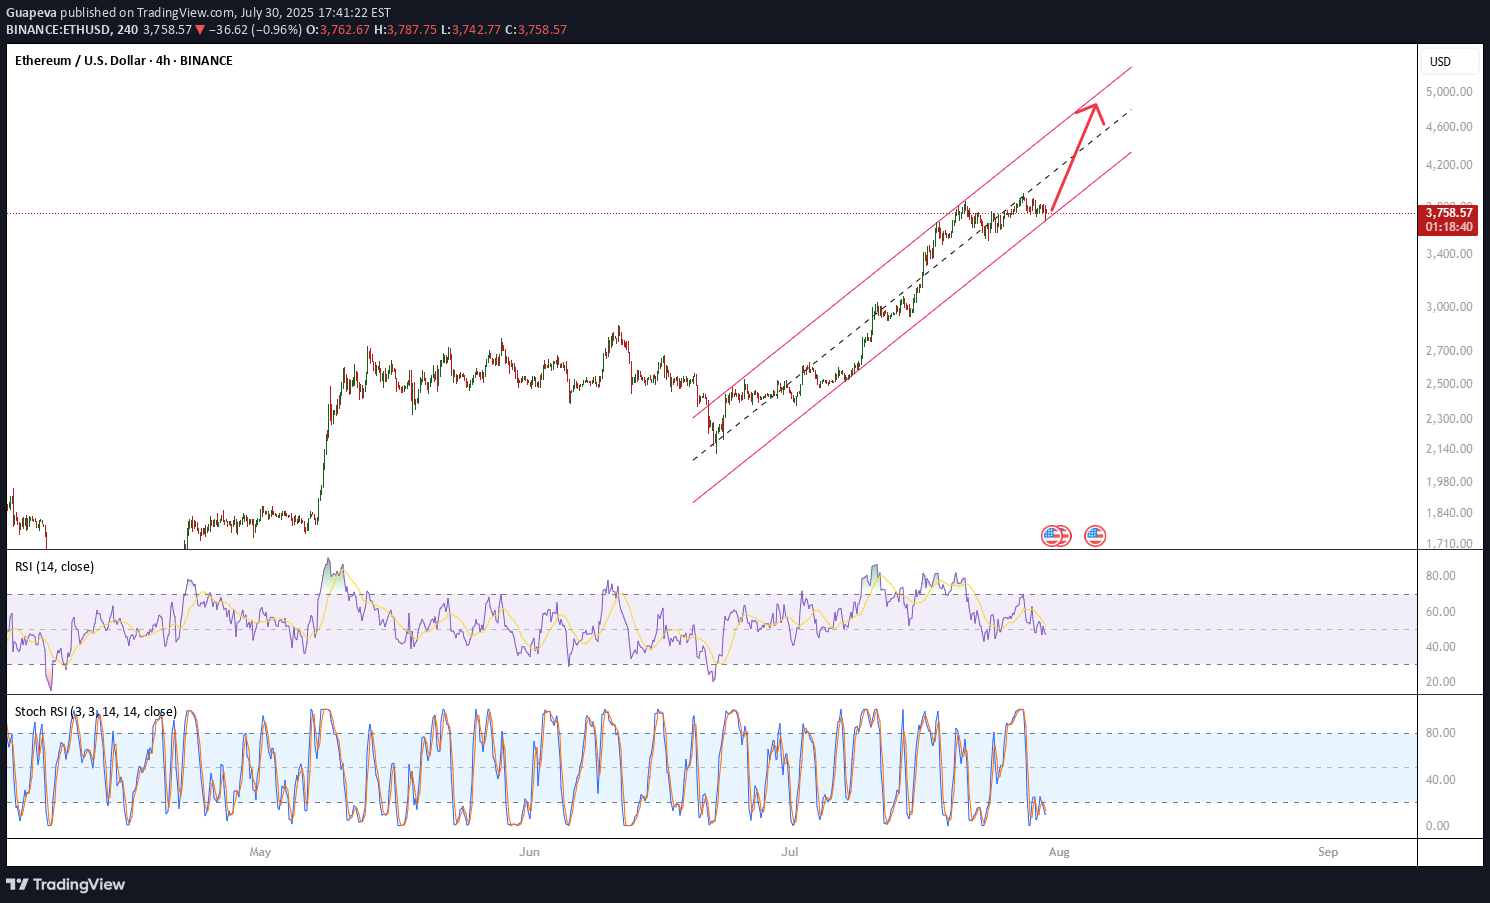
Ethereum is currently trading within a well-defined parallel channel on the 4H chart. Price is approaching the lower boundary, which has acted as reliable support in recent swings. 🔍 Indicators: RSI (4H) is in oversold territory, signaling potential upward momentum. Stochastic RSI also confirms an oversold condition, aligning with the RSI. 📈 Bias: Bullish I’m expecting a bounce from the lower channel support toward the upper boundary, following the established channel trend. Invalidation: A clear breakdown below the channel with strong volume. Target: Top of the channel. 🔔 Not financial advice. Always do your own research. #ETH #Ethereum #Crypto #TradingView #TechnicalAnalysis #RSI #Stochastic #PriceAction #ChannelTrading
Guapeva
XVGUSD -> Not asking anybody to trust me, but future is bright
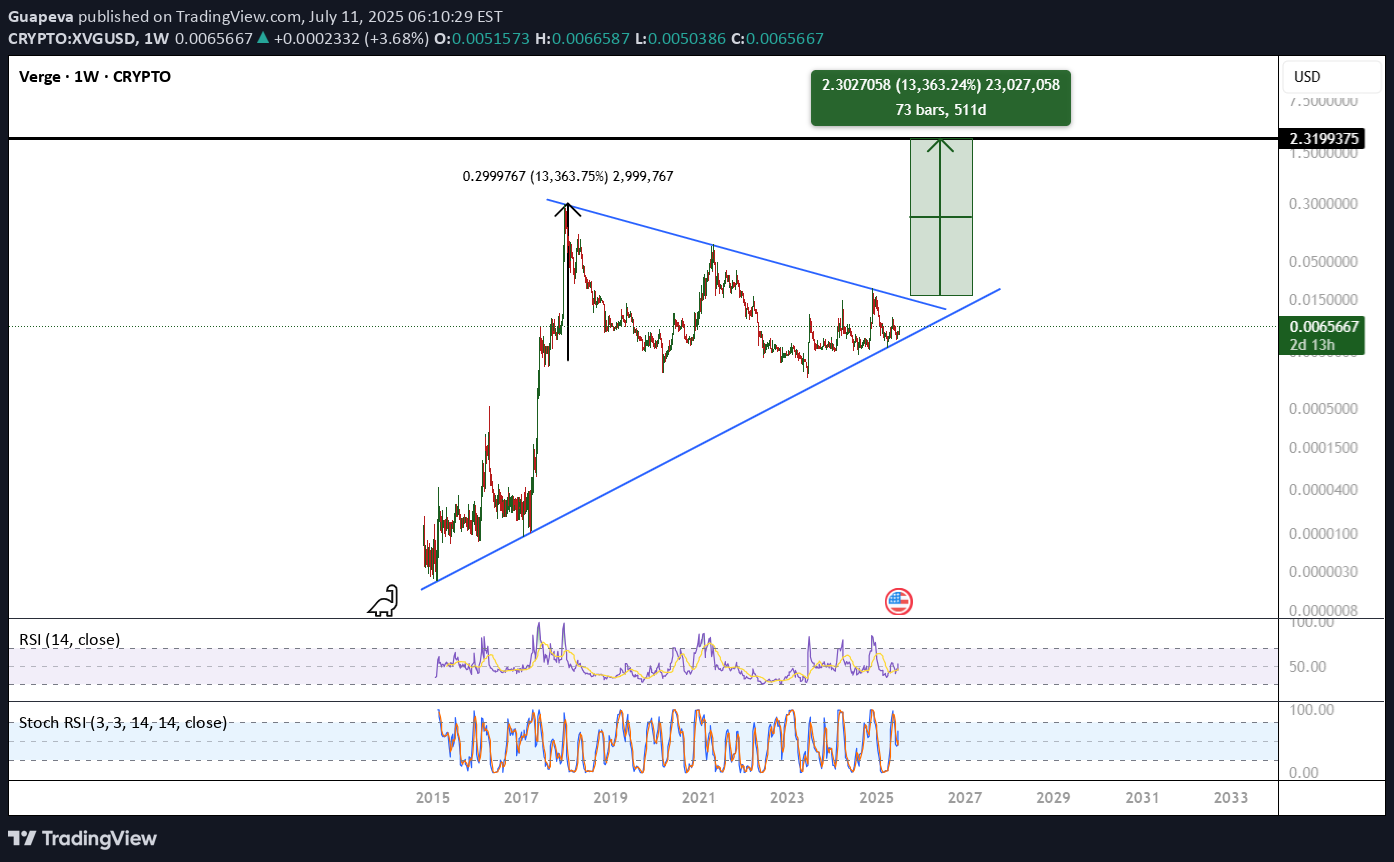
XVG is currently trading within a symmetrical triangle pattern, near its lower boundary. During the last bull run, the final leg saw a gain of 13,000%. I'm expecting at least a similar move this time—if not an even greater one. Technical indicators remain bullish so far.
Guapeva
Ethereum (ETHUSD) – Inverse Head & Shoulders Breakout Incoming?
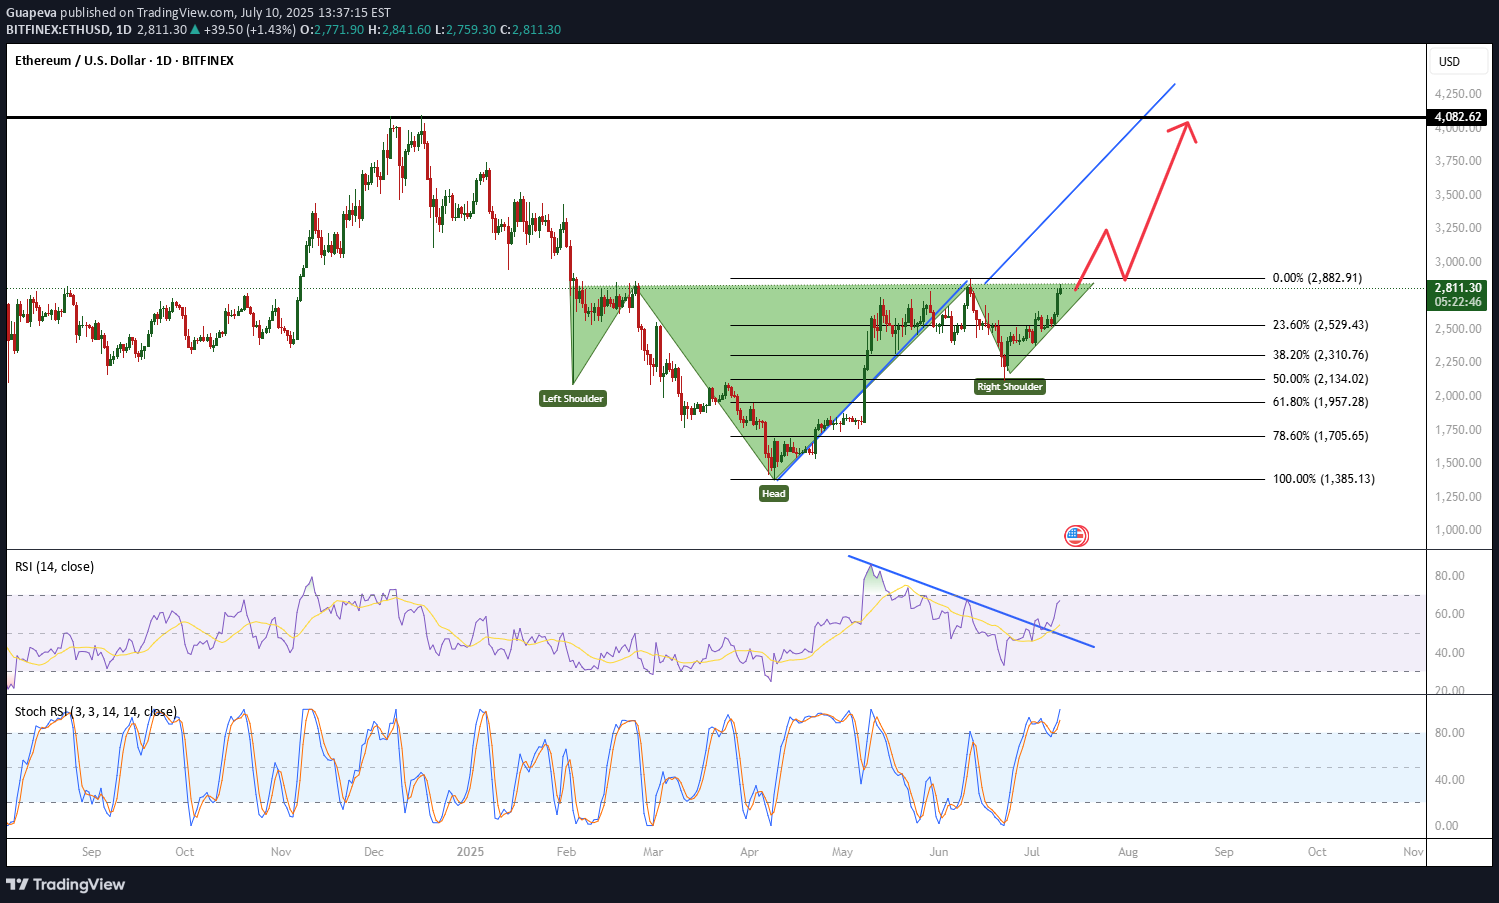
Ethereum is currently forming a textbook Inverse Head and Shoulders pattern on the chart. ✅ Left Shoulder: Formed after initial sell-off ✅ Head: Deep low, marking the bottom ✅ Right Shoulder: Higher low, indicating waning selling pressure ✅ Neckline: Being tested now 🔹 Fib Retracement: Price corrected exactly to the 50% Fibonacci level, a key support zone. 📈 Indicators: RSI trending above 50 MACD showing bullish momentum Volume increasing on up moves 💥 Breakout Target: $4,000 (based on measured move from the head to neckline) 🛑 Invalidation: Break below right shoulder structure This setup looks promising, but confirmation is key. Watching for a strong breakout and close above the neckline with volume before entering. Let me know your thoughts or setups in the comments! #Ethereum #ETHUSD #CryptoTrading #ChartPatterns #TechnicalAnalysis #InverseHeadAndShoulders #Fibonacci #BreakoutWatch
Disclaimer
Any content and materials included in Sahmeto's website and official communication channels are a compilation of personal opinions and analyses and are not binding. They do not constitute any recommendation for buying, selling, entering or exiting the stock market and cryptocurrency market. Also, all news and analyses included in the website and channels are merely republished information from official and unofficial domestic and foreign sources, and it is obvious that users of the said content are responsible for following up and ensuring the authenticity and accuracy of the materials. Therefore, while disclaiming responsibility, it is declared that the responsibility for any decision-making, action, and potential profit and loss in the capital market and cryptocurrency market lies with the trader.