
GoldsteinTheProfiletrader
@t_GoldsteinTheProfiletrader

What symbols does the trader recommend buying?
Purchase History
پیام های تریدر
Filter
GoldsteinTheProfiletrader
GRASS might finally pump!
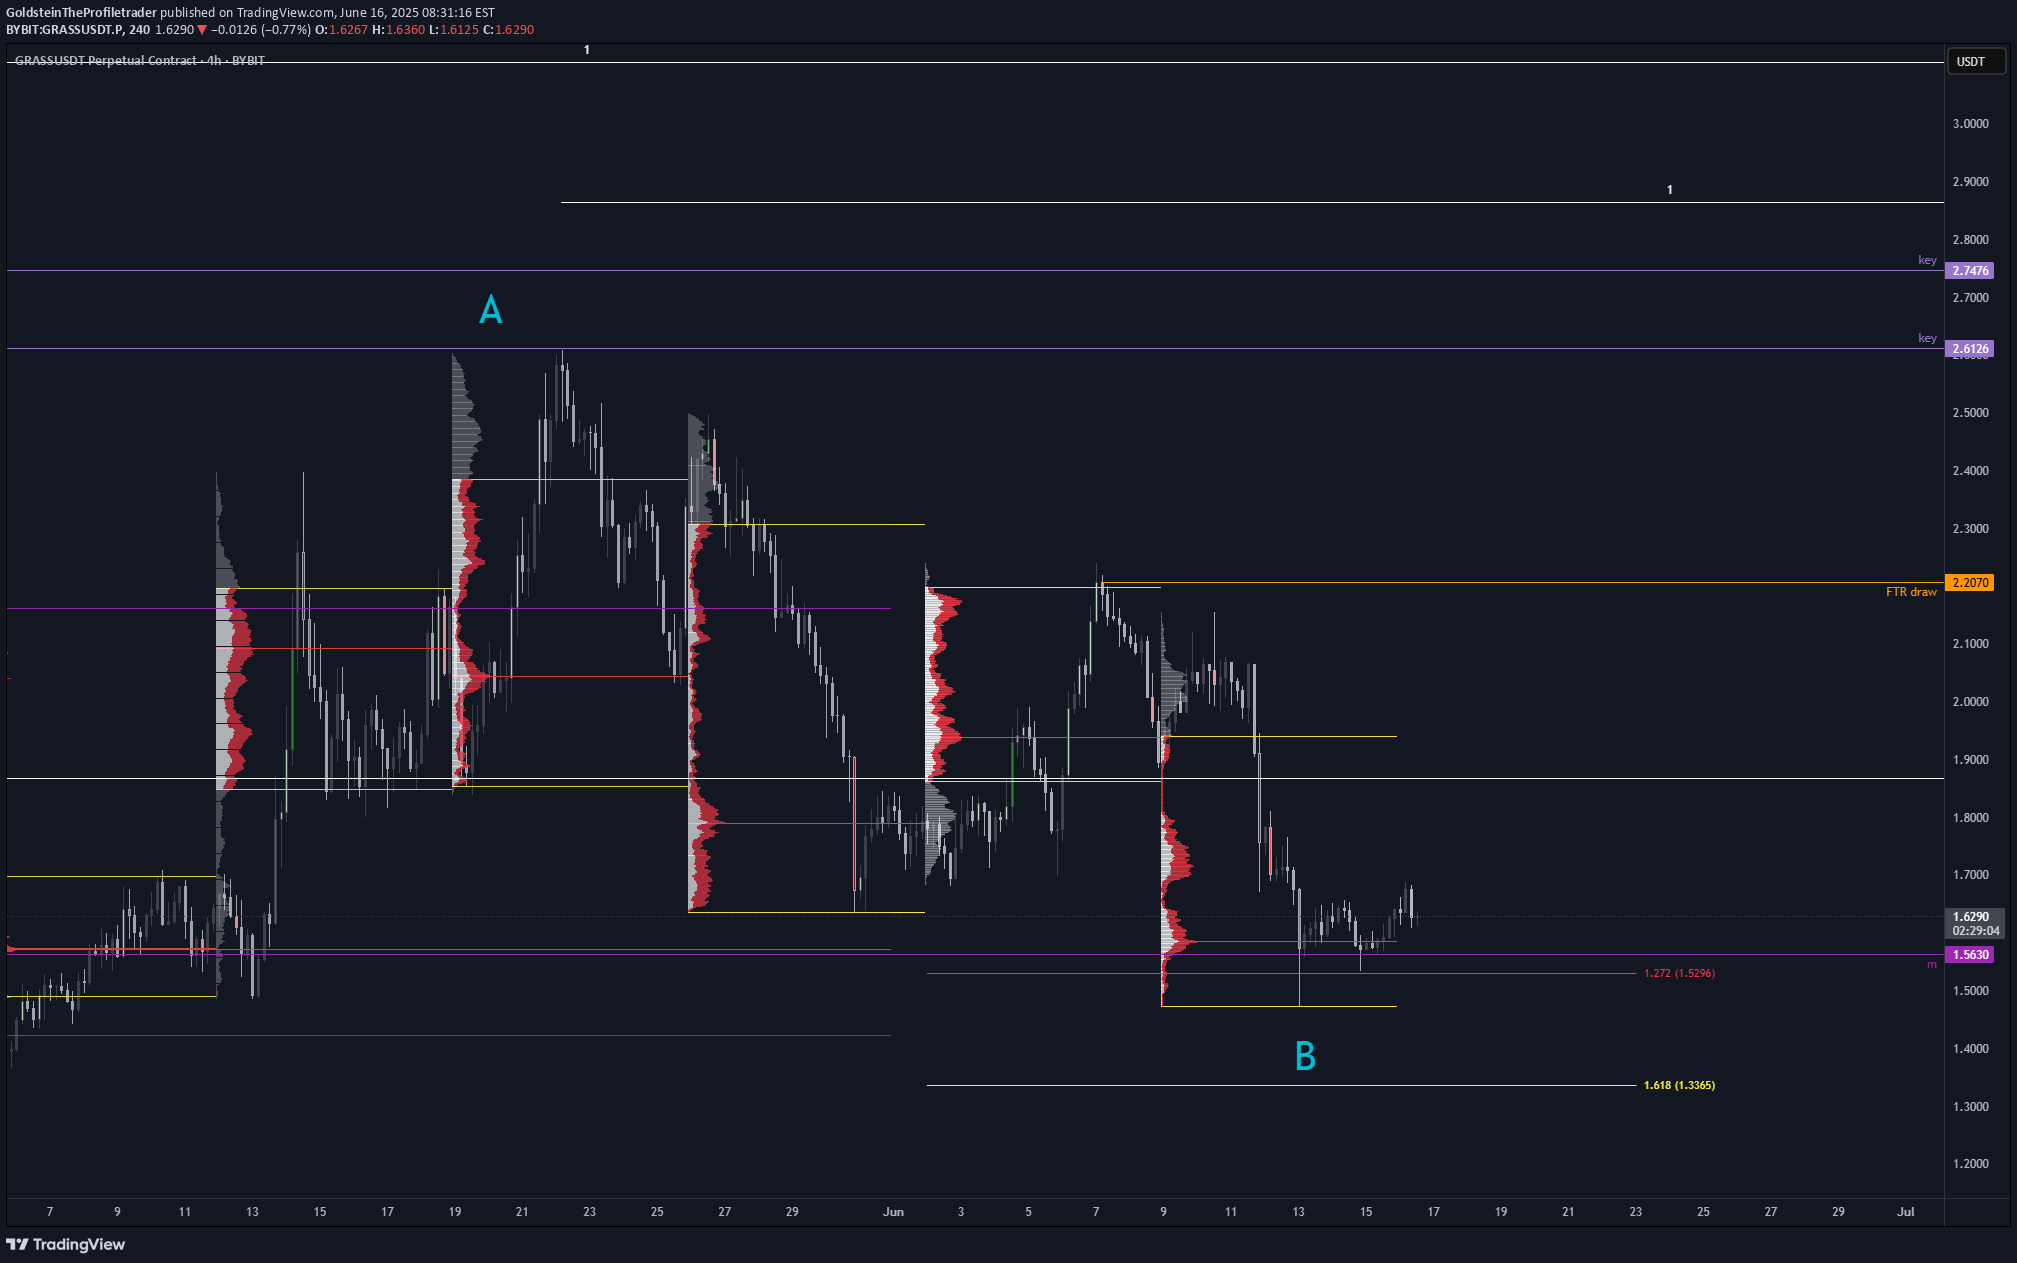
GRASS - "A retail trader´s dream": I have an eye on the chart since some days. It could have went for a lot higher prices while being at 2.10, but unfortunately it didn´t. Maybe fortunately? The profile probability up there at the pmVAH wasn´t given. What´s the story now? Price rejected the pmPOC for a potential bullish FTR. As long as this remains valid, we are targetting the origin of the move. In this case this is all the liquidty up there at the pmVAH, where price came from. So the bullish FTR with the pmPOC as your key level is your foundation for a long setup. Yesterday it wicked again into the monthly liquidity level, which is like a pmVAL. This was your long. I didn´t take it, because I was in LDO, INJ and DEGEN. I just longed it tho at 1.62 a few minutes ago because of aggressive shorts and decreasing selling volume in the 30 min timeframe. These boys are trading against the probably bullish FTR (bullish rotation). For me this was a good local pullback to take a long. Probable 4 hr higher low here aswell, good. The pwVAH is the main target number 1 at 1.9390. Target 2 is the pmVAH at 2.1610, being the origin of the move and providing liquidity for the grab. Sometimes I like to have a look at sequences to have a higher timeframe direction and more importantly get a better understanding for the higher timeframe structure / foundation. Is it weak or strong? This one is strong as hell. IF the price can break the high blue "A" after the bullish FTR, it would activate a bullish sequence. Let´s say that sequences increase the chances for an expansion based on the price structure. The special thing is that the blue "A" is so close to the yellow "A" which would activate another bullish sequences. Two sequences like this mean that price will likely just expand super high and fast without stopping at the high or 100 extension. So we are having a high probabilty to run for the ATH, once the blue "A" gets broken. Then it would also activate the biggest bullish sequence, revealing likely ATH targets of 4.30$ and higher. It is a very good long term outlook. There was a bearish sequence that was bringing the price below the big 100 extension, but with the current foundation it is more likely to run for the highs than to keep expanding lower. I want to stress that I won´t hold my long until 4.30 or higher. I am trading profiles. The sequences only provide a possible long-term outlook, but you rarely see such a good "ladder" of sequences, at least once the blue "A" get´s broken (the high). So I am planning to TP at the pwVAH (most of it), then a small runner for the pmVAH and a smaller runner for 4.30 (new expanded ATH). If the price would lose the pmPOC and the monthly level and starts to find acceptance below, then I would need to think about cutting the long. Price would likely rotate to the pmVAL to finish the bearish rotation. For now, after rejecting the pmPOC and being above the monthly and fresh pwPOC, looking for longs is a damn good idea. No trade or a long. We are also having local aggressive sellers on decreasing volume. Such a bad spot to hard sell, if the bullish FTR is your likely scenario. Cherry on the cake at GRASS. Last week price was dropping also into the 1.272 expansion from the previous week. There are most of the stops. Such a nice confluence with the pmPOC and monthly liquidity area. So if most of the stops got taken and retail got punished, is an expansion to the downside probable? I am buying.
GoldsteinTheProfiletrader
LDO is bullish

Here is the LDO picture and I want to explain why it is offering buying opportunities right now: The price had a big move to the downside and broke out of the bracket on lower volume than it can be found within the bracket. So being below the bracket is not the time to sell. We can also see that aggressive short-term sellers were in control to liquidate the longs. A lot of longs could have been found on the previous move to the upside, that lead the price into the pmProfile. So the 4 hr low on the left, that got taken out on this move to the downside, was the origin of the previous bullish move. This was the FTR draw (liquidity grab). Aggressive short-term sellers always compete against long-term buyers. The LTB will always win. It is just a matter of time and to find a good spot, when the market will be depleted of selling potential. It won´t be able to go any lower and the shorts will get squeezed afterwards. If we look at the 4 hr price structure, I don´t think that´s a lower high downtrend structure. It is really a bracket with some proper downside deviations. Once the market is depleted of selling potential, we can expect a full move to the high of the bracket and eventual a proper deviation of the bracket. So a full rotation of the pmProfile is very likely imo. In the local picture we can see low volume bracketing but then many aggressive sellers came in once more even after the strong downtrend. So far they were not even able to take out the low which could be a sign that the market can not go any lower right now on LDO. So really: 1) below the bracket 2) below the monthly (support) liquidity 3) below the pwProfile 4) at the lower end of the developing pwProfile which is b-shaped (short-term sellers against long-term buyers, LTB will always win in the end 5) below the pmProfile 6) local shorts can not even take out the low. Give this baby some time and then ride it.
GoldsteinTheProfiletrader
GRASS will DOUBLE in price within the next weeks.
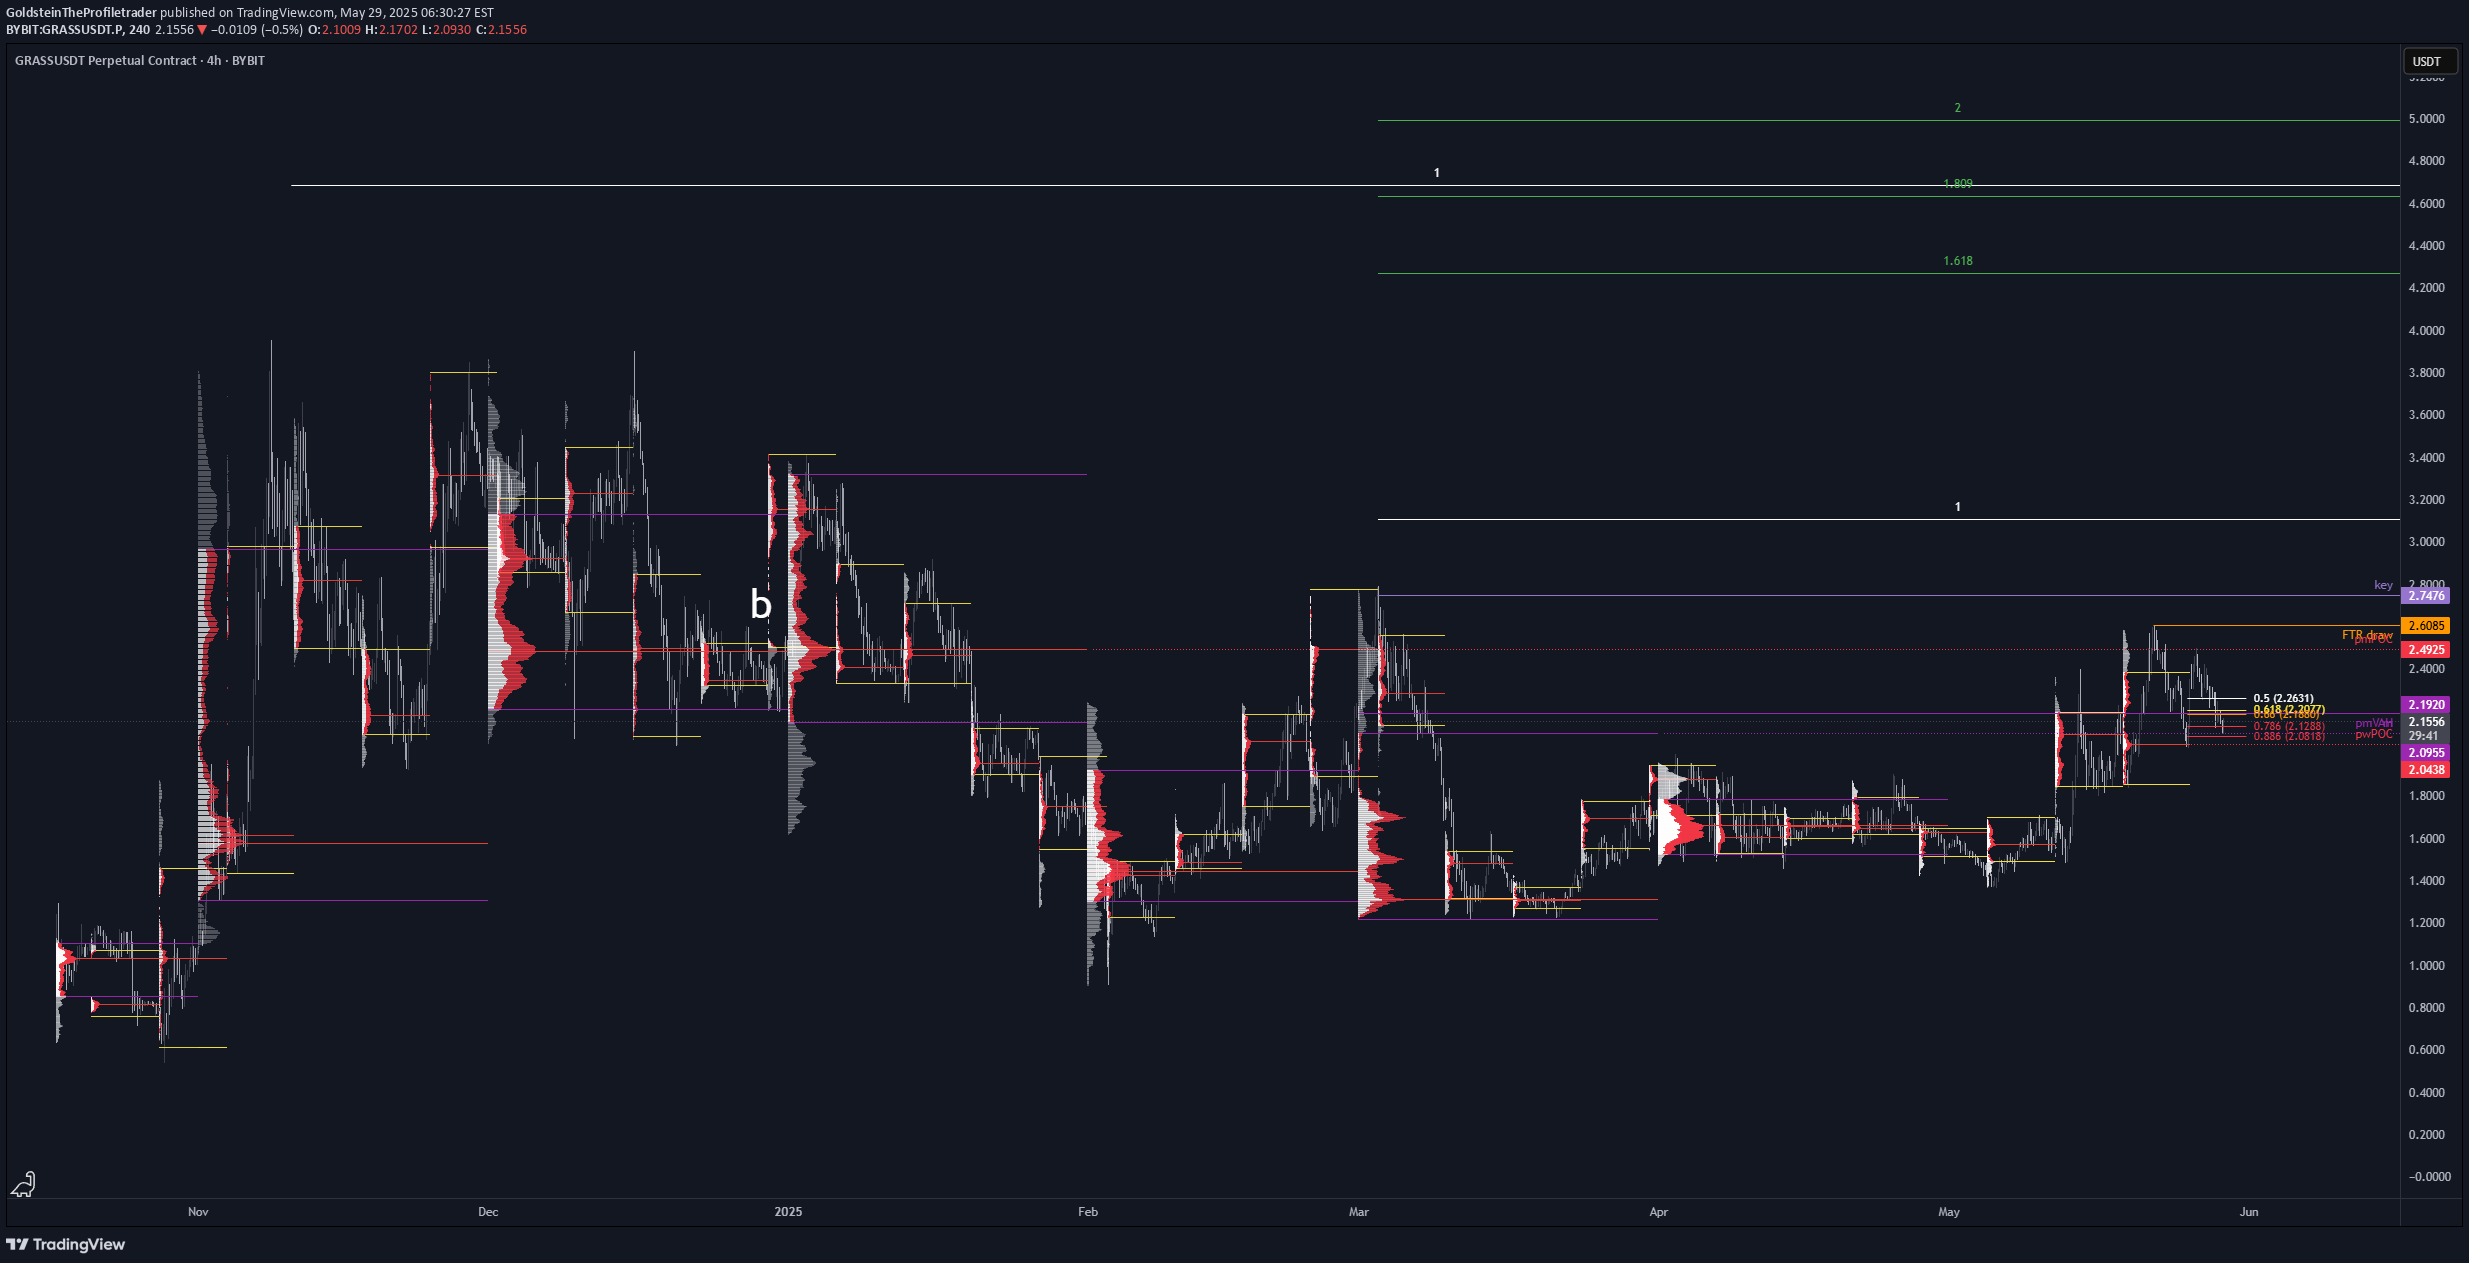
Grass has built a strong foundation during the past months. Price is very corrective and contracting every since. Locally it looked like a rejection off the upper pmPOC (previous month point of control) which is bearish. Well yes, it rejected but just short term. Market structure remains bullish. The price is building value above the pmProfile (previous month profile). Locally it is just leaving liquidity behind. In my opinion GRASS is really setting up for a meaningful really and 2.15 ish will be one of the very last buying opportuinites. 4.67 is my main target and once it breaks the upper key level, it will just keep going. The current FTR draw target (failure to rotate - because it can not bearishly rotate the pmProfile below) is slightly below the key level. The stars align pretty well. Honestly, this is one of the best charts I have seen lately.
GoldsteinTheProfiletrader
JTO will pump 20%

JTO is building value above the pmProfile. That´s bullish and not bearish, because people are accepting the price above the profile. This "building value" tells us that the price is preparing for another leg to the upside -> We have to find out main targets above the current range. There are some untapped levels like the pwPOC and pwVAH above 2.300. They are in confluence with the bullish sequence target zone. That´s why I am planning to sell off at the upper pwPOC. What´s the invalidation? When do we need to exit the trade? Only if JTO starts to build a lot of value below the pmVAH and even pmPOC. That´s something we would need to observe during many 4 hr candles. It isn´t likely to happen. Especially because we can see long-liquidations (b-pattern) based on the pwProfile. The market is too short to substantially go lower. This information combined with the value that is building above the pmProfile, will lead to higher prices. We have bought JTO multiple times in the past days and sold off at pwVAHs. It made sense because price likes to came back to the good entry zone multiple times, for example because market makers are forcing long liquidations first. (b-pattern).
GoldsteinTheProfiletrader
TAO is ready for another leg up

I just bought TAO with the average entry price of 441. It still looks very bullish to me and should see some continuation. Those untested pwVAHs above will be next. 619 (pmVAH) is the main target. Compared to last week, it is clearly building value higher. Even above the monthly liquidity level, so this dip below is likely just a trap. Also no acceptance into the pwProfile below which will cause this bullish FTR. All signs on green honestly. It only becomes bearish if price would somehow find acceptance in the lower pwProfile and builds a lot of value there. This scenario isn´t the likely one tho.
GoldsteinTheProfiletrader
Fartcoin update for previous bearish idea
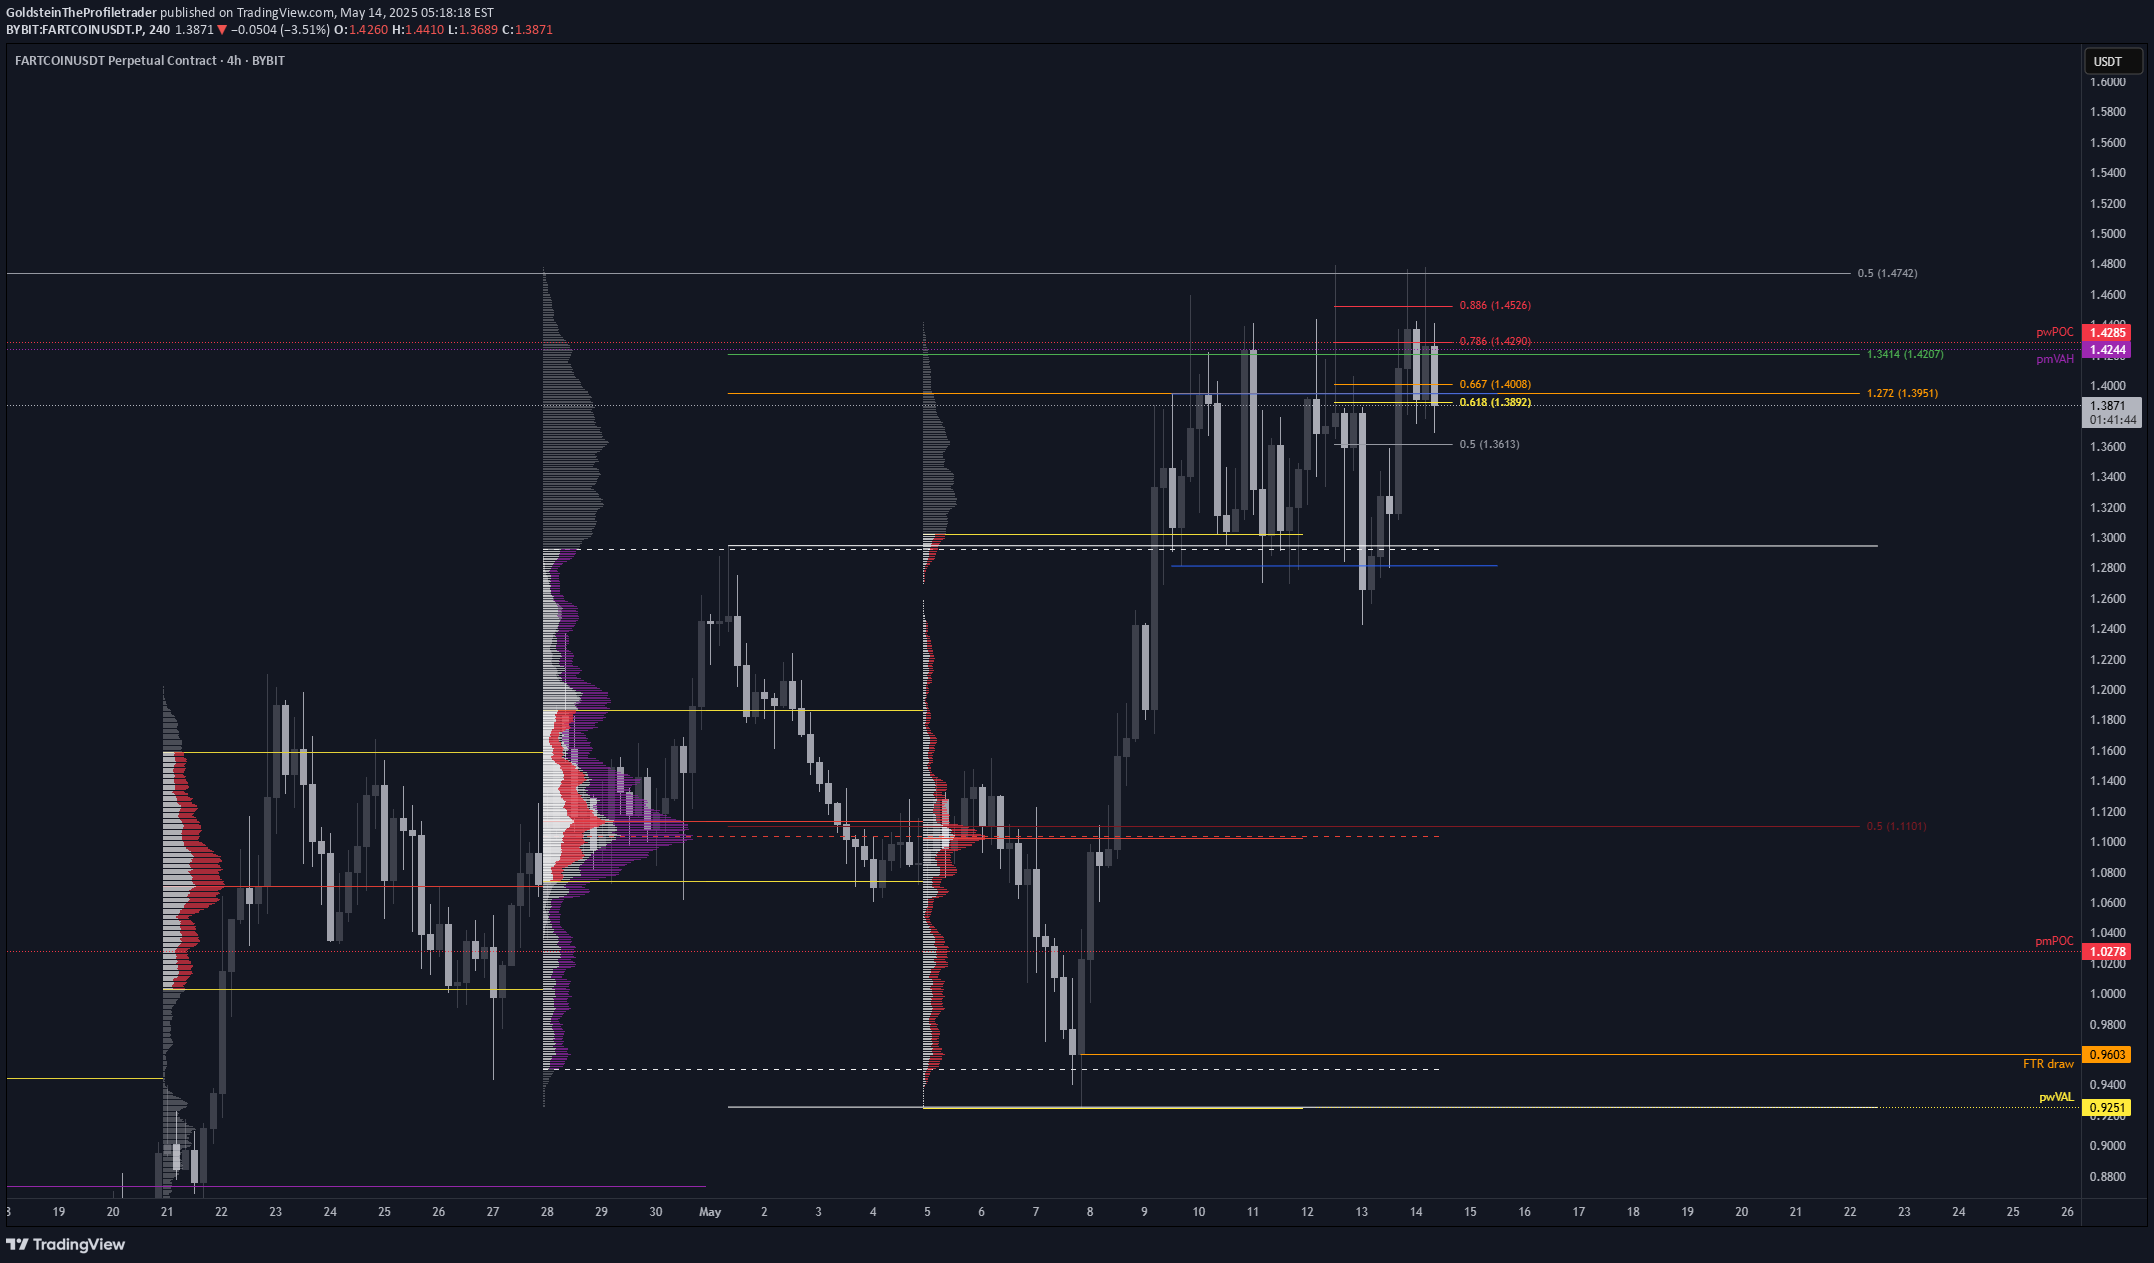
Quick update for you: Fartcoin took out the initial high at 1.46 several times but we are only seeing swing failures. We do not see the price closing several candles above the pmVAH and pwPOC for an attempt to build value, to then swing up for higher prices. As long as we spend the majority of time below these levels, I am still looking towards the pwPOC below, maybe even 0.96 ish to fully take all the liquidity. The price is ranging here (blue). If it breaks down, we will keep observing the potentially big range (white) for future price movements. So nothing has really changed here. We know what to look out for.
GoldsteinTheProfiletrader
Fartcoin should retrace, which would be healthy
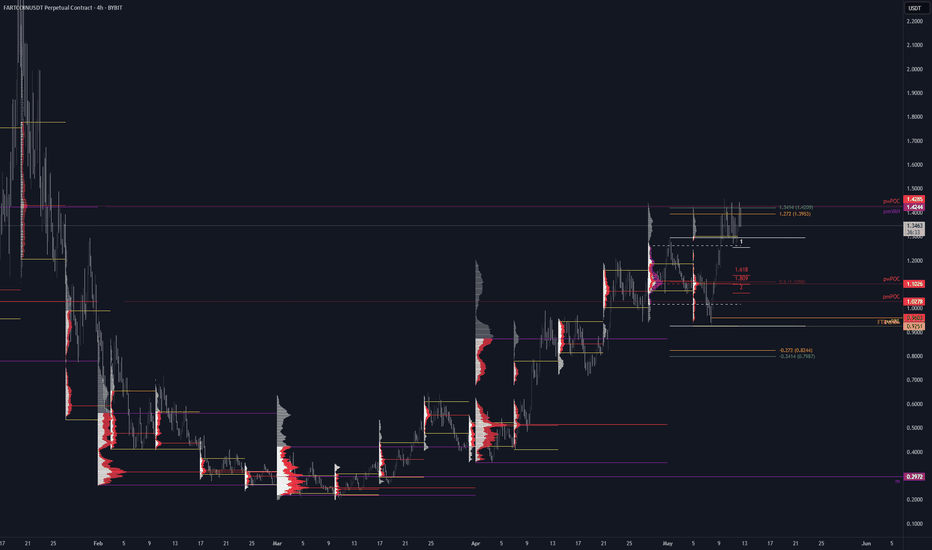
I am in a short on Fartcoin. Price is above the fresh pwPOC -> highest risk for new longs, biggest opportunity for shorts. Also the last pwProfiles are overlapping which is a sign of a potentially aged trend. The bearish sequence is not active yet, but the foundation that is currently forming would be an amazing confluence for the trade. Also, price did not find acceptance above the pmVAH yet (so far) and this is also a rejection off the pwPOC for a potential FTR, which would lead to lower prices aswell. So this is really no trade or a short. If the current high gets broken, it would destroy a potentially bearish foundation for the sequence and potential for further downside. Then price could start to find acceptance above for bullish continuation. So the current high is the invalidation for this idea. If price would manage to bust through the pwPOC, then we have targets below but it becomes more tricky there. The fresh pwPOC would be the easiest TP and I would take most profits there. Also: Since the beginning of last week value mostly built lower. Yes, we had aggressive shorts down there but they got squeezed. If this would be a lot more bullish, then value needs to shift to the current upper place. It didn´t so far, which could be an additional confluence.
GoldsteinTheProfiletrader
last chance for the ADA bulls

I have been very bullish on ADA in the previous idea. We bought at 0.61 ish for good reasons and dragged it all the way up to the pmPOC at 0.73. It was a major TP level for good reasons. Price did not show any acceptance above, which is bearish. This could result in a complete FTR (failure to rotate). In this case, we will target the origin of the move. All the way back down to where we came from (check the FTR draw target below in orange). On Saturday we had a strong volume backed breakout to the upside of the bracket. Normally price could have went for a lot higher prices. It didn´t even tap the pmPOC tho, fell back into the bracket (acceptance), so that was extreme weakness, bringing the price back to the low of the bracket quite fast. If bulls won´t reclaim the bracket, then the pmPOC below will be next. Potentially this will last a lot longer until the FTR draw will be hit. If bulls will reclaim the bracket, then we will simply see the top of it. Then we would need to assess if price is doing a good job to go higher or not. So for now: short, with potentially a lot lower target., pmPOC (previous month point of control) below will be the next target. Bullish only if: .. the bracket will be reclaimed.
GoldsteinTheProfiletrader
EOS will go for a liquidity hunt!

EOS is leaving a huge liquidity trail behind. Just look at the 4 hr higher low wicks. All these wicks are just representing stop losses. The pwProfile (previous week profile) is showing us short-covering. Aggressive short-term buyers are competing against long-term sellers who will target all the lower liquidity at some point. I took a small short already here above the pwVAH (previous week value area high). I might add at the FTR draw (if it will get hit) and I am even open minded for a surprising run to the upper pwVAH. Hard to tell if it will break down from here or if it will go higher first to generate some more liquidty. Overall I am prepared for downside and I want to see the lower pmPOC (previous month point of control). This level is my main target.
GoldsteinTheProfiletrader
The long liquidations depleted the market of selling potential

JTO looked terrible for a looong time. Now the market is way too short on it, which is visible in all the b-shaped profiles. That means we had very aggressive sellers that forced the price to the downside to liquidate the longs. Once that is completed, it leaves the market without underlying selling potential. So the aggressive sellers will become the victim, as they are acting against the long-term buyers which are currently accumulating. As the pmProfiles (previous month profiles) give us our main targets, the upper b-shaped pmProfile needs to get re-inspected. The pmPOC becomes target number 1. "Long liquidation depletes the market of selling potential, which will often set the stage for a meaningful rally that carries price substantially beyond the levels that triggered the liquidation in the first place." That´s why I think bulls have a very good chance to even run for the pmVAH above 2.5$. I bought some JTO here, might buy a bit lower if the price goes a bit lower once again. Looking for the pmPOC as TP1 and pmVAH as TP2.
Disclaimer
Any content and materials included in Sahmeto's website and official communication channels are a compilation of personal opinions and analyses and are not binding. They do not constitute any recommendation for buying, selling, entering or exiting the stock market and cryptocurrency market. Also, all news and analyses included in the website and channels are merely republished information from official and unofficial domestic and foreign sources, and it is obvious that users of the said content are responsible for following up and ensuring the authenticity and accuracy of the materials. Therefore, while disclaiming responsibility, it is declared that the responsibility for any decision-making, action, and potential profit and loss in the capital market and cryptocurrency market lies with the trader.