
GoldenBigAge
@t_GoldenBigAge

What symbols does the trader recommend buying?
Purchase History
پیام های تریدر
Filter
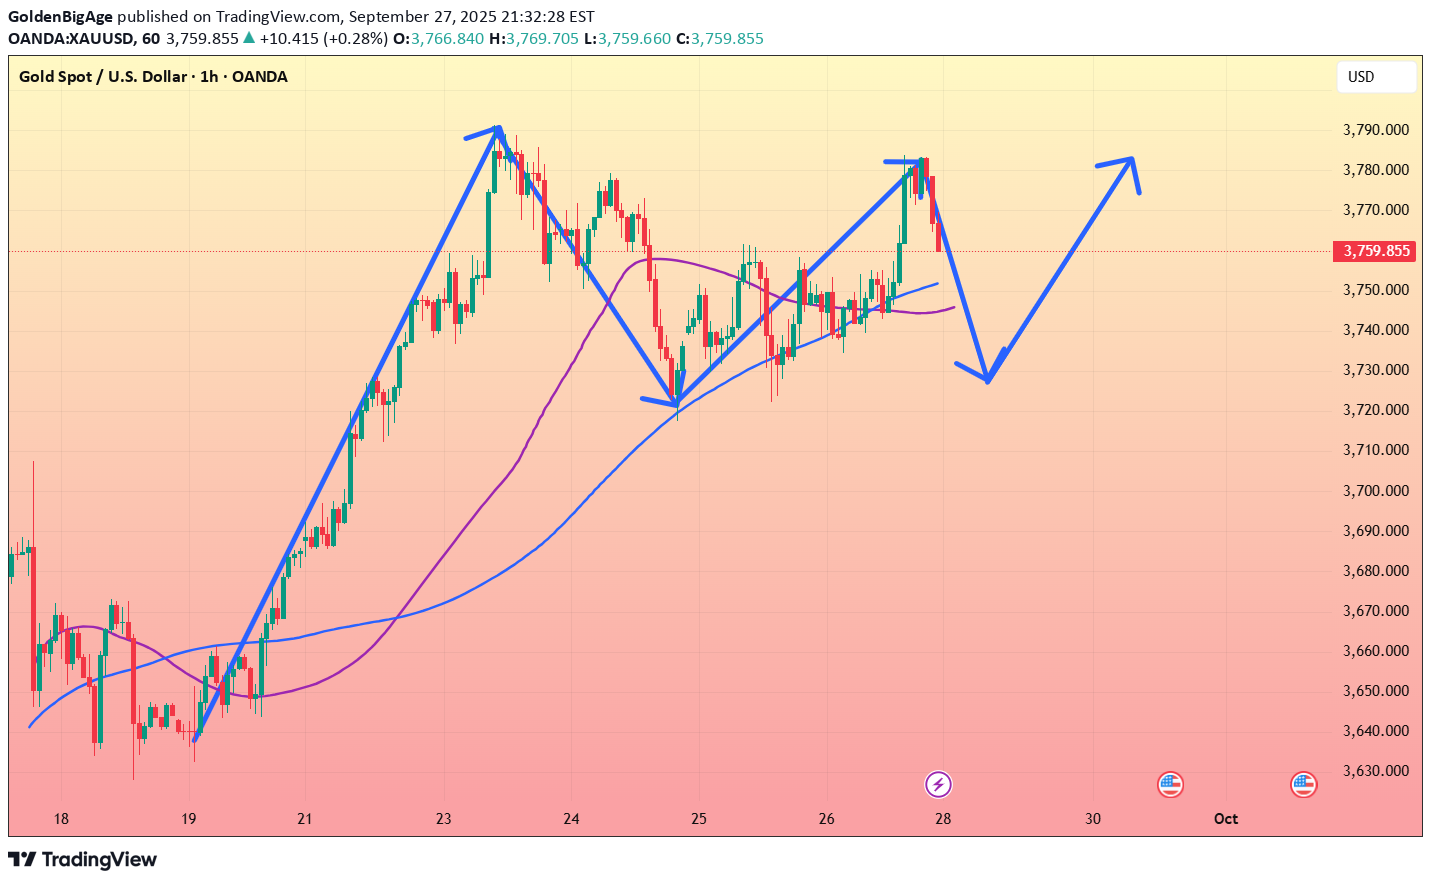
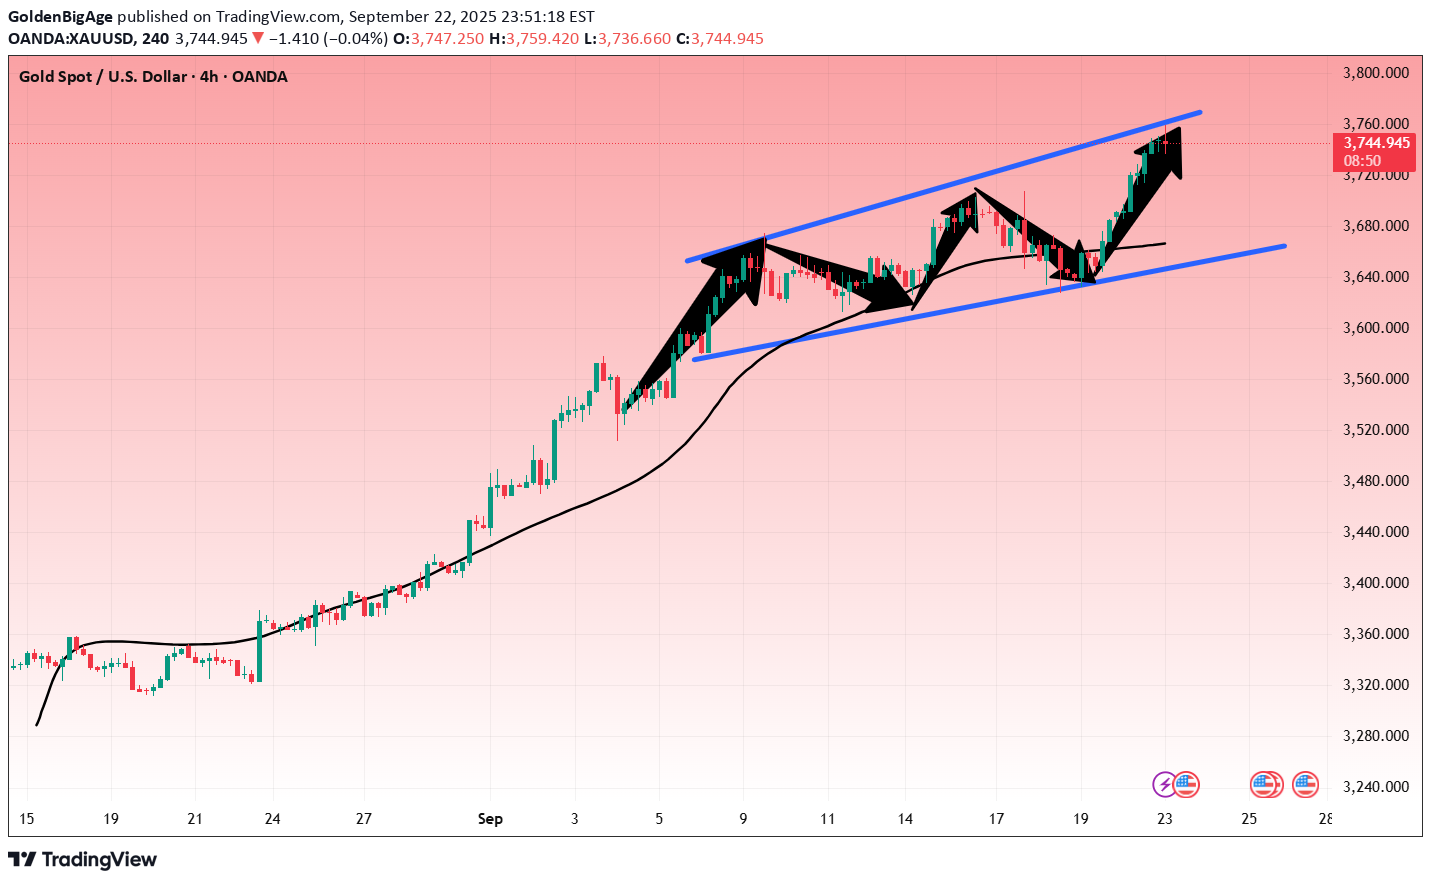
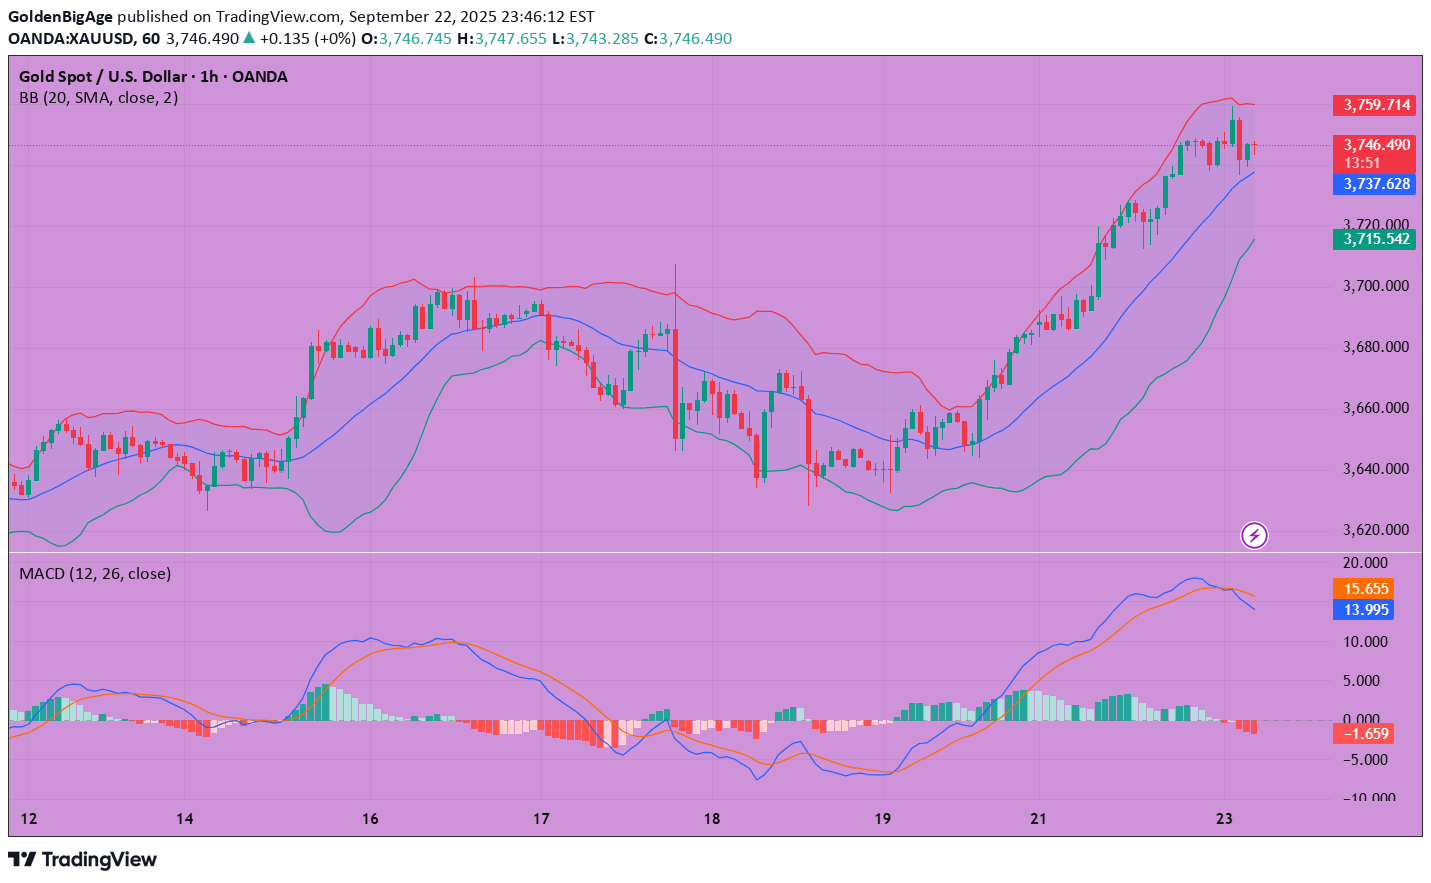
Market News: The US dollar rose for the second consecutive week this week, but spot gold prices continued to surge, reaching a new all-time high. London gold prices have now risen for the sixth consecutive week. Market expectations of two more rate cuts this year have led to rising stocks, a weakening US dollar, and generally stable Treasury yields. Friday's US PCE data remained largely stable, with personal spending growth exceeding expectations. Spot gold surged, briefly approaching a record high, but retreated in late trading, ultimately closing up 0.28%. Next week marks a "super week" for investors, with both major and minor non-farm payroll reports focused on key speeches by Federal Reserve officials. Meanwhile, several US economic data releases, including Friday's non-farm payroll data, will be released. These data will cross-validate the Fed chairs' views and provide guidance for the Fed's interest rate meeting at the end of October. Next Week's Analysis: Gold prices rose strongly on Friday, with buying at 3755 in the US session. Gold also rose to 3784, but retreated in the latter part of the night, failing to break new highs. Can gold buying continue to reach new highs, continuing the frenzy, or is this just a blip? Next week will be crucial. If the one-hour gold price fails to continue its upward trend, it could form a double top pattern. Next week will feature a series of important data releases, and gold will likely remain volatile at the start of the week. Without any significant news at the start of the week, watch for resistance at 3790 and a potential pullback. Focus on support at 3720. If the rebound is weak on Monday, sell at a high price. Trading Strategy: Short-term gold buy at 3740-3743, stop loss at 3732, target at 3780-3800; Short-term gold sell at 3785-3788, stop loss at 3797, target at 3740-3720; Key Points: First Support Level: 3743, Second Support Level: 3720, Third Support Level: 3700 First Resistance Level: 3780, Second Resistance Level: 3792, Third Resistance Level: 3800
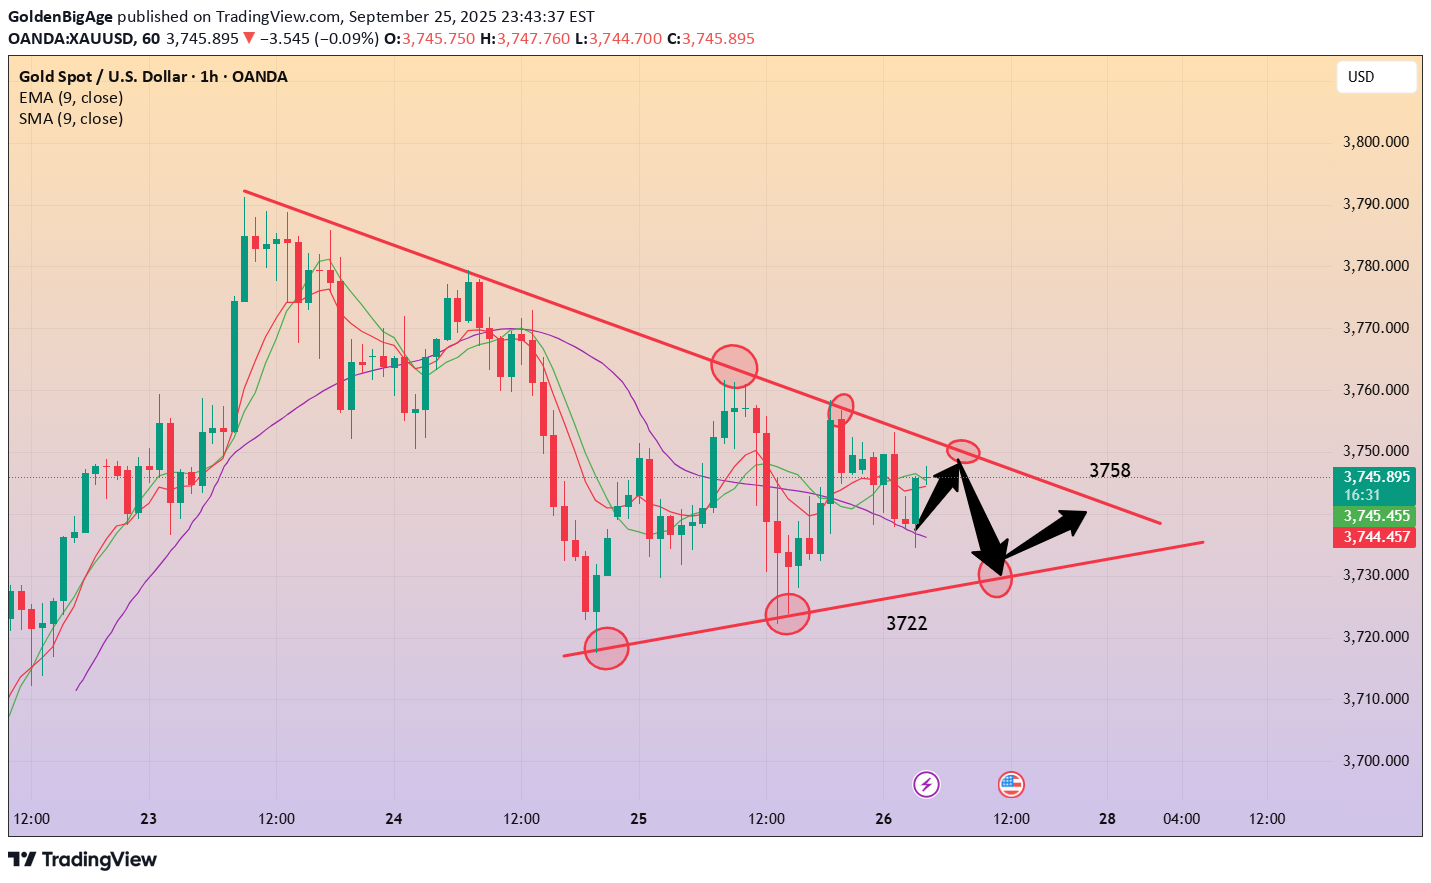
Gold Market Analysis: Yesterday, gold saw both buying and selling, and the market began a period of volatile correction, fluctuating up and down. This is a sign that markets can never rise continuously. When prices tire of rising, they need a break and a pause to recover. This is a normal technical correction after a significant surge. Today's strategy is for short-term volatility, with the broader trend bullish. The range of this correction is a bit unclear, so we can target the upper and lower highs of the 1-hour chart. The daily and weekly charts are closing today. Barring any major surprises, the weekly chart will close with a positive candlestick pattern. Next week, gold will continue to rise, and buying will continue to push prices higher. 3791 isn't the high point of this wave; a break above 3800 is just around the corner. The hourly chart shows gold forming a triangle consolidation pattern. Today, we'll focus on a breakout of this correction. The hourly correction range is 3722-3762. Until this range is broken, we'll maintain a short-term volatile trend. If it does, we can follow the trend. Once the volatility ends, there will undoubtedly be a significant move, whether it's a decline or a breakout. If the Asian session rebounds first, we'll consider selling near 3753. Support at 3732 and 3722, strong support at 3717, resistance at 3753 and 3758, strong resistance at 3762, and the dividing line between strength and weakness at 3753. Fundamental Analysis: This week's fundamentals have limited impact on the market. The US dollar has also begun to fluctuate. The market awaits new data to drive it. The Federal Reserve's interest rate cuts in October remain a key focus. Trading Recommendations: Gold - Sell near 3753, target 3740-3722
Market News: Spot gold fluctuated narrowly in early Asian trading on Friday (September 26), currently trading around $3,750/oz. Following the unexpected decline in US initial jobless claims last week, investors awaited key inflation data that could influence the Federal Reserve's next interest rate move. Following the release of the initial claims data, gold prices plummeted to $3,722/oz. The market logic is clear: the better the economic performance, the more confident the Fed will be in slowing or even pausing its rate cuts, and the higher the opportunity cost of holding non-interest-bearing gold. Currently, all market participants are focused on the upcoming release of the US Core PCE Price Index for August. This is the Fed's preferred inflation indicator, and its performance will directly provide the most critical basis for the Fed's next move. Investors will also need to monitor speeches by other Fed officials and news related to geopolitical developments. Technical Analysis: The US dollar index rose sharply, reaching a nearly two-week high, closing up 0.58%. Spot gold prices fluctuated, repeatedly testing the $3,760 mark during the session before facing pressure. Gold is currently fluctuating within a broad range, with intense buying and selling activity. Key support is forming below 3718/22, while resistance is forming above 3758/62. Continue to monitor this range for the day. Technically, the daily chart is trading above and below the 5-day moving average, with the RSI indicator trading above 70. The short-term hourly and four-hour moving averages are converging, and the Bollinger Bands are gradually closing. Prices are converging within the mid-range, with the RSI consolidating towards 50. Gold is expected to continue its broad range-bound trading on Friday. The day's trading strategy remains to sell high and buy low, with short-term participation. Trading Strategy: Short-term gold buy at 3722-3725, stop loss at 3714, target at 3760-3780; Short-term gold sell at 3762-3765, stop loss at 3774, target at 3730-3710; Key Points: First support level: 3737, second support level: 3722, third support level: 3704 First resistance level: 3762, second resistance level: 3788, third resistance level: 3805
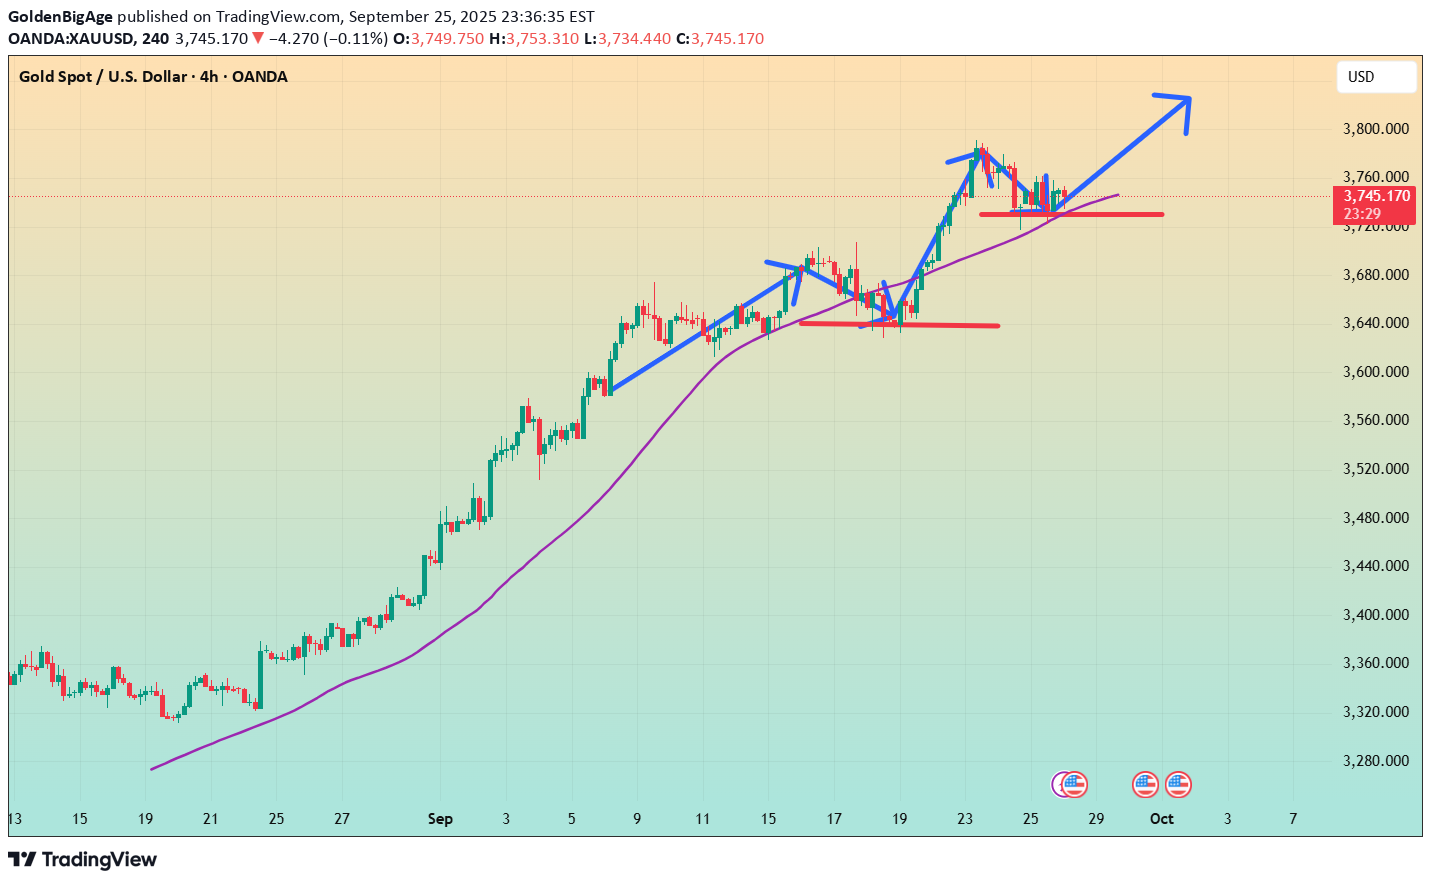
Gold Market Analysis: We sold at 3742 in today's Asian session and have already made a profit. Gold is no longer in a one-sided rally and has begun a major correction. We need to follow the trend and trade at the right pace. We are now entering a major trend. The most common questions we receive are: has a major decline begun? Has gold peaked? The daily chart closed with a negative candle yesterday, and the previous trading day also formed a vague tombstone candlestick pattern. At this point, we can only confirm short-term resistance, but we cannot confirm that the overall trend has peaked or that the weekly chart is bullish. Furthermore, the short-term correction has not yet disrupted the bullish trend in the 4H. Today, we will focus on gains and losses at 3700. A break of this level will trigger a sell signal on both the 4H and daily charts. Strong support in the 4H is around 3717. This level is supported by the 30-day moving average and also serves as a support pattern. Remember, the low point of a major pullback was around 3712? The reason why it rebounded so quickly yesterday was because it hit strong 4H support. Gold is unlikely to decline directly today. I predict a correction first, and then a rebound near 3717. If it breaks, watch out for large buys, as this could signal another surge. Resistance levels are 3751 and 3763, with strong resistance at 3773. Support levels are 3700 and 3717. The dividing line between strength and weakness is 3751. Fundamental Analysis: Gold surged and then retreated. The US dollar rebounded sharply after hitting a bottom. No major market data was released, and the Fed's policy action had no sustained impact on the market in the short term. Trading Recommendation: Gold - Sell around 3750, target 3720-3700.
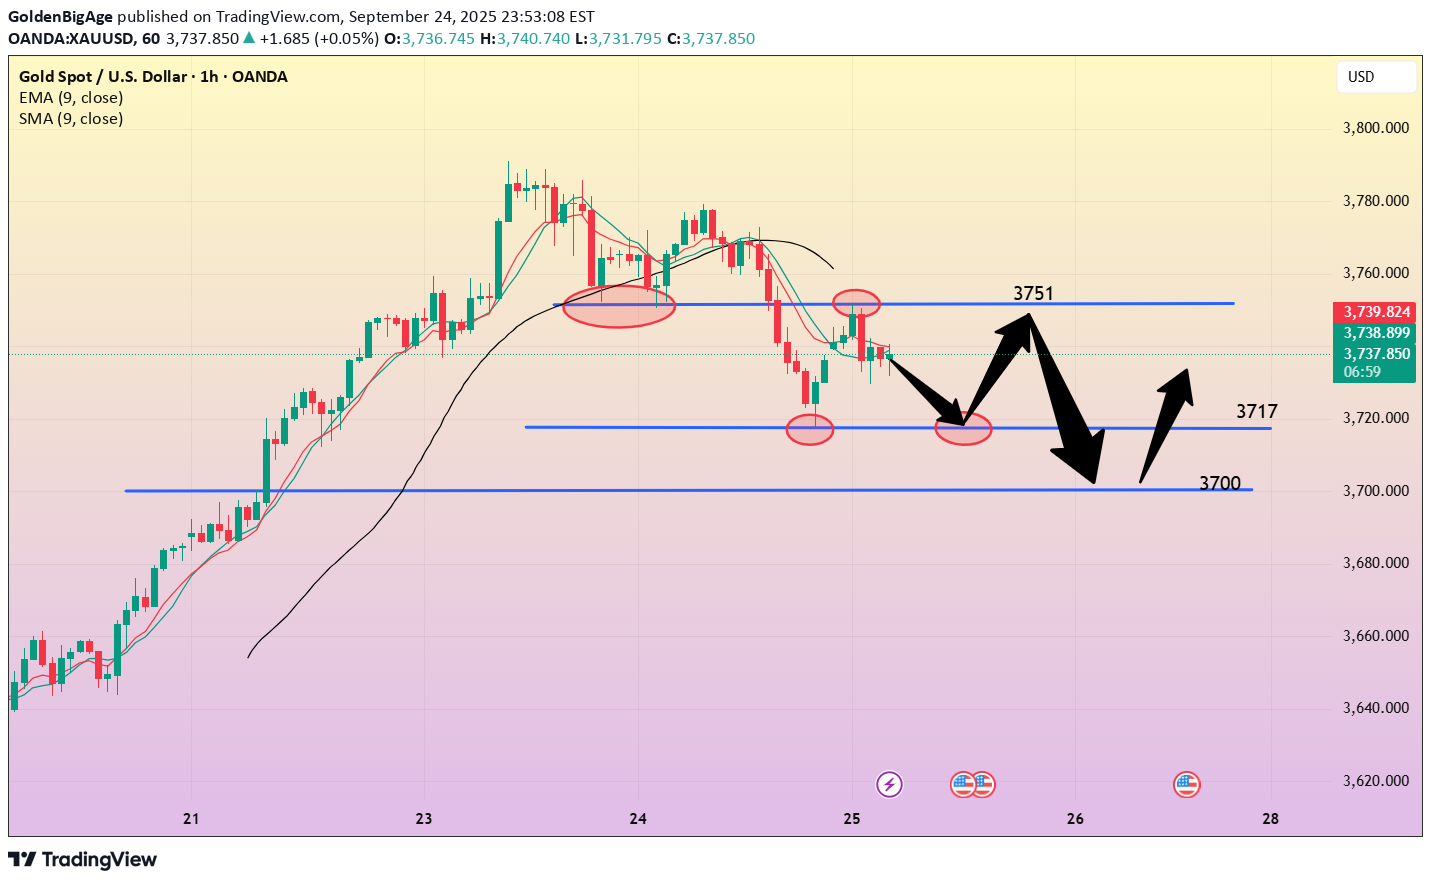
Market News: In early Asian trading on Thursday (September 25), spot gold prices fluctuated narrowly, currently trading around $3,750 per ounce. As investors digested comments from Federal Reserve Chairman Powell, the US dollar and US Treasury yields strengthened, sending international gold prices sharply lower. Powell signaled a cautious outlook for rate cuts, noting that the Fed must continue to balance the risks of high inflation and a weak job market in future rate decisions. Furthermore, Trump presented a Gaza peace outline to Arab leaders, the Russian and US foreign ministers reiterated their commitment to a peaceful resolution to the Ukraine crisis at a meeting, and the EU and US reached a tariff agreement, significantly cooling market risk aversion. Looking ahead, the market's attention is focused on two key US economic data releases later this week, which will provide further clues to the Fed's policy path and directly influence London gold prices. Thursday will see the release of weekly initial jobless claims data, while Friday's release of the US core personal consumption expenditures (PCE) price index, the Fed's preferred inflation indicator, will draw even greater attention. Technical Analysis: The US dollar index continued its upward trend during the day, briefly approaching the $98 mark. Gold prices adjusted under pressure, closing with a negative candlestick pattern on the daily chart. It retreated to the 5-day moving average at 3718, finding support at 3736. Since Tuesday's overbought top divergence from the RSI on the daily chart, gold has adjusted by over $70. Currently, the price of gold on the daily chart remains above the 10-day and 7-day moving averages, trading above 3700 and 3710, respectively. On the short-term four-hour chart, the price has retraced to the middle Bollinger Band, with the RSI indicator simultaneously adjusting to the 50 level to find support. The moving average formed a downward crossover at the high of 3767. Gold trading today is expected to continue with a wide range adjustment. Sell high and buy low, with the initial focus on the 3720/3760 range. Trading strategy: Short-term gold: Buy at 3717-3720, stop loss at 3708, target at 3750-3770; Short-term gold: Sell at 3772-3775, stop loss at 3784, target at 3730-3710; Key points: First support level: 3732, second support level: 3720, third support level: 3713 First resistance level: 3763, second resistance level: 3780, third resistance level: 3800
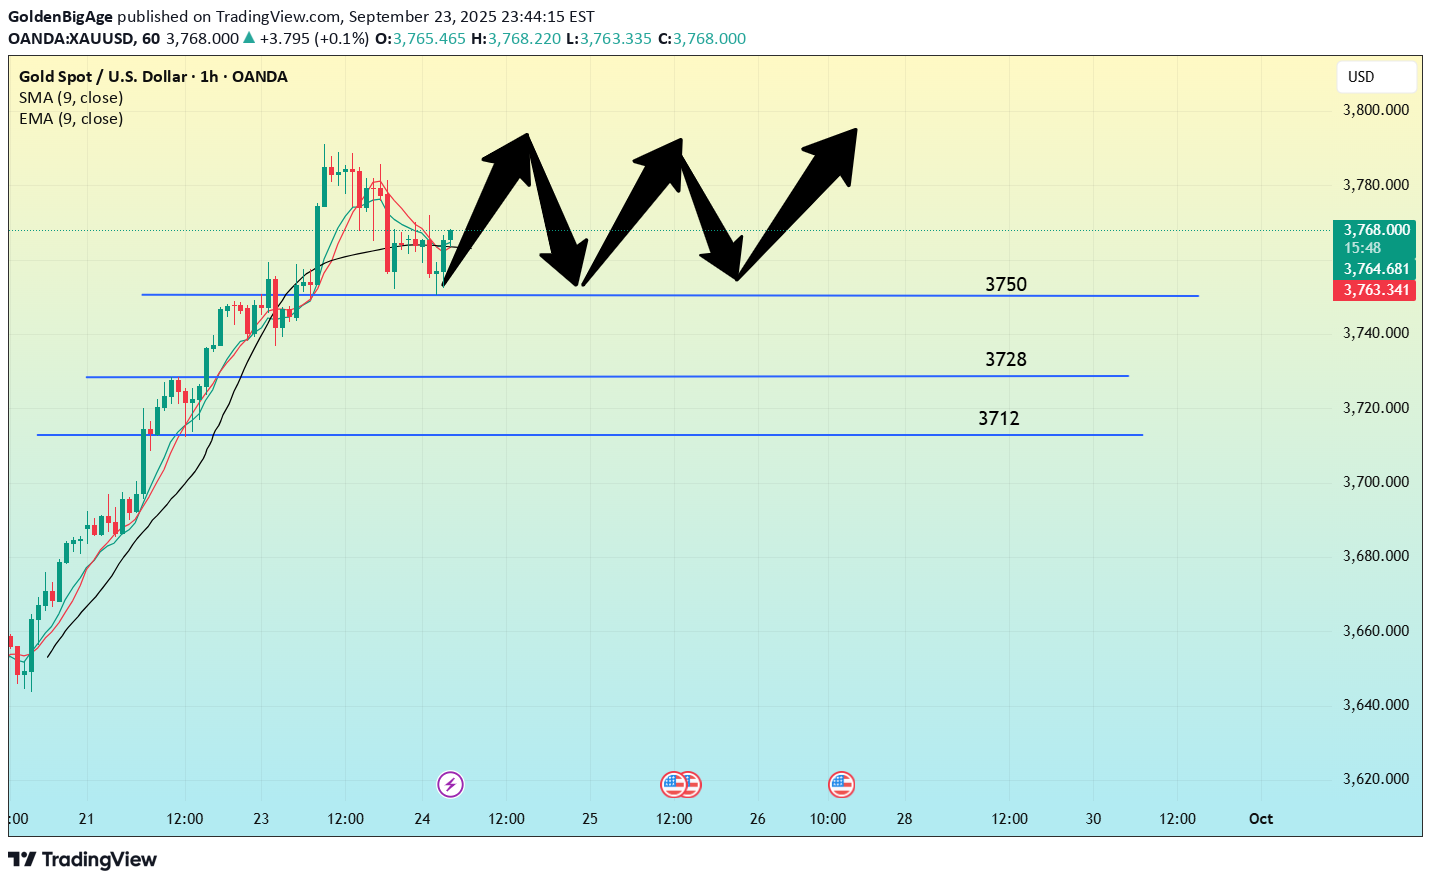
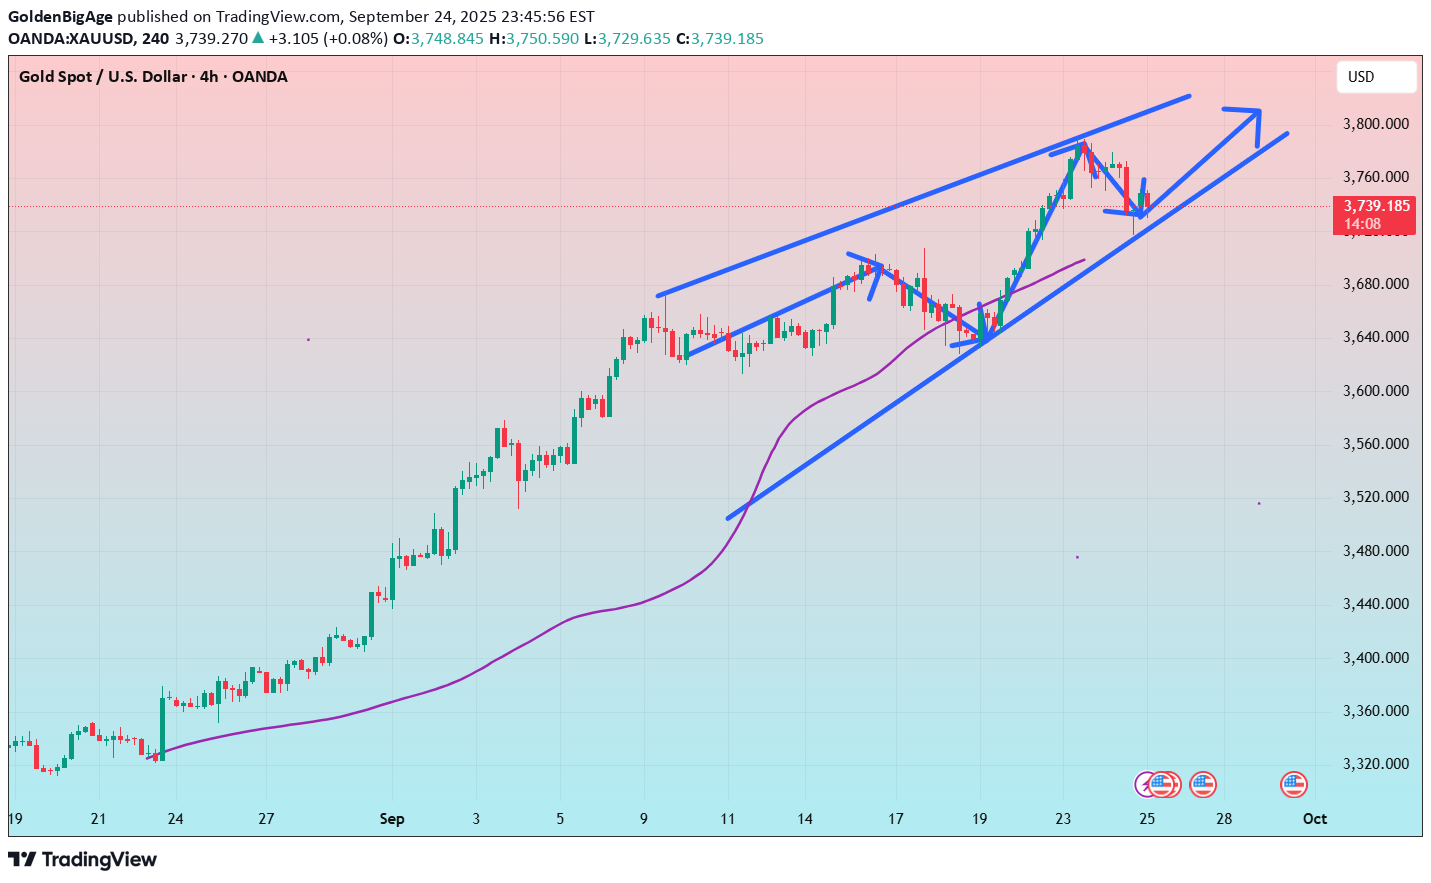
Gold Market Analysis: Yesterday's daily gold chart reached 3791. Our buy orders at 3643 and 3788 yielded huge profits. Gold's strength is so strong that it's making us question our own future. We currently don't see a peak. Yesterday's tail-end saw a pullback. The upper shadow on the daily chart is quite long, making it difficult to reach a new high today. The pullback in the Asian session also confirms that a correction will occur today. Yesterday's surge was excessive, requiring a technical correction. The indicators and chart patterns haven't kept pace, leading many investors to speculate on whether a peak has been reached. I believe it hasn't, and there's no definitive signal. A peak requires time and space to fully develop. Today's strategy is to buy and sell, as there's significant room for recovery. Consider buying low in the Asian session. Selling after the pullback is already underway is no longer feasible. We're unsure of the support level it will reach. Chart-wise, 3712 is the limit of this dive. If it unexpectedly breaks, we need to consider whether we've truly sold. Buy gold at 3750 in the Asian session. A break of this level would be unsatisfactory. It's a support level, a candlestick pattern, a point of yesterday's trading, or an indicator. Currently, it appears to be stabilizing. If it approaches the level again during the European and American sessions, buy more. The gold market will likely experience a period of volatility. Don't hold positions for too long. The likelihood of continued unilateral movement is low today. Resistance levels are 3781 and 3791, which are also selling areas. Support levels are 3750, 3728, and 3712. Resistance levels are 3781 and 3791. The dividing line between strength and weakness is 3750. Fundamental Analysis: There are no major fundamentals or data this week, just standard data. Focus on the impact of the Fed's rate cut. Trading Recommendations: Buy gold near 3750, target 3768-3788
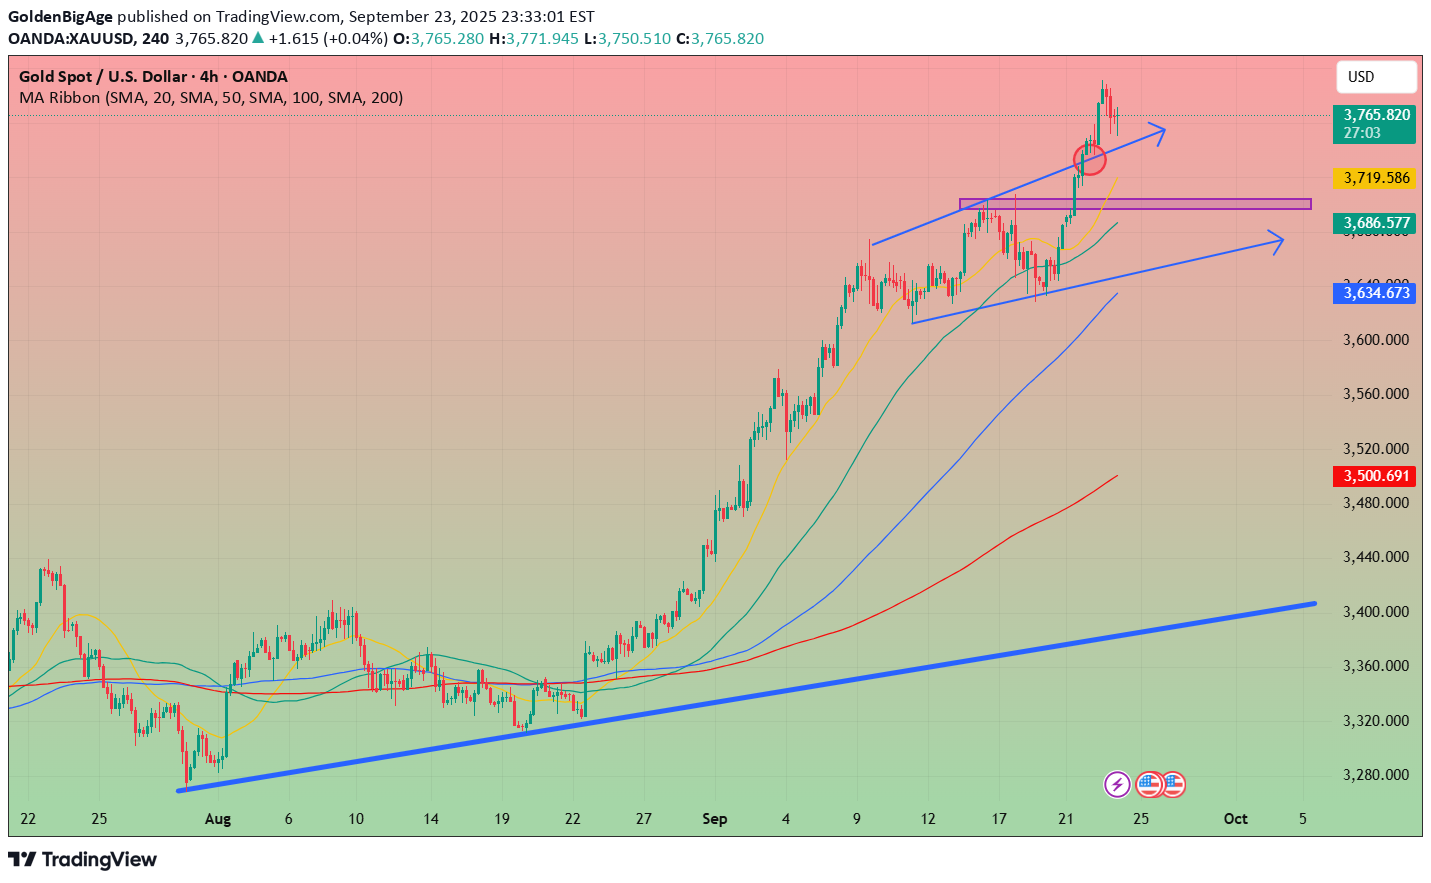
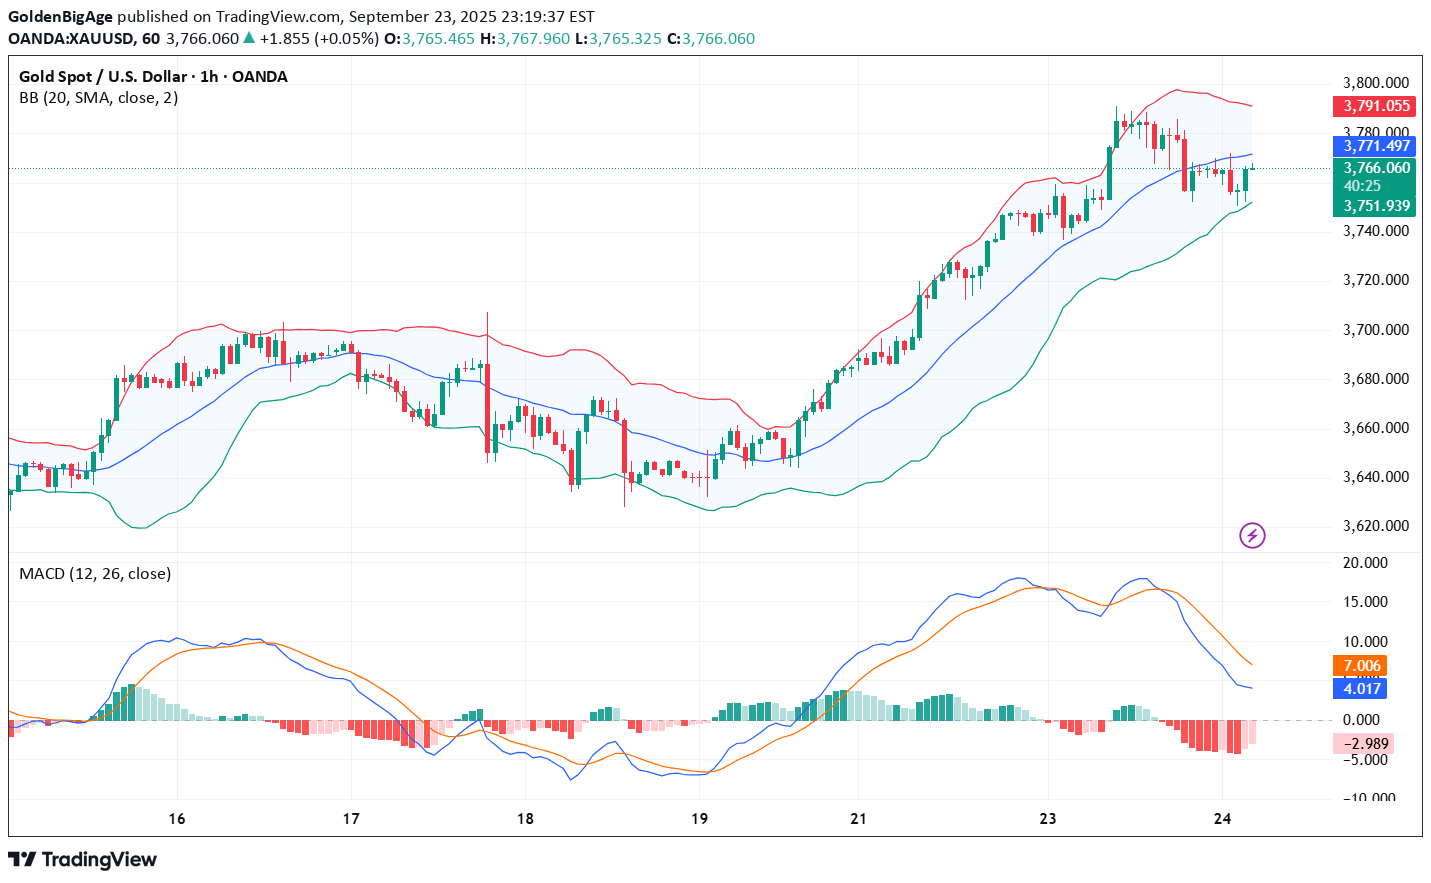
Market News: Spot gold fluctuated at high levels in early Asian trading on Wednesday (September 24), currently trading at $3,762 per ounce, not far from the all-time high reached overnight. Yesterday, gold prices experienced extremely volatile fluctuations, soaring to a record high of $3,791. However, following a speech by Federal Reserve Chairman Powell, the London gold price retreated significantly from this high. However, gold's overall upward trend remained intact, and the price ultimately closed higher that day. Powell's remarks last night largely reiterated his remarks at the press conference following last week's rate cut. He emphasized the challenges facing the Fed in achieving its dual objectives. "Two-way risks mean there is no risk-free path," Powell said. He noted that cutting rates too much, too quickly, could lead to inflation running persistently close to 3%, rather than the Fed's 2% target; while maintaining a restrictive policy stance for too long could lead to unnecessary labor market slack, driving gold prices lower. Investors' focus now turns to Friday's release of the US core personal consumption expenditures (PCE) price index, the Fed's preferred inflation indicator. If data shows easing inflationary pressures, it will strengthen the case for an interest rate cut, positive for gold. Conversely, if inflation remains stubborn, it could shake market confidence in a rate cut, causing short-term volatility in international gold prices. Technical Analysis: After three consecutive daily gains, gold prices are trading in the overbought zone at 80, signaling a divergence. This is also why, after yesterday's record high of 3790.97, gold prices retreated sharply to support at 51, driven by both technical and fundamental factors. Currently, after three consecutive daily gains, prices are trading significantly below the 10-day moving average at 3693, with the 5-day and 7-day moving averages at 3722 and 3707, respectively. On the short-term four-hour chart, prices are converging around the 10-day moving average. The RSI indicator has turned downward after overbought levels, and the hourly moving averages are converging, pushing prices back below the middle Bollinger Band. Gold prices could see further correction after their sharp rise, with the 3740/80 range being the initial target for the day. Trading strategy: Short-term gold: Buy at 3750-3753, stop loss at 3742, target at 3780-3800; Short-term gold: Sell at 3782-3785, stop loss at 3794, target at 3650-3630; Key points: First support level: 3750, second support level: 3735, third support level: 3712 First resistance level: 3778, second resistance level: 3791, third resistance level: 3808
Market Analysis: Federal Reserve Chairman Powell stated that the policy rate remains somewhat restrictive, but allows the Fed to better respond to potential economic developments; tariffs are expected to have a one-time pass-through effect; and decisions will "never be based on political considerations." Fed spokespersons noted that Powell's comments indicate he believes interest rates remain tight, potentially opening the door for further rate cuts. Technical Analysis: Today's Buy/Sell Levels: 3763 Support and Resistance Levels: 3817 3797 3784 3743 3730 3709 Trading Strategy: If the market breaks above 3763, consider entering a buy position, with the first target price being 3784. If the market breaks below 3743, consider entering a sell position, with the first target price being 3730.
Market News: On Tuesday, as market expectations for further Federal Reserve rate cuts grew, spot gold prices surged dramatically, reaching a record high. The rise in London gold prices stemmed from a combination of policy, macroeconomic, and geopolitical risk factors, reflecting the market's conflicting mood between exuberance and panic. Amidst rising global risks and uncertainties, international gold is becoming a "must-have" investment for investors. Global central banks continue to increase their gold reserves, coupled with continued inflows into gold ETFs, demonstrating continued strengthening demand for gold as a strategic investment by institutional investors. This trend has been a key driver of international gold prices over the past few months. At the same time, the risk of a potential US government shutdown has risen again. These uncertainties have heightened gold's safe-haven appeal. The war between Russia and Ukraine appears far from over, further driving up gold prices. Several Federal Reserve officials will speak this week, with the market focused on Friday's release of the core PCE price index. A continued decline in inflation data would reinforce expectations of further rate cuts in October and December. A low interest rate environment helps reduce the cost of holding gold, significantly increasing its appeal. Technical Analysis: Gold prices maintain a strong bullish trend, with the daily chart maintaining a strong bullish trend and reaching a new all-time high. The continued weakness of the US dollar further boosted buying momentum for gold and silver. On the daily chart, gold broke through 3750, reaching a new all-time high. Yesterday, the price of gold rose by over $75 per ounce. The latest 10-day and 7-day moving averages continue to trend upward, and the price is trading within the upper Bollinger Band. The short-term four-hour moving averages are trending upward, as are the Bollinger Bands. At this rate of increase, gold prices could soon reach 3800. This simplified market trend suggests buying low on pullbacks, with selling at key resistance levels supporting historical highs. Trends are king, and yesterday's continued declines and repeated buying demonstrates our trend-following strategy. Today's target is 3733/26, watch for low-price buying opportunities! Trading Strategy: Short-term gold: Buy at 3730-3733, stop loss at 3722, target at 3760-3780; Short-term gold: Sell at 3780-3783, stop loss at 3792, target at 3650-3630; Key Points: First Support Level: 3735, Second Support Level: 3720, Third Support Level: 3703 First Resistance Level: 3766, Second Resistance Level: 3780, Third Resistance Level: 3800
Market News: Federal Reserve Chairman Bostic: There is currently little reason to cut interest rates further, and only one rate cut is expected this year. Musallem: There is limited room for further rate cuts. If inflation risks increase, further rate cuts will not be supported. Hammak: We should be very cautious when lifting policy restrictions. My estimate of the neutral interest rate is on the higher side. Milan: I believe the appropriate interest rate is in the mid-2% range. I do not support adjusting the 2% inflation target at this time. Technical Analysis: Today's Buy/Sell Levels: 3726 Support and Resistance Levels: 3790 3766 3751 3701 3685 3661 Trading Strategy: If the price breaks above 3751, consider buying, with the first target at 3766. If the price breaks below 3726, consider selling, with the first target at 3701.
Disclaimer
Any content and materials included in Sahmeto's website and official communication channels are a compilation of personal opinions and analyses and are not binding. They do not constitute any recommendation for buying, selling, entering or exiting the stock market and cryptocurrency market. Also, all news and analyses included in the website and channels are merely republished information from official and unofficial domestic and foreign sources, and it is obvious that users of the said content are responsible for following up and ensuring the authenticity and accuracy of the materials. Therefore, while disclaiming responsibility, it is declared that the responsibility for any decision-making, action, and potential profit and loss in the capital market and cryptocurrency market lies with the trader.