
GoldMasterTraderX
@t_GoldMasterTraderX

What symbols does the trader recommend buying?
Purchase History
پیام های تریدر
Filter
GoldMasterTraderX
استراتيجية تداول الذهب للاثنين القادم

📊طلا در این هفته بازار پرنوسانی را نشان داد و قیمتها بارها بین سطح فشار ۲۹۳۰ و سطح حمایت ۲۸۹۲ نوسان داشتند. طبق استراتژی فروش در اوج و خرید در کف، چندین بار سود کسب کردیم. دادههای حقوق و دستمزد غیرکشاورزی و مزایای بیکاری در روز جمعه برای طلا صعودی بود، اما قیمت طلا پس از افزایش همچنان کاهش مییابد و الگوی پرنوسان را حفظ میکند.📊خط طلا به مدت یک ساعت در محدوده نوسان صندوق نوسان میکند، اما میانگین متحرک شروع به تغییر کرده است. اگر میانگین متحرک در هفته آینده به سمت پایین منحرف شود، ممکن است منجر به سرکوب اعتماد گاوها شود. مقاومت فعلی در محدوده ۲۹۲۸-۲۹۳۰ قرار دارد. فقط با شکست موثر و تثبیت در ۲۹۳۰ میتوان فضای صعودی بیشتری را باز کرد.🔴سطوح مقاومت بالا: -اول: ۲۹۲۸-۲۹۳۰ -دوم: ۲۹۴۰-۲۹۵۰ -سوم: ۲۹۵۶-۲۹۶۰ 🟢سطوح حمایت پایین: -اول: ۲۸۹۵-۲۸۹۰ -دوم: ۲۸۸۵-۲۸۸۰ -سوم: ۲۸۶۵-۲۸۶۰ ✅طلا برای سه روز متوالی در خط روزانه با الگوی ستاره متقاطع بسته شد. روند در روز دوشنبه پس از باز شدن بازار باید مورد توجه قرار گیرد. توصیه میشود قبل از نزدیک شدن به نقاط اوج و فرود دیروز (۲۹۳۰-۲۸۹۵) به اتخاذ استراتژی فروش در اوج و خرید در کف ادامه دهید.✅استراتژیهای معاملاتی به زمان حساس هستند. ما استراتژیهای معاملاتی را در زمان واقعی با توجه به تغییرات بازار تنظیم کرد. لطفا توجه داشته باشید.
GoldMasterTraderX
Gold Trading Strategy For Next Monday

📊Gold showed a volatile market this week, with prices fluctuating repeatedly between the 2930 pressure level and the 2892 support level. According to the strategy of shorting at high and buying at low, we have made profits many times. Friday's non-farm payrolls and unemployment benefit data are both bullish for gold, but gold prices still fell back after rising, maintaining a volatile pattern.📊The gold 1-hour line fluctuates within the box oscillation range, but the moving average has begun to turn. If the moving average diverges downward next week, it may suppress the confidence of bulls. The current resistance is in the 2928-2930 range. Only by effectively breaking through and standing firm at 2930 can the upward space be further opened.🔴Upper resistance level:-First: 2928-2930-Second: 2940-2950-Third: 2956-2960🟢Lower support level:-First: 2895-2890-Second: 2885-2880-Third: 2865-2860✅Gold closed with a cross star for three consecutive days on the daily line. The trend on Monday needs to be observed after the opening. It is recommended to continue to adopt a high-sell and low-buy strategy before approaching yesterday's high and low points(2930-2895).✅Trading strategies are time-sensitive. We will adjust trading strategies in real time according to market changes. Please pay attention.✅Intraday Trading strategy: 🔶GOLD SELL: 2928-2930 🔰TP1: 2915 🔰TP2: 2900 🔰TP3: 2895 OPEN~ 🔶GOLD BUY: 2893-2896 🔰TP1: 2910 🔰TP2: 2920 🔰TP3: 2930 OPEN~ ✅Trading strategies are time-sensitive. We will adjust trading strategies in real time according to market changes. Please pay attention.
GoldMasterTraderX
Altın Teknik Analizi, 6 Mart

📊اخیراً قیمت طلا نوسانات زیادی داشته و رقابت بین خریداران و فروشندگان شدید است. دیروز، نمودار روزانه با الگوی «ستاره متقاطع» بسته شد. اگرچه دادهها نشاندهنده روند صعودی طلا هستند، قیمت بهطور چشمگیری افزایش نیافته است. در عوض، پس از افت در معاملات پایانی، به شکل V بازیابی شد. طلا آخرین اوج خود در 2929 را شکست، اما نتوانست روند صعودی خود را حفظ کند و به نوسان در سطح بالایی ادامه داد.📊سطح روزانه: برگشت بزرگ V شکل در نمودار روزانه، روند صعودی را تأیید کرده و انتظار میرود بازار به دنبال این روند ادامه دهد. خریداران هنوز هم دارای قدرت صعودی هستند، اما این هفته دادهها فشرده هستند و انتظار میرود روند صعودی بارها عقبنشینی کند و یکشبه حاصل نشود.📊سطح یکساعته: طلا هنوز در محدوده نوسانات گسترده در سطح یکساعته قرار دارد و خریداران نتوانستهاند به طور کامل تسلط پیدا کنند. 2890، حمایت اصلی برای جلسات معاملاتی اروپا و آمریکا امروز است. اگر قبل از جلسه آمریکا به زیر این سطح برسد، ممکن است بیشتر به خط 2880-2878-2864 کاهش یابد که یک فرصت نسبتاً امن برای ورود و موقعیت خرید طولانی است.🔴سطوح مقاومت بالا:-اولین: 2927-2930-دوم: 2940-2950🟢سطوح حمایت پایین:-اولین: 2895-2890-دوم: 2880-2878-سوم: 2864📛مدیریت ریسک✅طلا در حال حاضر در مرحله تثبیت بالایی قرار دارد و روند صعودی آشکار است، اما افزایش ممکن است تکرار شود. از نظر عملیاتی، توصیه میشود عمدتاً در هنگام اصلاح قیمت، موقعیت خرید (Long) باز شود، به سطوح حمایت و مقاومت اصلی توجه شود و در برخورد با خطرات احتمالی تنظیم قیمت، احتیاط شود. ✅استراتژیهای معاملاتی به زمان حساس هستند. ما استراتژیهای معاملاتی را به صورت لحظهای بر اساس تغییرات بازار تنظیم کرد. لطفاً توجه داشته باشید.
GoldMasterTraderX
التحليل الفني للذهب 6 مارس

📊در این اواخر، قیمت طلا نوسانات زیادی داشته و رقابت بین خریداران و فروشندگان شدید بوده است. دیروز، نمودار روزانه با یک الگوی دوجی بسته شد. با وجود اینکه دادهها برای طلا صعودی بودند، قیمت به طور چشمگیری افزایش نیافت. در عوض، پس از افت در اواخر معاملات، به شکل حرف V بازگشت. طلا اخیراً بالاترین سطح خود را در 2929 ثبت کرد، اما نتوانست روند صعودی را ادامه دهد و به پرواز در سطح بالایی ادامه داد.📊سطح روزانه: بازگشت بزرگ به شکل V در نمودار روزانه، روند صعودی را تأیید میکند و انتظار میرود بازار این روند را دنبال کند. خریداران هنوز قدرت صعودی دارند، اما دادهها در این هفته متراکم هستند و انتظار میرود روند صعودی به طور مکرر عقبنشینی کند و یک شبه محقق نشود.📊سطح یک ساعته: طلا همچنان در محدوده نوسانات بزرگ در سطح یک ساعته قرار دارد و خریداران به طور کامل تسلط نیافتهاند. 2890 سطح حمایت اصلی برای جلسات معاملاتی اروپا و آمریکا امروز است و در صورت سقوط به زیر این سطح قبل از جلسه معاملاتی آمریکا، ممکن است بیشتر به خط 2880-2878-2864 سقوط کند، که یک نقطه ورود نسبتاً امن و فرصت خرید است.🔴سطوح مقاومت بالایی:-اول: 2927-2930-دوم: 2940-2950🟢سطوح حمایت پایینی:-اول: 2895-2890-دوم: 2880-2878-سوم: 2864📛مدیریت ریسک✅طلا در حال حاضر در مرحله تثبیت بالا قرار دارد، و روند صعودی واضح است اما ممکن است افزایش مکرر باشد. از نظر عملیات، توصیه می شود عمدتاً به سمت خرید در افت ها حرکت کنید، به سطوح حمایت و مقاومت اصلی توجه کنید و در برخورد با خطرات احتمالی تعدیل محتاط باشید.✅استراتژی های معاملاتی حساس به زمان هستند. ما استراتژی های معاملاتی را در زمان واقعی با توجه به تغییرات بازار تنظیم کرد. لطفا توجه کنید.
GoldMasterTraderX

🔴Upper resistance level:-First: 2940-2942-Second: 2946-2952-Third: 2960🟢Lower support level:-First: 2924-2931-Second: 2915-2920-Third: 2905-2907✅Trading strategy:-Go long with a light position when the price falls back to 2912-2920, target 2946-2950-If it breaks through 2946, go long when the price falls back to 2930-2935, target 2960-Focus on the breakthrough of the 2939-2940 range, as there will be a chance to hit a new high only after an effective breakthrough
GoldMasterTraderX
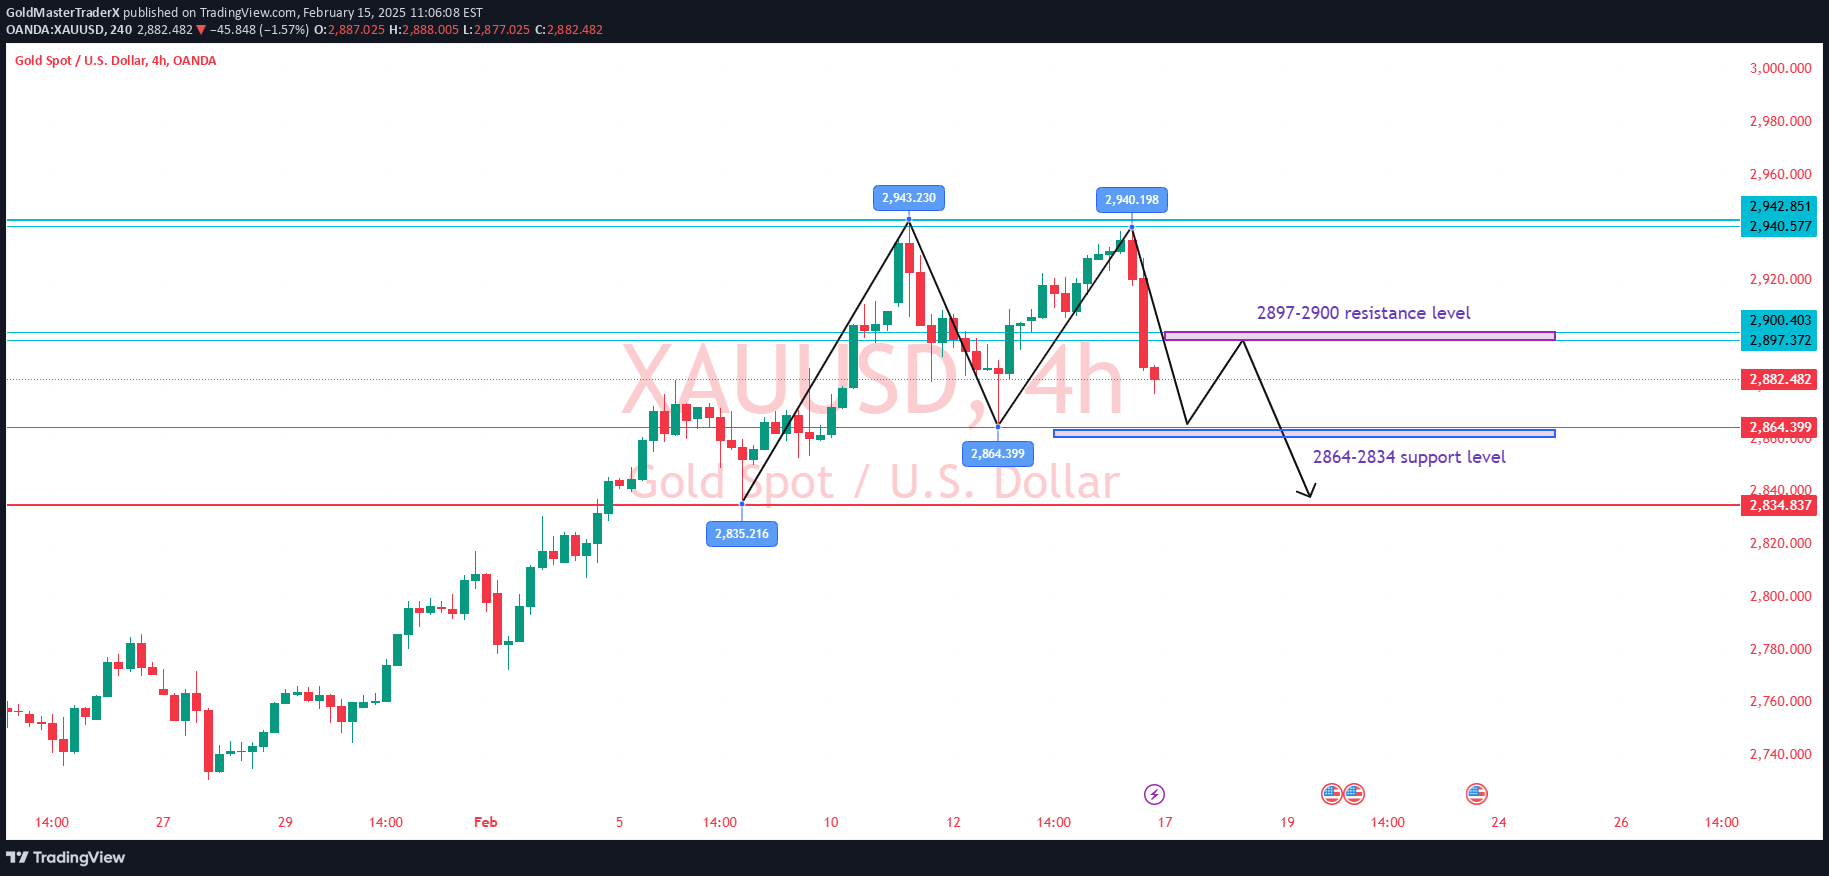
📊Gold fell sharply during the US trading session on Friday, and a typical double top structure was formed on the technical side. One of the reasons for this decline is that the progress of the negotiations between the United States and Ukraine has promoted the easing of the situation between Russia and Ukraine, which has led to a decrease in the safe-haven demand for gold, and the price of gold has subsequently fallen sharply.📊An obvious double top pattern has appeared on the 4-hour chart of gold, and it has failed to break through the historical high, showing the weakness of the upward momentum of the price. Subsequently, the price of gold has fallen continuously, suggesting that gold may have peaked in the short term.🔴Gold has currently fallen below the short-term moving average support and has formed a clear pressure range above. In the short term, the pressure level of gold is mainly concentrated at 2897 and 2900.🟢In terms of support, pay attention to the low point of 2864. If the gold price falls below this support level, further downward space may open up. The further support range below is 2834.✅In the short term, when gold rebounds to around 2890, it is recommended to go short. The target price first looks at the low point of 2864. If the gold price continues to break below 2864, it may further pull back 30 points, and the next support level is 2834.✅If the gold price falls below the 2864 area and there is no obvious fundamental support for the bulls, the bearish trend may continue, so a stop loss should be set to avoid blindly chasing more.✅Trading strategy: 🔶GOLD SELL: 2890-2893 🔰TP1: 2870 🔰TP2: 2865 🔰TP3: 2835 OPEN~ 🔶GOLD BUY: 2835-2838 🔰TP1: 2850 🔰TP2: 2860 🔰TP3: 2865 OPEN~
GoldMasterTraderX

🔴 The level of Alawite Resistance:-First: 2938-2942-Two: 2948-2952-third: 2955-2960🟢 Lower support level:-First: 2924-2922-second: 2910-2906-third: 2892-2885 ✅ Trading strategy within Today, Asia and Europe:-If the price maintains a narrow range above 2910, wait for the price to stabilize in the range The pattern of emerging devouring in 2885-2892 region 🔰 American session:- If the European session penetrates the level of 2945, and it decreases to about 2935 during the American session, we can enter into long-term purchase deals with a light center, and the goal is 2955-2960- If the European Asian session rises to about 2945 under pressure, we can try to enter into sales deals at 2942-2945 in the American session, and target 2925-2915 📛 Warning of risk: gold is currently going through the third wave of emerging waves at the monthly level. The average bullish trend has not changed, but after the nine successive weekly gains, we need to be careful about the technical correction caused by profit. It is recommended mainly towards the long purchase at the declines, ensuring that the heights are pursued, and awaiting the decline in the main support to arrange the long -term purchase orders.
Disclaimer
Any content and materials included in Sahmeto's website and official communication channels are a compilation of personal opinions and analyses and are not binding. They do not constitute any recommendation for buying, selling, entering or exiting the stock market and cryptocurrency market. Also, all news and analyses included in the website and channels are merely republished information from official and unofficial domestic and foreign sources, and it is obvious that users of the said content are responsible for following up and ensuring the authenticity and accuracy of the materials. Therefore, while disclaiming responsibility, it is declared that the responsibility for any decision-making, action, and potential profit and loss in the capital market and cryptocurrency market lies with the trader.