
ForexFox_SA
@t_ForexFox_SA

What symbols does the trader recommend buying?
Purchase History
پیام های تریدر
Filter
ForexFox_SA
WHAT HAPPENS NEXT?
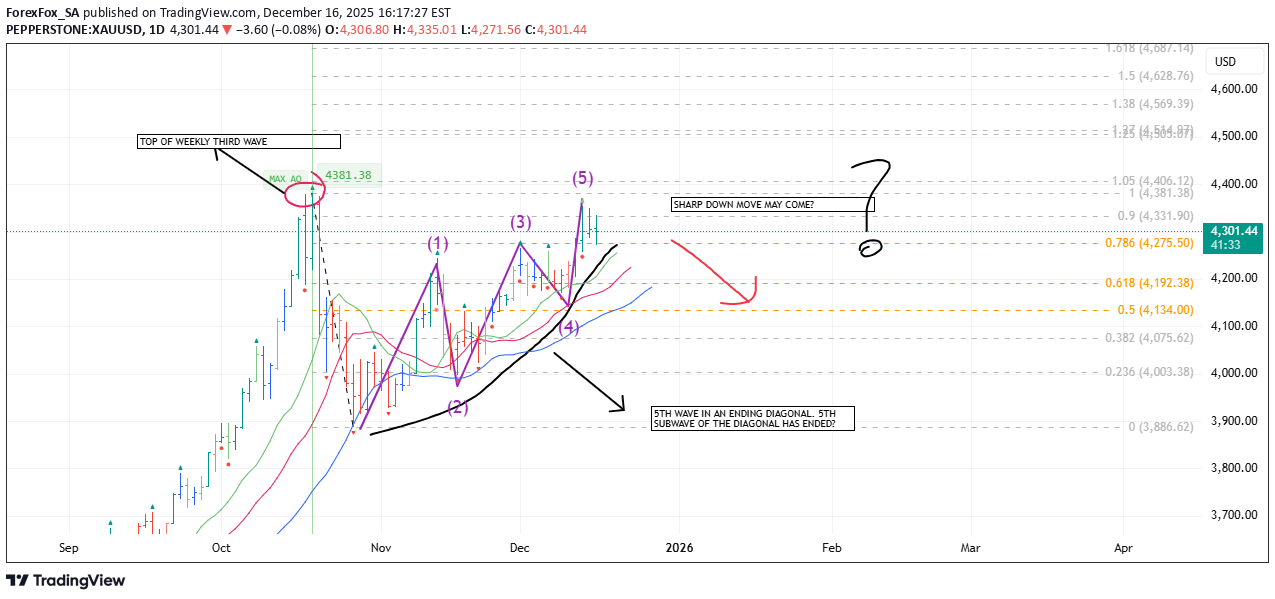
5th wave may be ending and a sharp down move may come. This are just predictions not advice. Becareful.
ForexFox_SA
موج چهارم اصلاحی آغاز شد: سناریوهای احتمالی و سرنوشت قیمت (آیا سقوط در راه است؟)
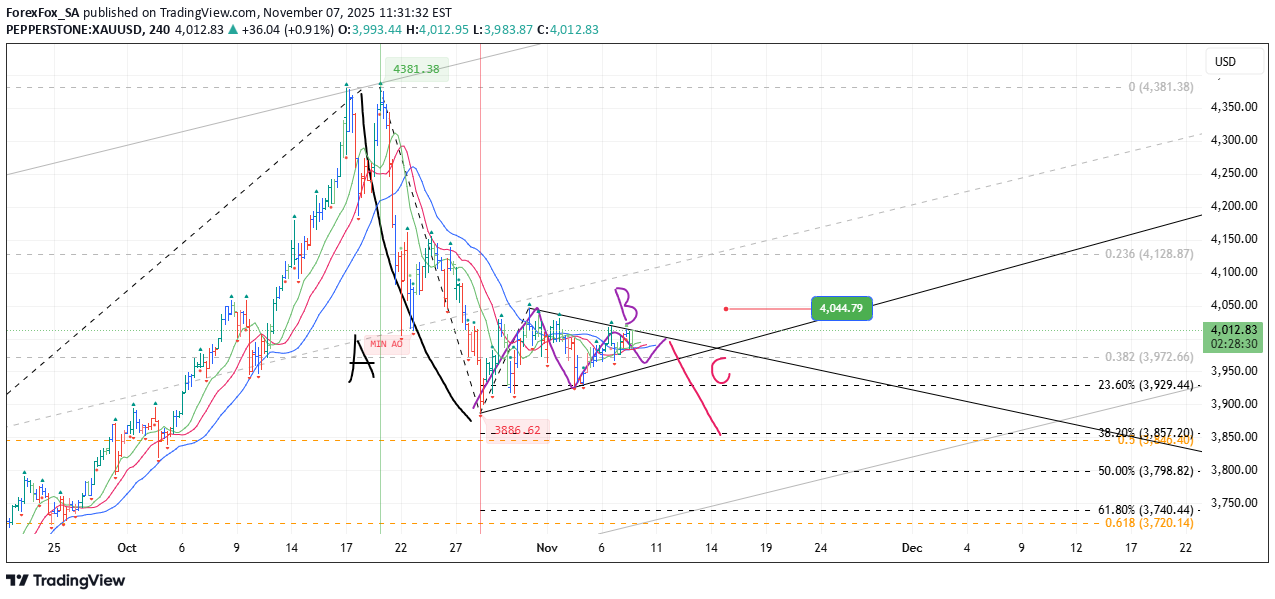
I believe that the third wave has ended on the daily and weekly charts and that we are currently in the fourth corrective wave. I tried to draw the details of the correction on the 4-hour chart. The correction we are in may not be a classic correction and may be more complex; however, the B movement we are in appears to be forming a symmetrical triangle, and with the 6th movement, these triangles may break down or up; that is, the direction is unclear. However, if we are within an A-B-C correction and B is currently forming, a downward C movement is likely to follow. If there is no daily stay above 4040, the C downward movement is highly probable. I have also indicated C's first target on the chart. These are not recommendations, but my own conclusions.
ForexFox_SA
What Happens Next?
I believe we are in a correction wave on the daily chart, and I think this correction wave could take us to the 3600s. I tried to show the sub-waves of the daily correction on the chart.
ForexFox_SA
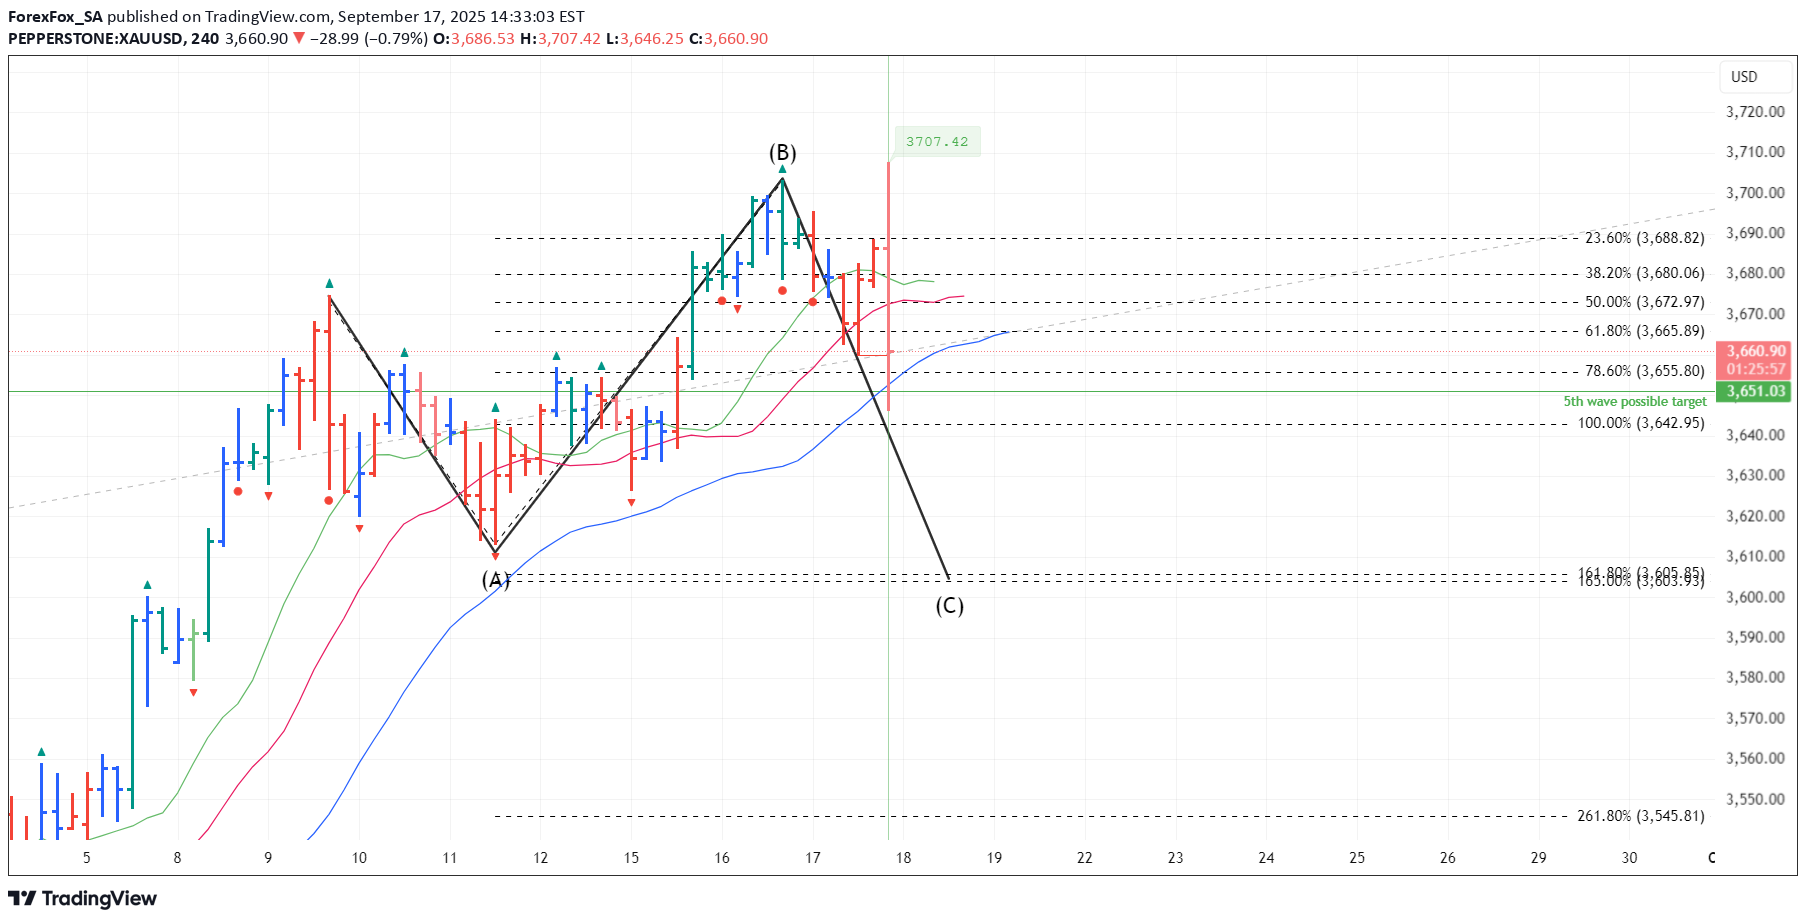
What Happens Next?
Be careful! The price is pretty close to the 5th wave target which I put a horizontal green line. A correction may start.
ForexFox_SA
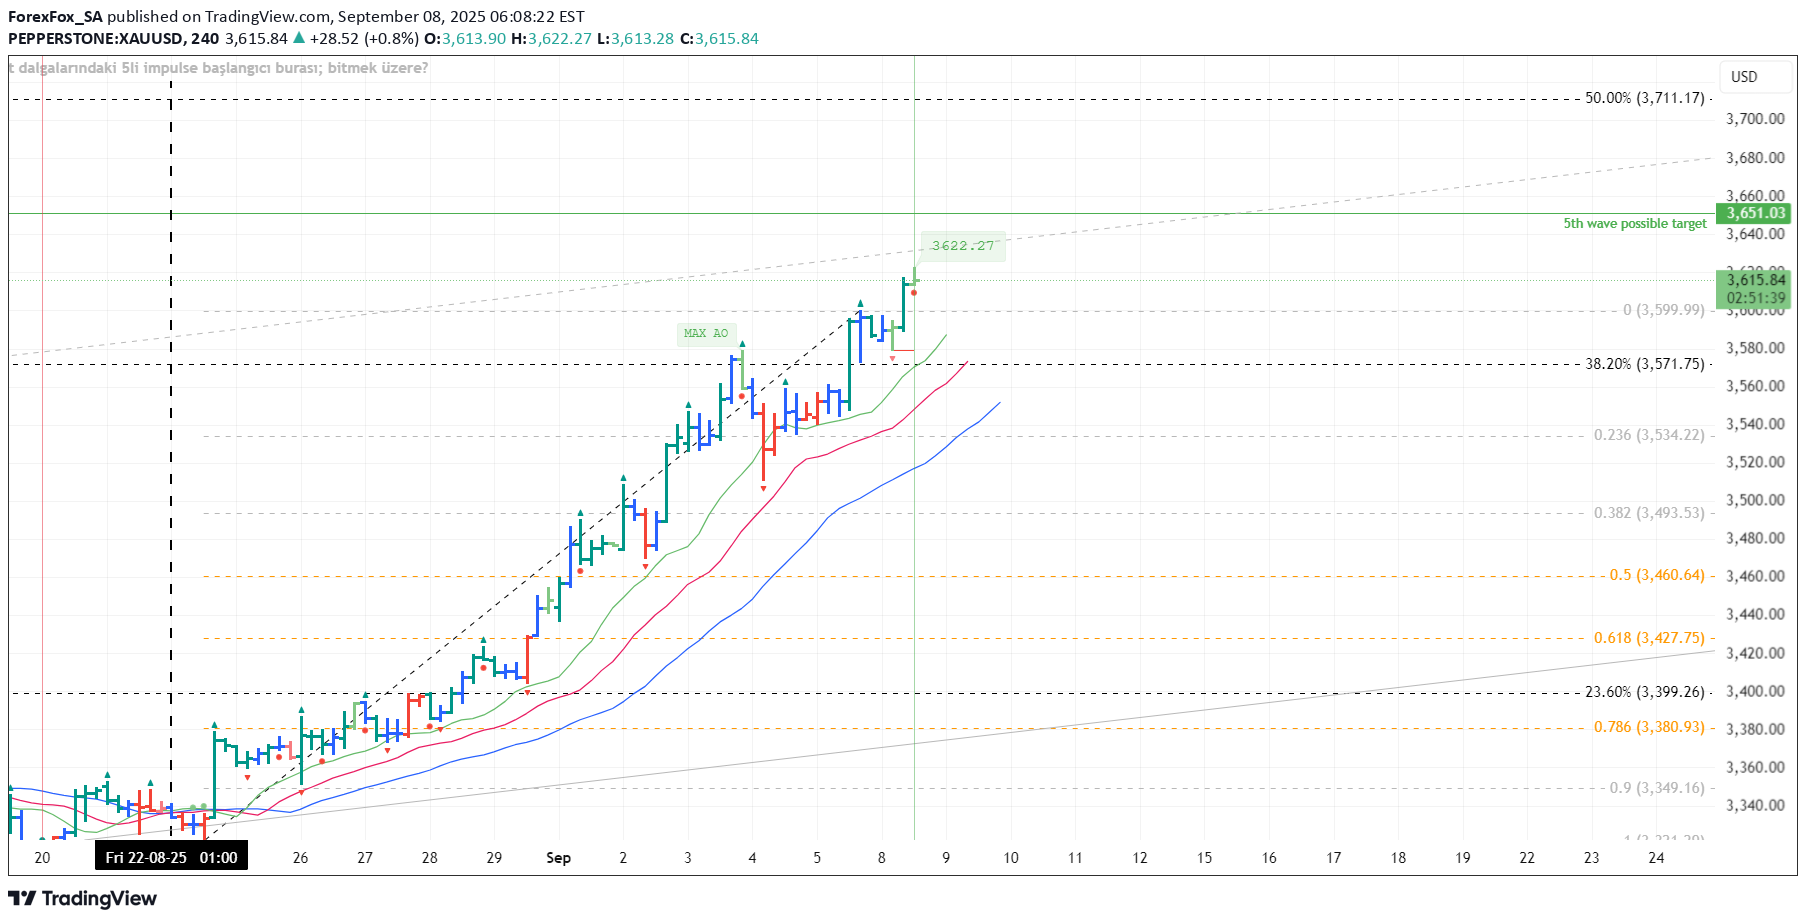
What Happens Next?
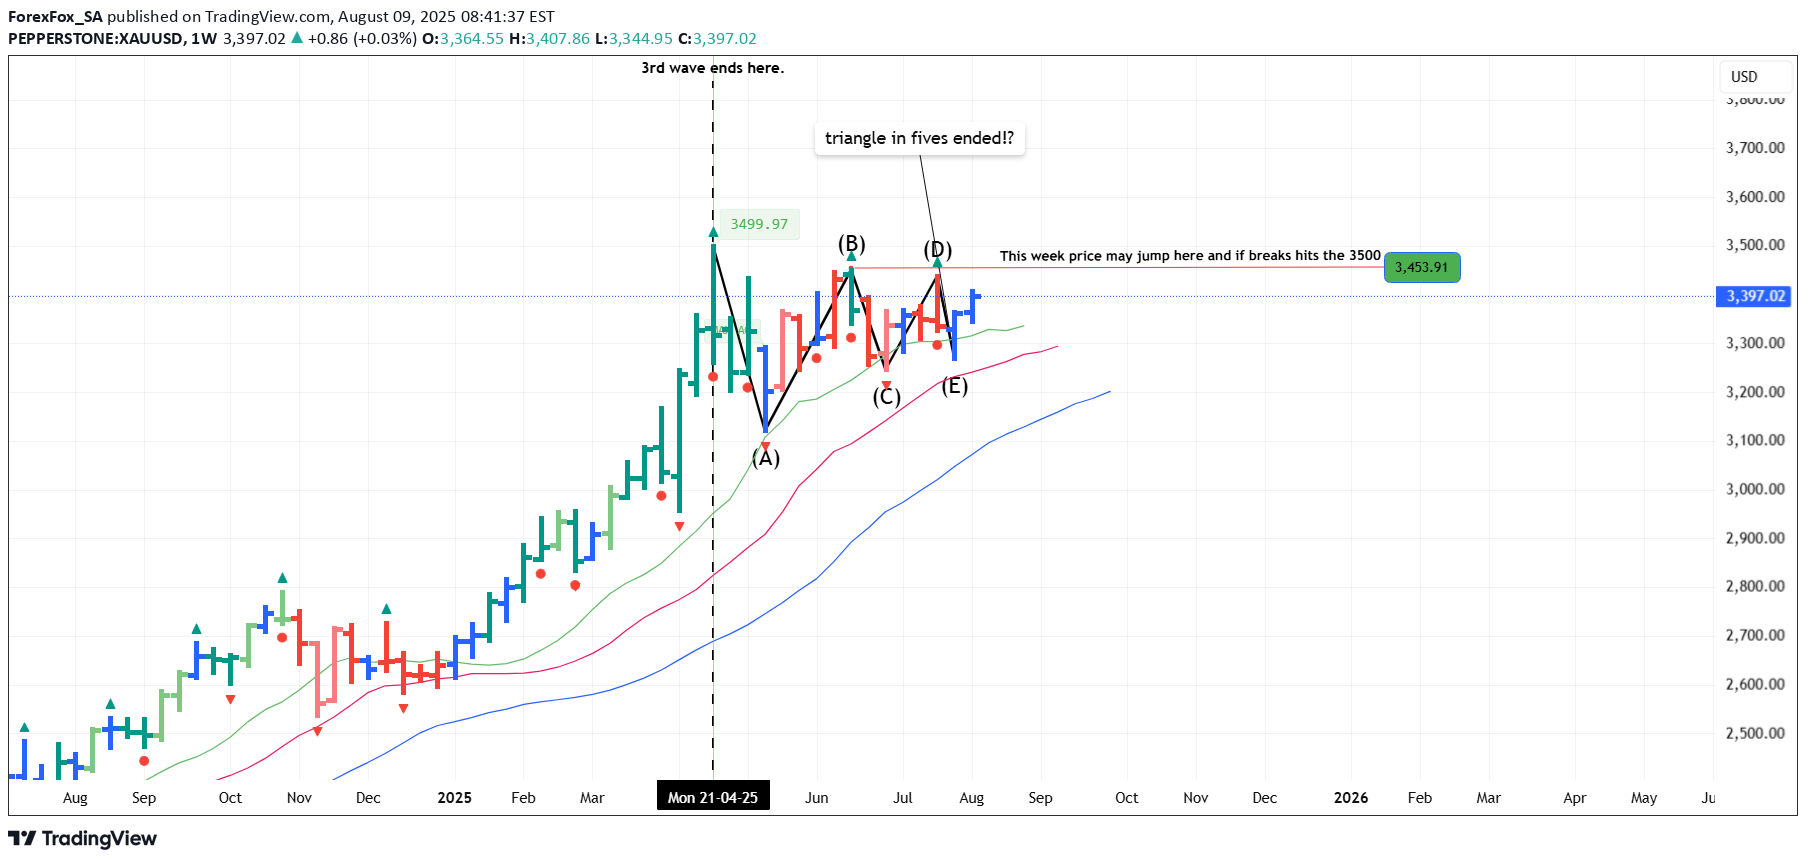
It seems the weekly triangle in fives is over!? and a swift price jump may come. I am ready to go long.
ForexFox_SA
What Happens Next? Has the up move started !?
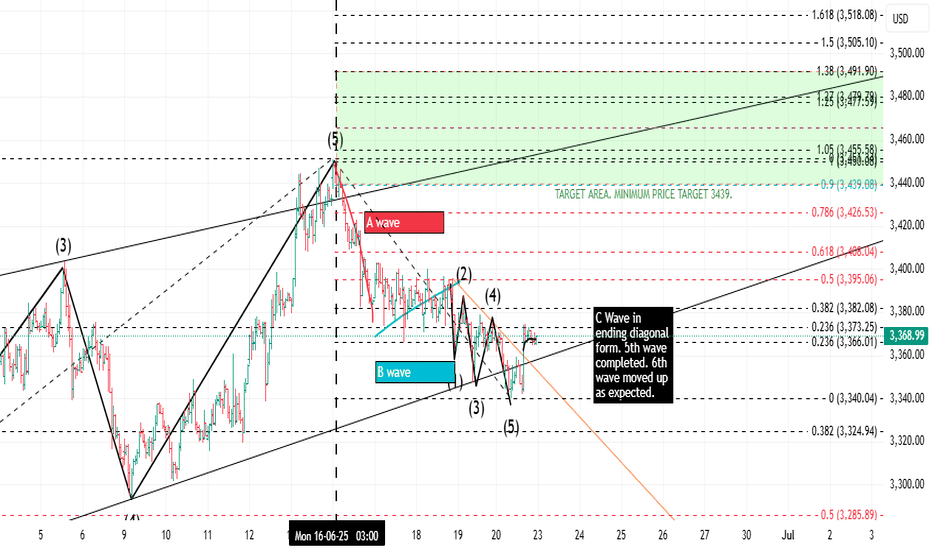
In line with my previous analysis, the price rose back above the lower trend line. Now looking at the detail of the bearish waves, it is possible that an up move could take the price to at least around 3440. That is my expectation. Keep in mind that this is a forecast as a result of an analysis.
ForexFox_SA
What Happens Next? Down move still continues!?
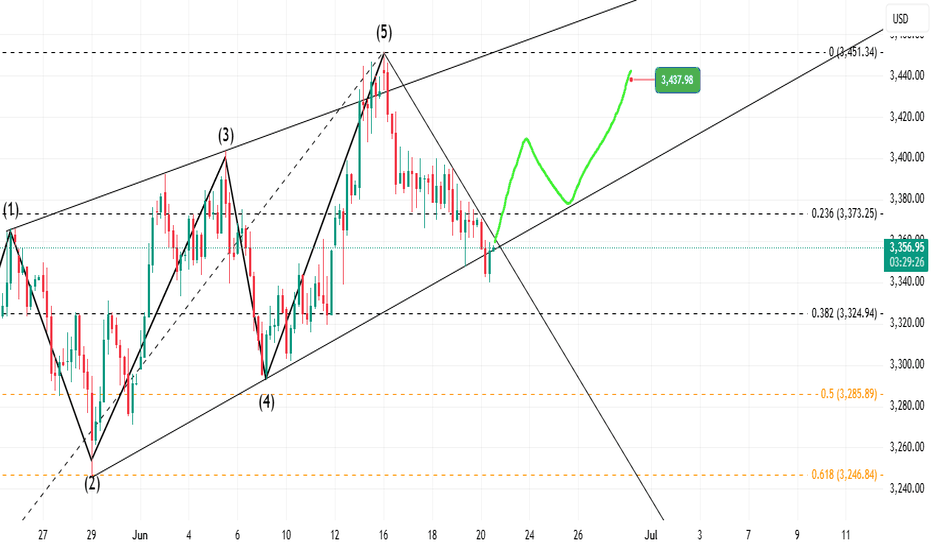
The price is at the bottom line of the previous diagonal move's lower trend line. Momentum in price and volume indicates an up move is on the way. My prediction is to see a price around 3440.
ForexFox_SA
Be careful! A sharp correction ahead!?

Price reached one of the important target levels in my previous forecast. Now it seems to signal an important pullback. Be careful when go long.
ForexFox_SA
What May Happen Next In Long Term?

Looking at where we are in the trend on the daily chart, I think we are in the correction of the uptrend and the last movement we are in is a triangle. Triangles like the one in the figure, after completing 5 waves, break on the barrier forming side of the triangle in wave number 6. Therefore, I expect a bullish breakout from these levels. This move may also exceed the previous high; however, it is too early to say that this is exactly the target at the moment. I think the first target is the 3414-3335 range.
ForexFox_SA
What Happens Next? Going short is logical?

It seems, we have finished a 5 wave impulse and an ABC zigzag type correction. In wave theory, A-B-C correction which is a Zig-zag type correction takes back the %61.8 lenght of the previous impulse. Please check where the price closed today. EXACTLY 0,618 (%61.8) fibo retracement level of the previous impulse. Therefore, it is not a good idea to go for short if there is not a price close below 3305 in 4hrs chart on Monday.
Disclaimer
Any content and materials included in Sahmeto's website and official communication channels are a compilation of personal opinions and analyses and are not binding. They do not constitute any recommendation for buying, selling, entering or exiting the stock market and cryptocurrency market. Also, all news and analyses included in the website and channels are merely republished information from official and unofficial domestic and foreign sources, and it is obvious that users of the said content are responsible for following up and ensuring the authenticity and accuracy of the materials. Therefore, while disclaiming responsibility, it is declared that the responsibility for any decision-making, action, and potential profit and loss in the capital market and cryptocurrency market lies with the trader.