
Fairmont-Markets
@t_Fairmont-Markets

What symbols does the trader recommend buying?
Purchase History
پیام های تریدر
Filter
Fairmont-Markets
الگوهای مقاومتی بازار: منتظر اصلاح عمیق تا سال 2026 باشید!
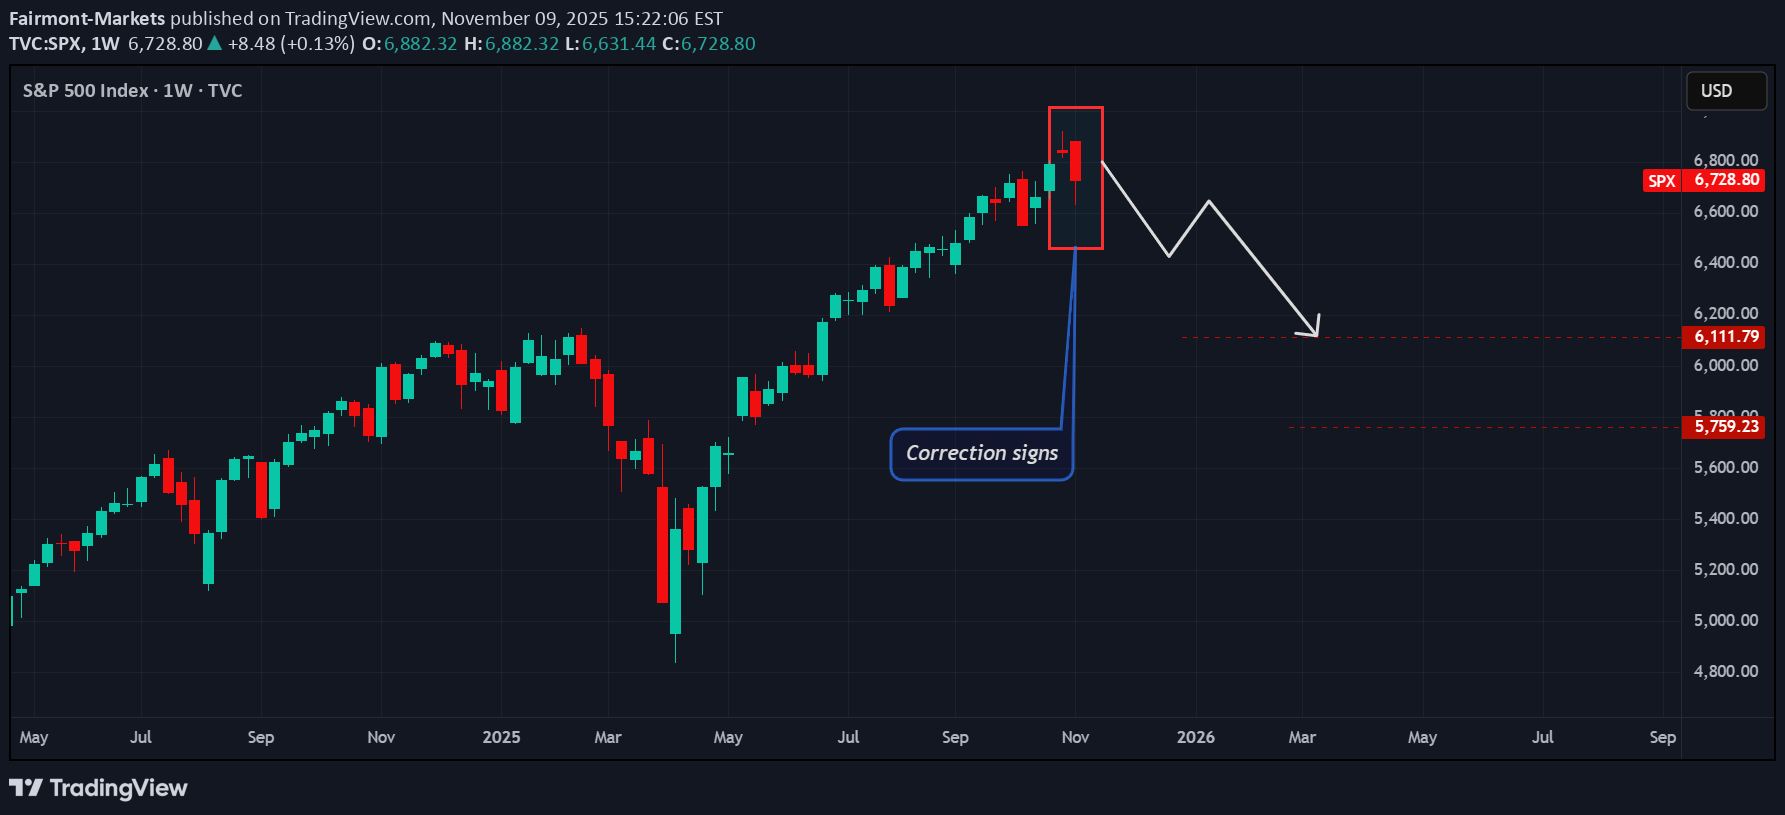
Watch for a sustained correction between the 27th October top until March 2026. Trade safe, good luck.
Fairmont-Markets
QUICK BUY - KILL IT OR BE DONE
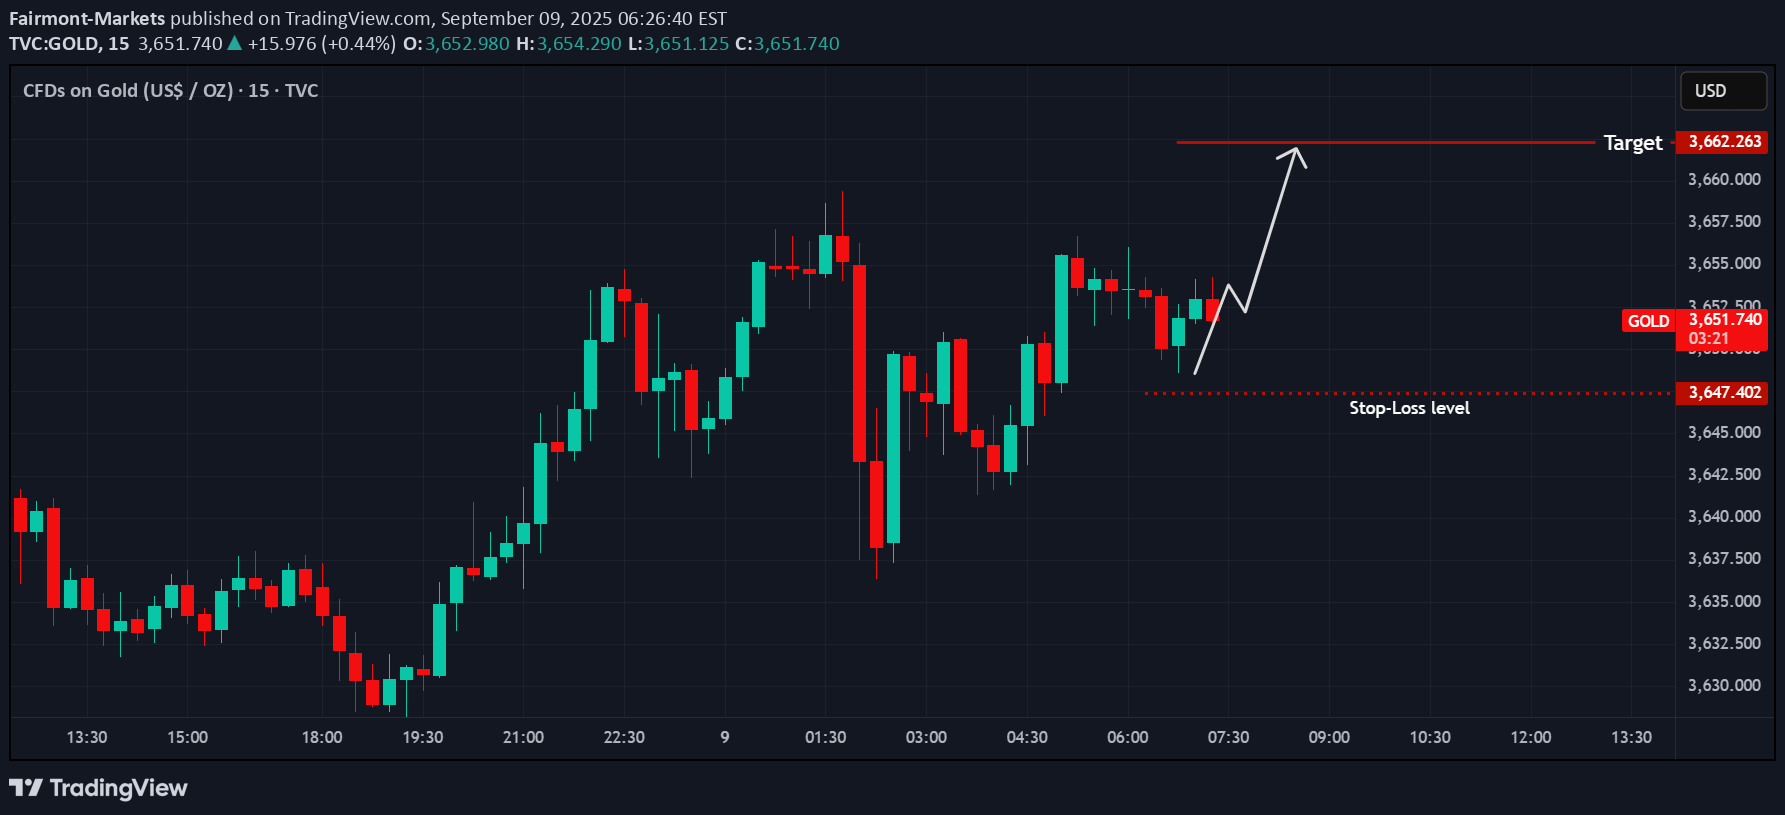
Price making a quick travel to the indicated price level on fractal structure. Previous emergence of the cyclic structure all saw price advancing to a measured value based on Fib sequences Buy trade safe Use valid stop order
Fairmont-Markets
A PICTURE IS WORTH A THOUSAND WORDS.
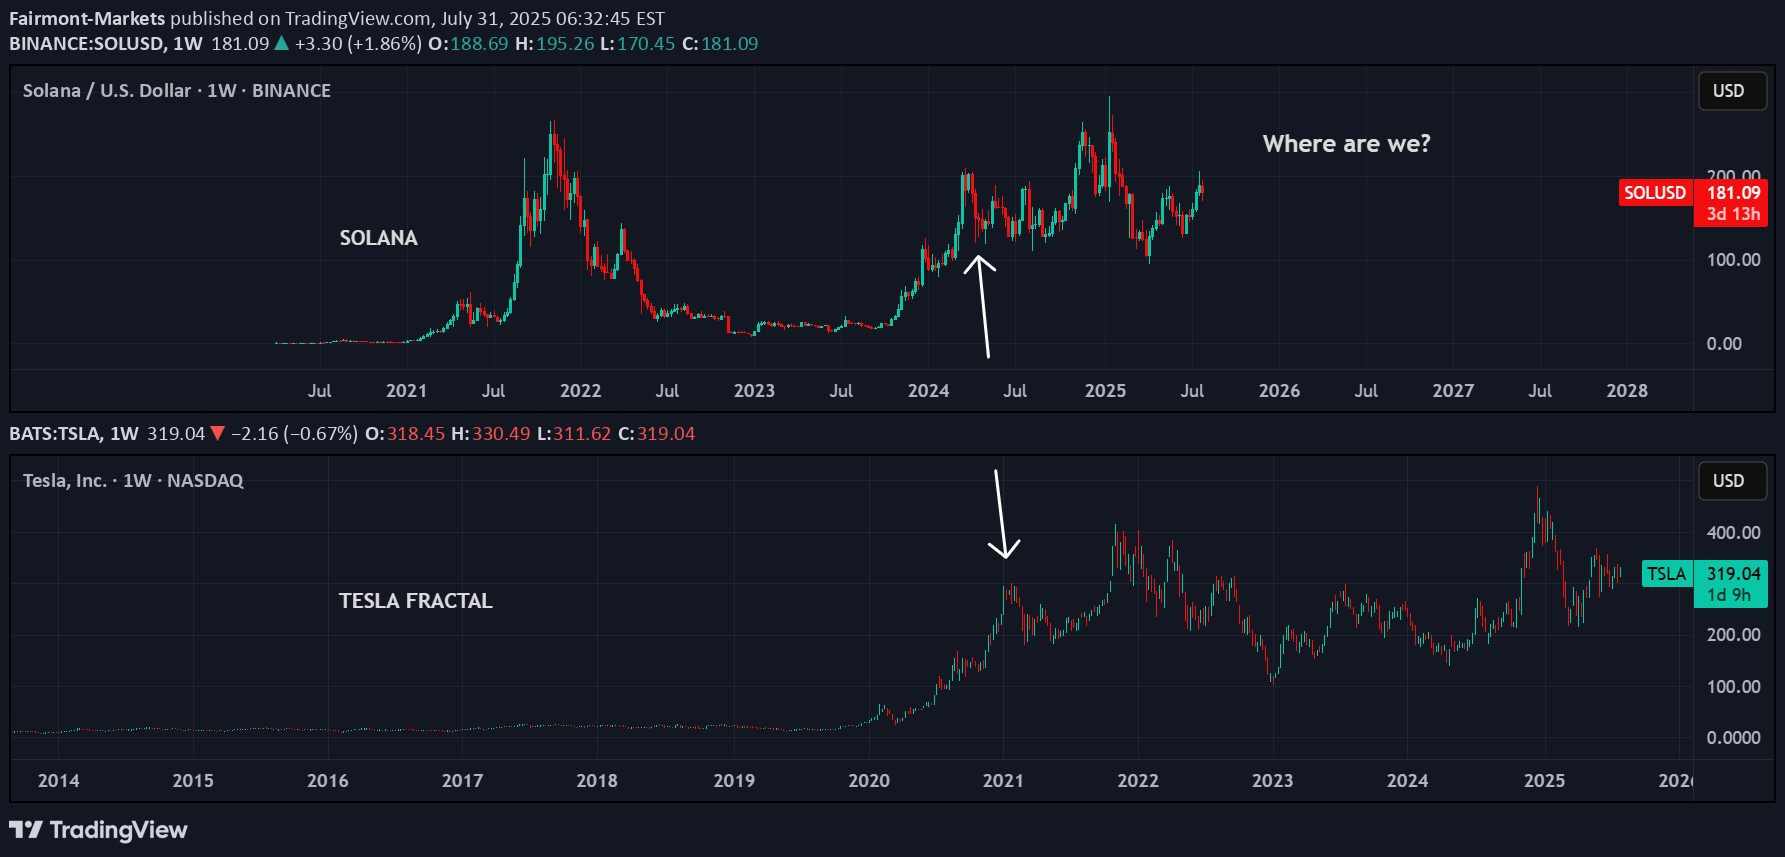
The two charts are only separated by name, both are working out a correlated fractal structure. The exact position of Solana compared to the Tesla fractal is much elusive. Two possible considerations of current structure in Solana fit equally into the past trend already completed by Tesla The two possible scenarios are indicated on the chart above, 1. If the 21st July 2025 top in Solana corresponds to the 4th April 2022 point on Tesla, the price action will favourably follow the white line. 2. If the 21st July 2025 top in Solana rather aligns with the 17th July 2022 point on Tesla, then price will likely make a minor correction and move higher as indicated by the gold line. Please note, the year dates below the lines are not to be considered, the lines are just for illustrations only. Also note that the extent of corrections or expansions in fractals are not necessarily the same, they only share similar structural forms. Trade safe, good luck
Fairmont-Markets
META's NEXT BOTTOM FOR THE CORRECTION (SHORT)
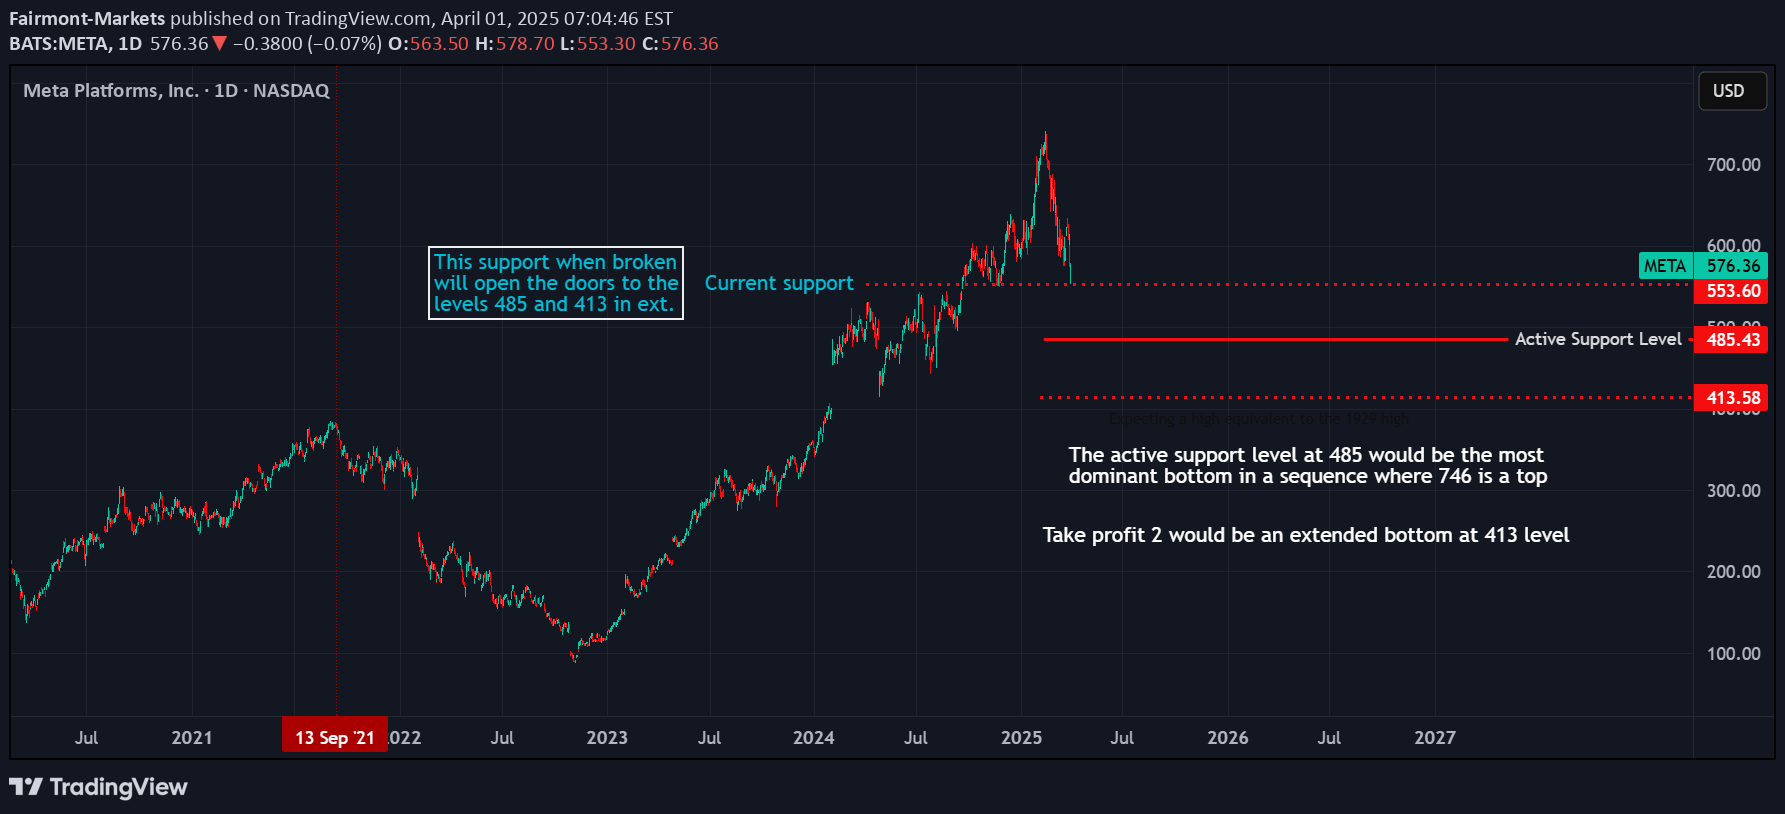
Meta target reached 746, the level in our previous post. The correction is currently in progress and by the numbers an aligning bottom within the growth sequence puts the bottom at 485 level. An extended bottom below 485 will see price bottoming at 413 or 385 levels. Trade safe
Fairmont-Markets
LONG
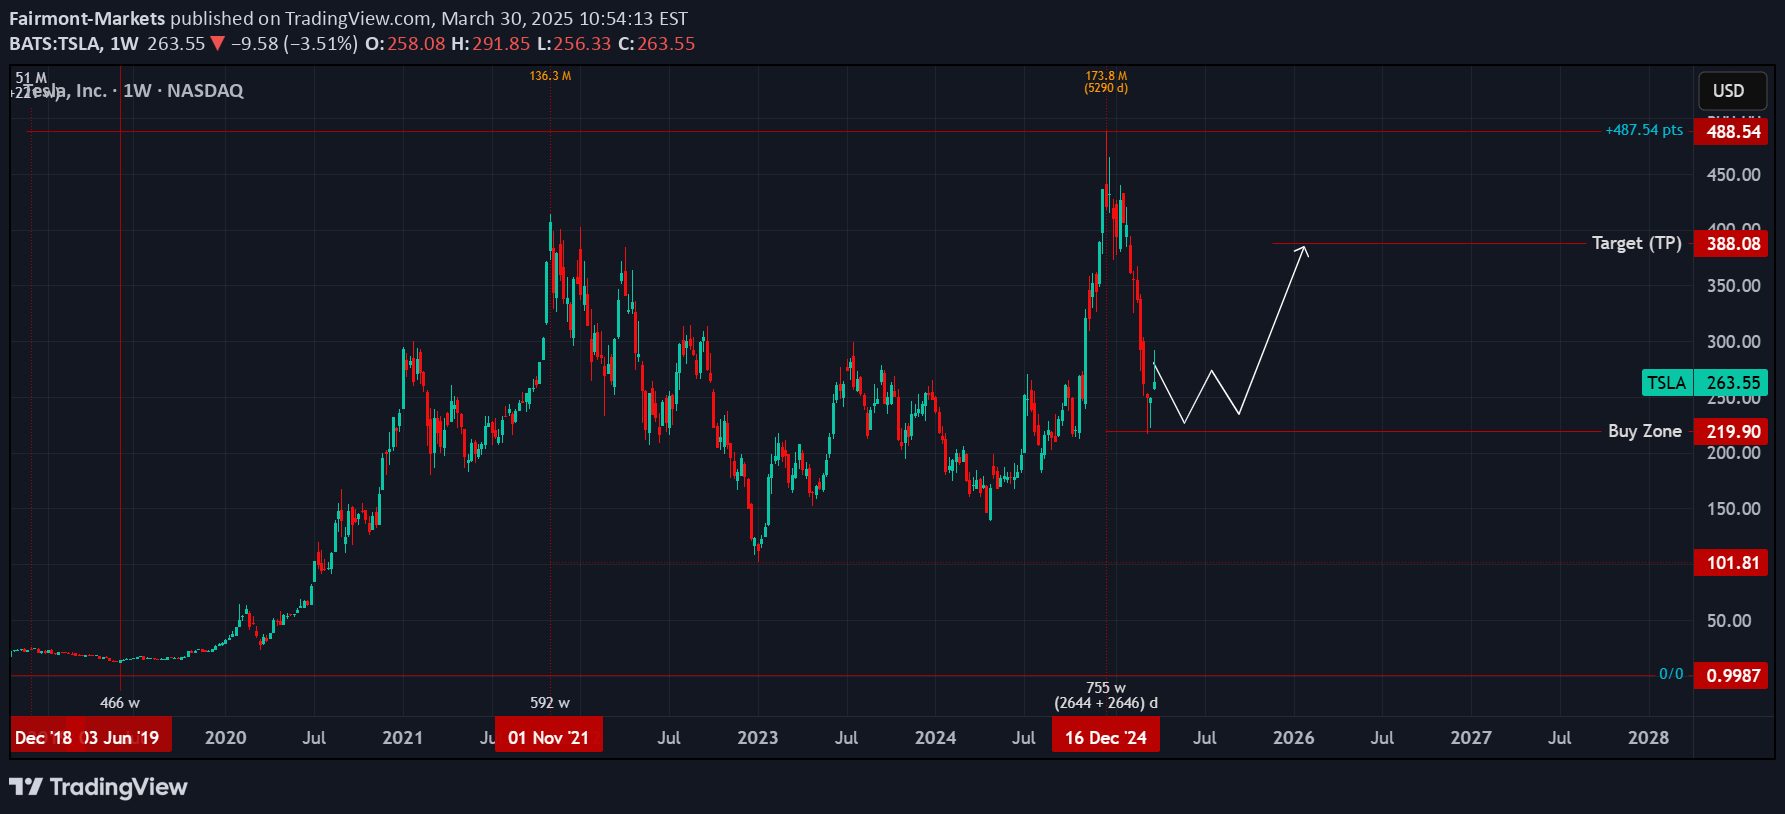
Tesla reached +487 points from the primary low, we made several publications about this level and what lies above and below it, the significance of this level and when they show up on time and price schedules. Below are some shots of this monster level We would take a tight long entries with targets at 385 price level. Manage risk responsibly
Fairmont-Markets
BUY AND HOLD UNTIL OCTOBER 2025
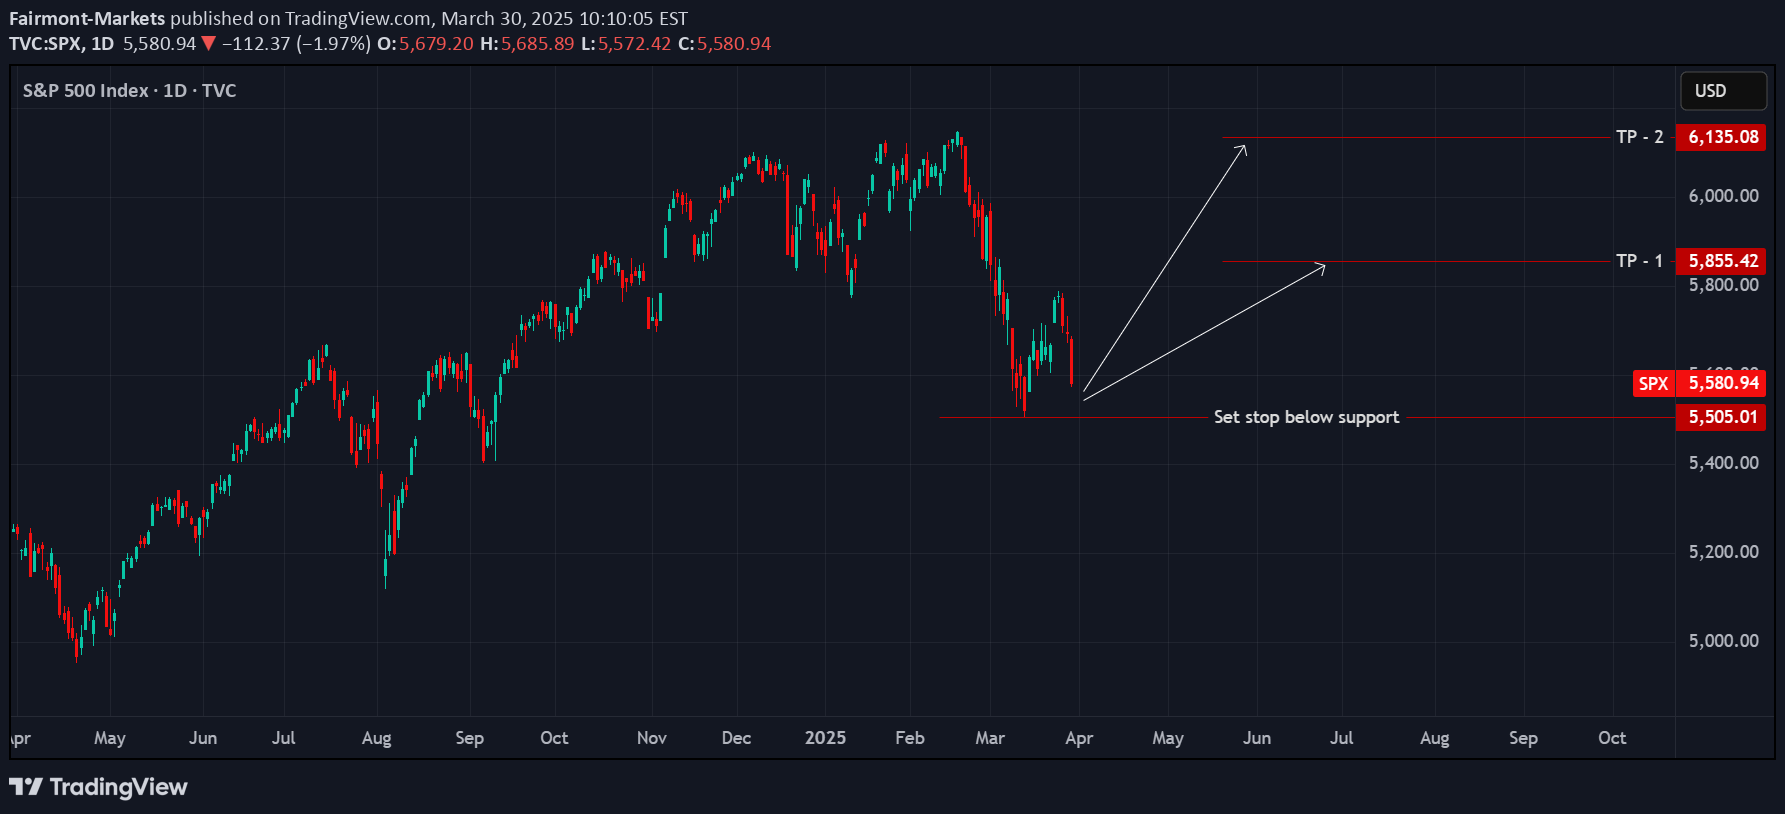
Price is scheduled to break above the current high for a 7-month run, price top is expected between 6588 and 6680 range for a steep correction. Tariffs and recession chants will have their day but history shows post war cycles never go south. Trade safe, good luckTarget reached
Fairmont-Markets
KEEP SHORTS FOR 50% CORRECTION
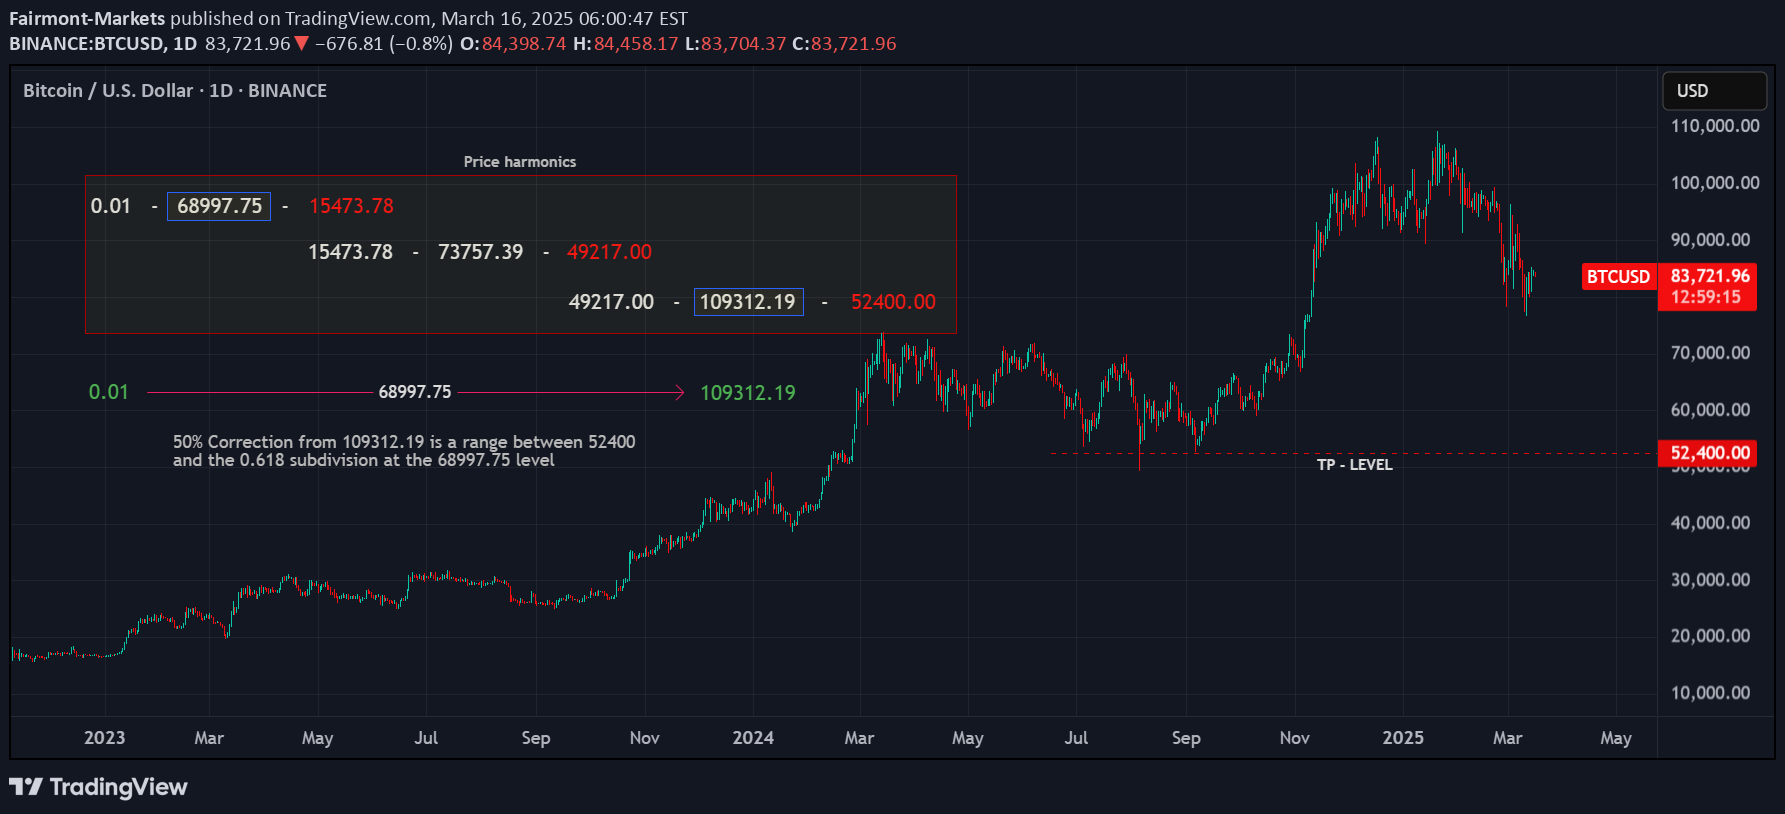
Price has been trading tops and bottoms within well defined harmonic forms.The third major top was at 68997.75+/- level and corrected to a bottom at 15473.78 on 21/11/2022. From the primary bottom on 05/10/2009 to this bottom we have a timeline 685 weeks forming the horizontal x-axis and price change +689.9775 the vertical y-axis.05/10/2009 - 21/11/2022 = 4795 days / 685 weeks / 157.5 monthsFrom this we have:Price: 0.00 - 68997.75 - 15473.78 (Price change = 689.9775 * 10) ptsTime: 05/10/2009 - 21/11/2022 (Time count = 685 weeks)This sets the pace for the expansion forms, price reached 73757.39 from 15473.78 and corrected again to 49217.00 on 05/08/2024, a price change of (+737.5739 * 10) from the primary low and 774 weeks time count. That gives a (737.5739 x 774) structure expanded from (689.9775 x 685).From 68997.75 which is the (1/Phi) level the next expansion would be a (+1087.00 +/-) pts of which price made a top at 109354.00. This would be the 1.0 or the (1 x 1) Gann square of price and time. Price has reached the 1.0 top, time made 798 weeks at this top. From a (1 x 1) Gann square which is usually the smallest expanded structure we would have a 50% decomposition which we expect price to reach at least the 52400.00 level if we break through the 68997k top.Since time is still lagging price by 208 weeks +/- it suggest two possible scenarios to consider.Check back as we make time projections and price levels to expect forward.Good luck, manage risks responsibly.
Fairmont-Markets
LONG FOR THE THIRD SWING UP

Price and time following a fractal from the pastTrade safe, good luck
Fairmont-Markets
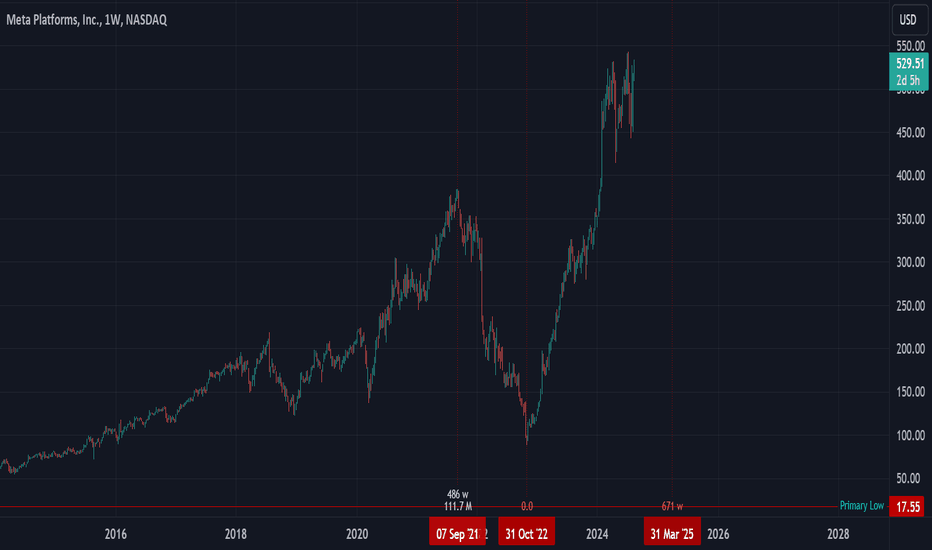
PRICE TOPPING OUT SOON (BETWEEN 628/686 LEVELS)
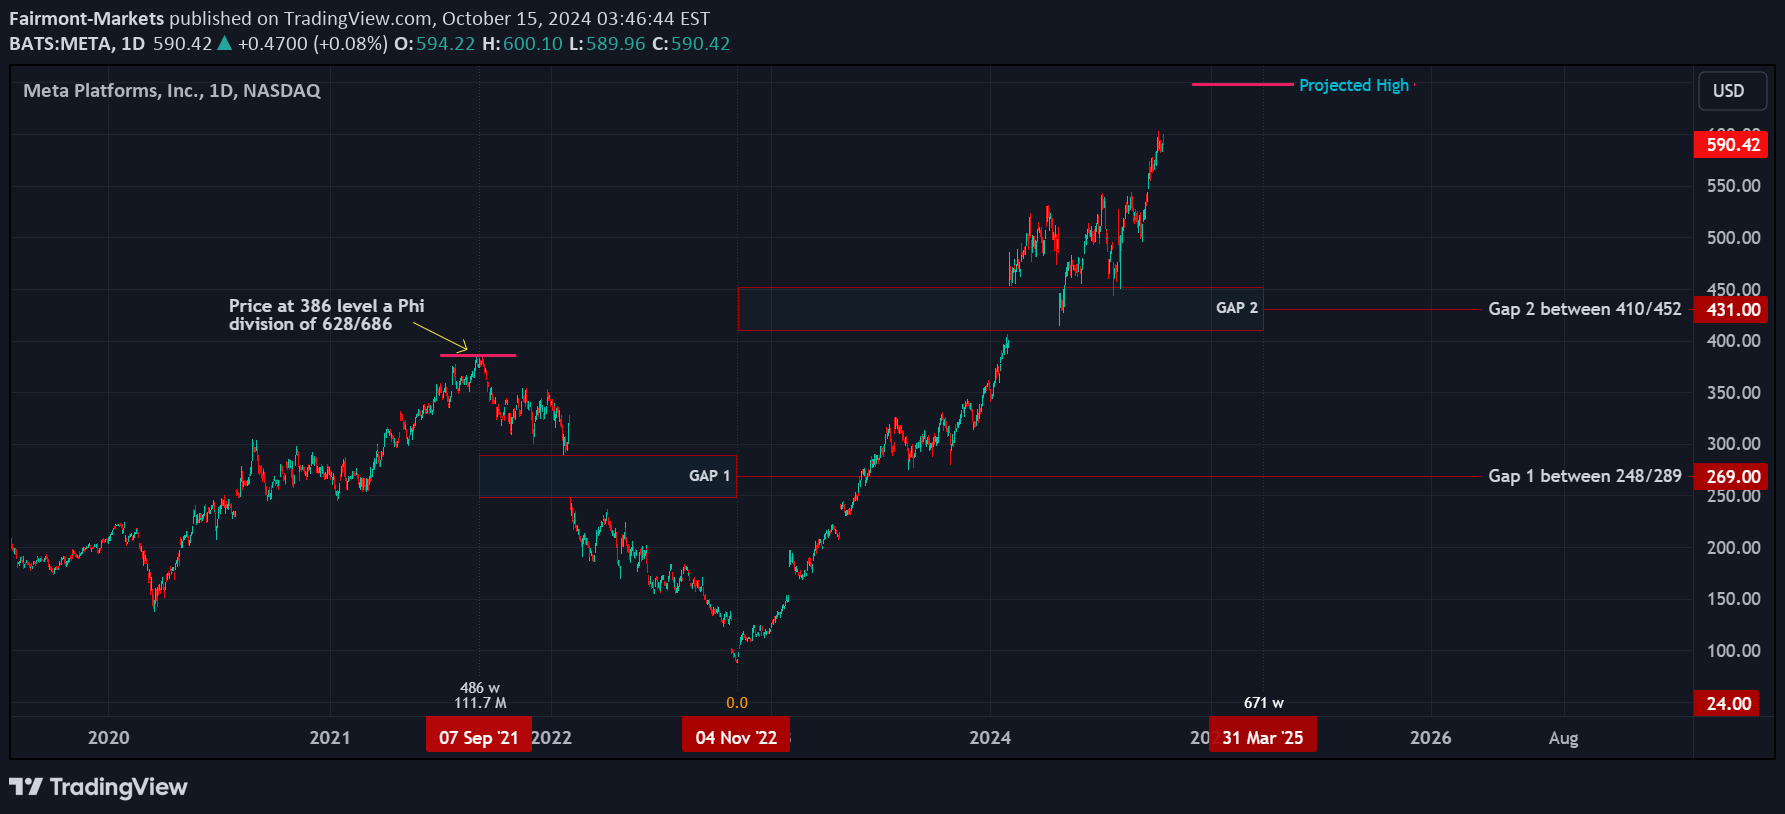
Price action has made two important gaps in the current bull campaign First gap occurred between 248 and 289 price levels Second gap between 410 and 452 levels The gap ranges give a clue of the expanding sequence and puts the next range between 628 and 686 levels preferably as a top. From the origin in May 2012 to the August 2021 high we made 486 weeks advance and 366.78 points between the primary low 17.55 and the high at 384.33. The data produces a time sequence ( 0 - 486 - 658/686 - 742/765) weeks as time markers Price sequence = (0 - +366/386 - +628/686) points. Currently price is reaching the 600 mark and time at 648 weeks, a convergence around the 658/686 sequence for both price and time. We expect price to top within this range for a multi-year correction. Trade safe, good luck
Fairmont-Markets
Disclaimer
Any content and materials included in Sahmeto's website and official communication channels are a compilation of personal opinions and analyses and are not binding. They do not constitute any recommendation for buying, selling, entering or exiting the stock market and cryptocurrency market. Also, all news and analyses included in the website and channels are merely republished information from official and unofficial domestic and foreign sources, and it is obvious that users of the said content are responsible for following up and ensuring the authenticity and accuracy of the materials. Therefore, while disclaiming responsibility, it is declared that the responsibility for any decision-making, action, and potential profit and loss in the capital market and cryptocurrency market lies with the trader.