
Export_Gold
@t_Export_Gold

What symbols does the trader recommend buying?
Purchase History
پیام های تریدر
Filter
Signal Type
Export_Gold
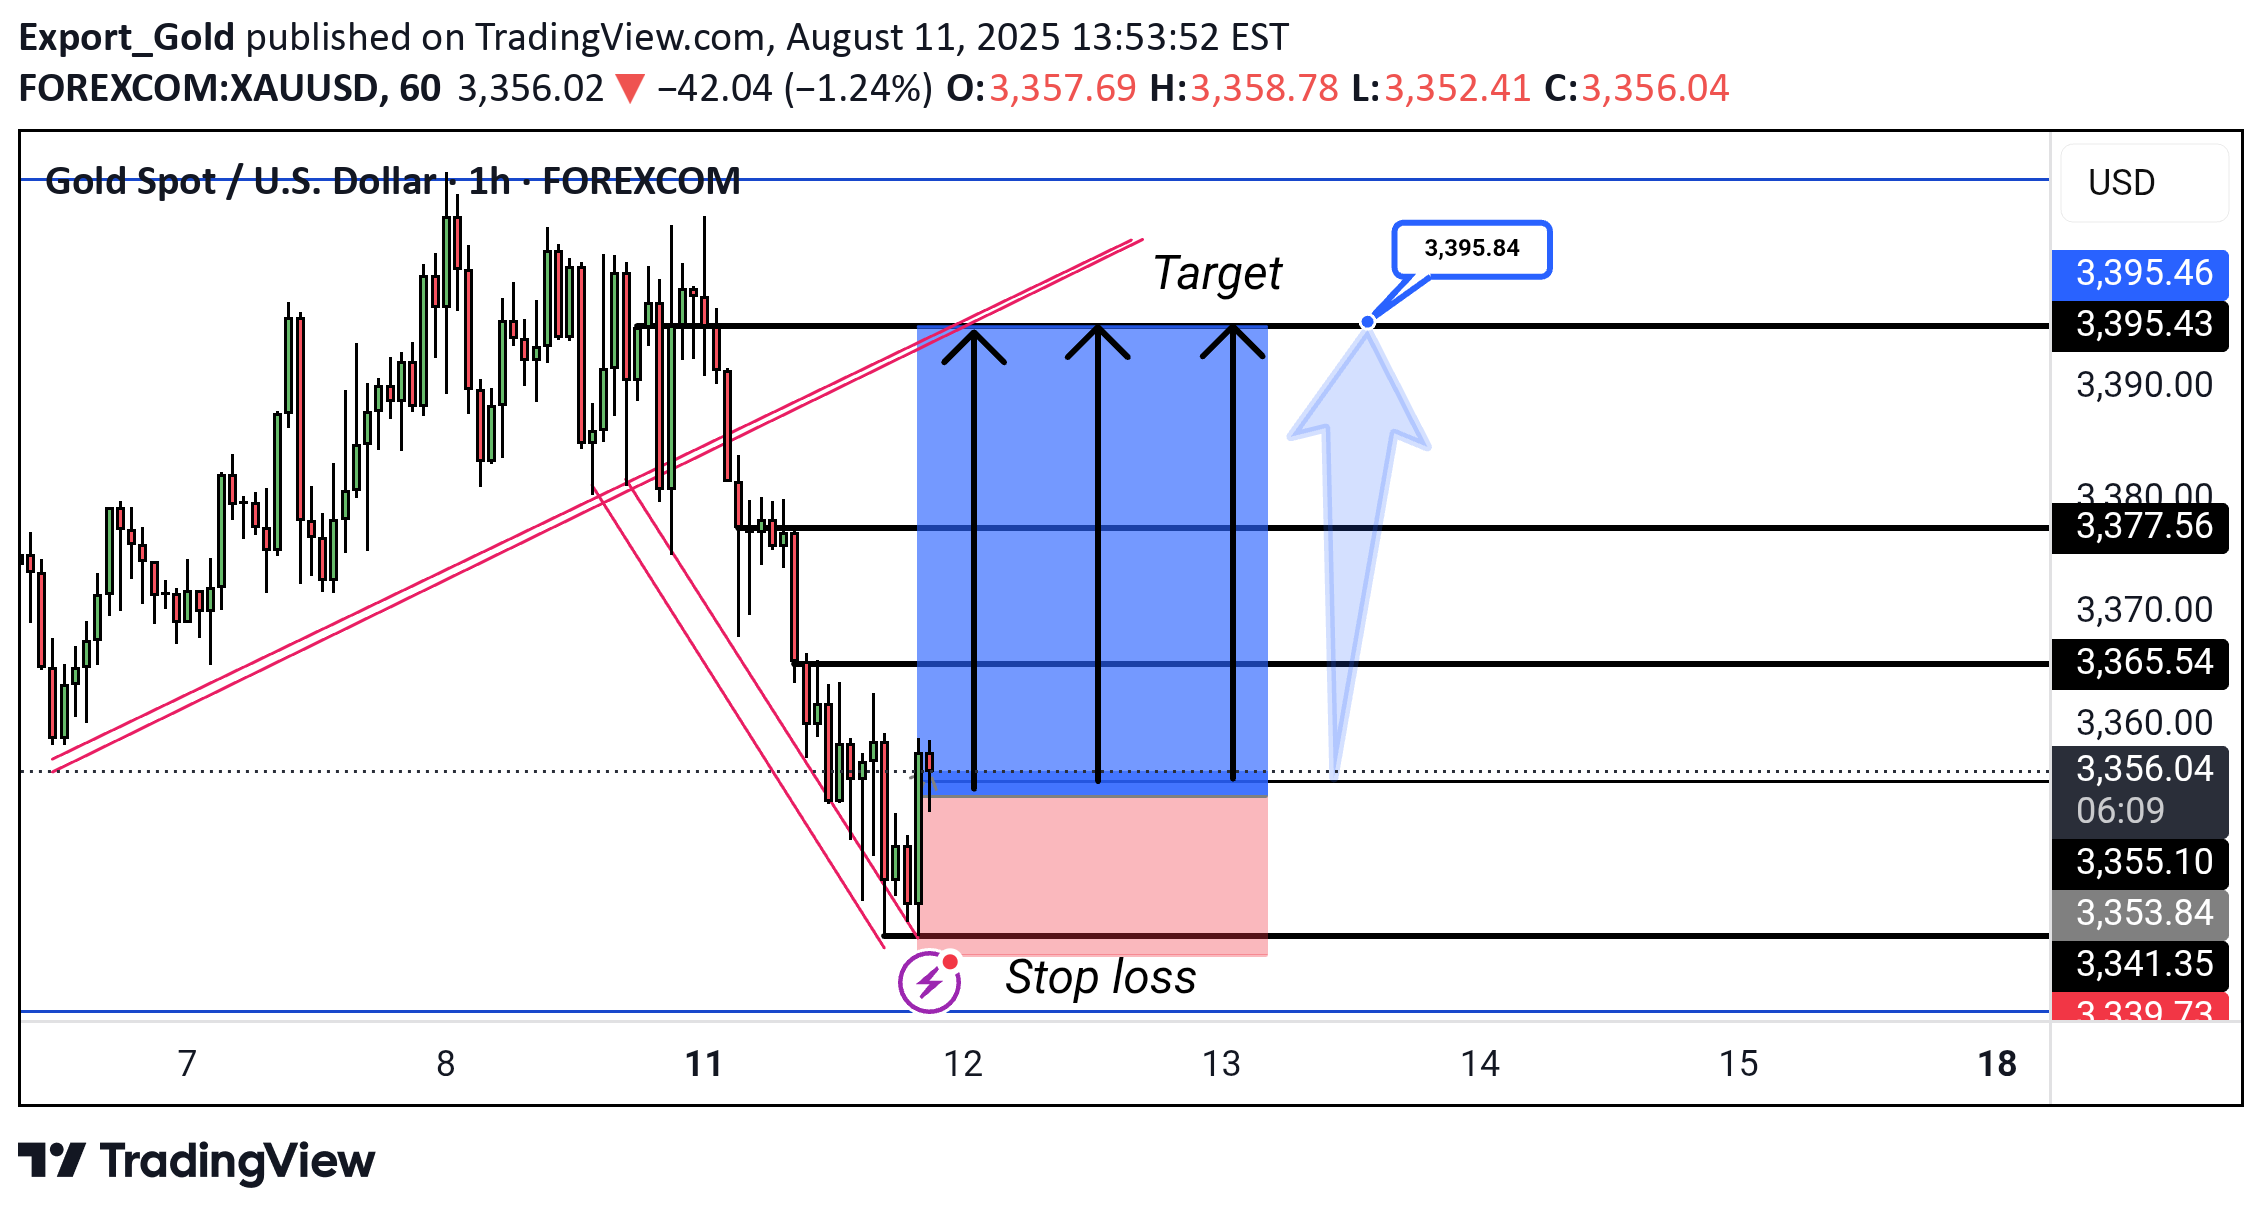
Gold (XAU/USD) is showing a potential bullish reversal from recent lows, with a target near 3,395 and stop loss set around 3,354. Key resistance levels lie at 3,365 and 3,377.
Export_Gold

Ethereum (ETH/USD) 1H chart shows a potential bearish move toward the 4,166 target, with resistance near 4,305 and stop loss above this level. Break below support could extend decline toward 4,100.
Export_Gold

SHIB/USD is consolidating near 0.00001360 support after a recent pullback, with bullish targets at 0.00001408–0.00001423 if the uptrend resumes.
Export_Gold

Ethereum (ETH/USD) is trading in an upward channel, approaching the $4,280–$4,295 resistance zone. Support is seen near $4,000, with a potential target above $4,500 if the breakout holds.
Export_Gold

Gold 4H Analysis: Price is consolidating near resistance at $3,377 and targeting the $3,410 level. Two potential bullish scenarios are outlined: a direct breakout or a pullback before continuation. Key support levels are at $3,360 and $3,341. Momentum remains bullish above the CHoCH zone.
Export_Gold

Gold (XAU/USD) 1H chart shows a bearish breakout from a consolidation zone. Price is expected to decline toward the target at 3351.23, with a stop loss set above resistance at 3395.10. Downward arrows suggest continuation of the bearish trend.Hold on
Export_Gold

BTC/USD 1H Analysis: Price is testing trendline support after a strong uptrend. A potential breakdown could lead to a drop towards the 113,583 target zone, as indicated by the blue arrow. Bears may take control if support fails.Target Hit successfully reached.
Export_Gold

Gold 1H Chart Analysis Price is showing potential for a bearish reversal from the resistance zone around 3,376. A possible double top pattern is forming, with a suggested short entry below the neckline. The target is set near 3,326, while the stop loss is placed just above the recent highs. A break below the ascending trendline could confirm the move.
Export_Gold

Ethereum (ETH/USD) 1H Analysis: Price is rising within an ascending channel but shows signs of potential reversal. A break below the channel support may lead to a drop toward the first target at 3,471 and second target at 3,379, with further downside possible toward 3,338 support zone.
Export_Gold

Gold 1H Chart: Price surged to resistance near 3365, facing potential reversal. Bearish arrows suggest a possible drop toward 3315–3280 support zone. Key levels: 3365 (resistance), 3315 (target).
Disclaimer
Any content and materials included in Sahmeto's website and official communication channels are a compilation of personal opinions and analyses and are not binding. They do not constitute any recommendation for buying, selling, entering or exiting the stock market and cryptocurrency market. Also, all news and analyses included in the website and channels are merely republished information from official and unofficial domestic and foreign sources, and it is obvious that users of the said content are responsible for following up and ensuring the authenticity and accuracy of the materials. Therefore, while disclaiming responsibility, it is declared that the responsibility for any decision-making, action, and potential profit and loss in the capital market and cryptocurrency market lies with the trader.