
Expert_Travis
@t_Expert_Travis
What symbols does the trader recommend buying?
Purchase History
پیام های تریدر
Filter
Signal Type

Expert_Travis
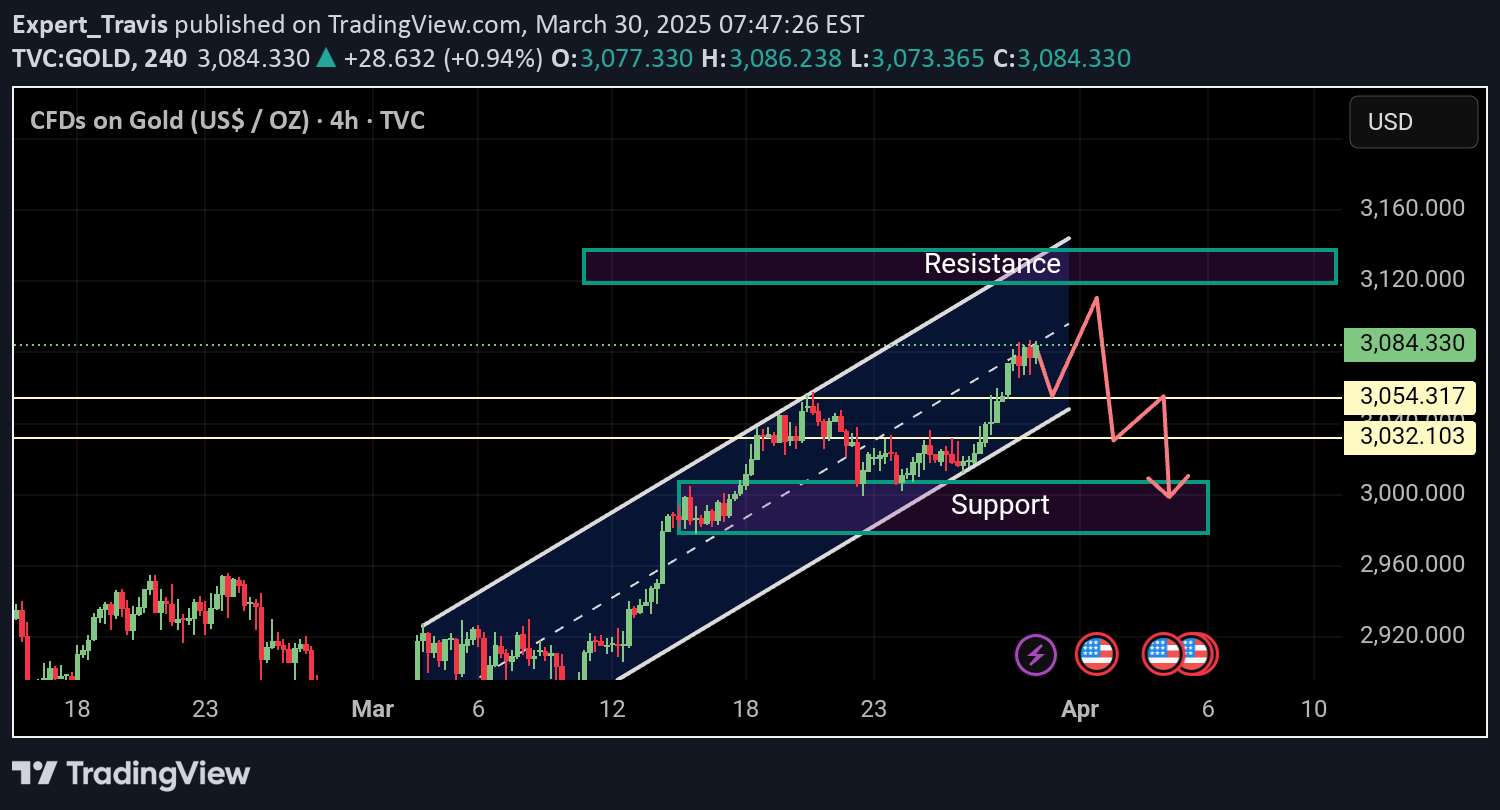
XAU/USD sell from 3084, here are the key levels to watch:- *Immediate Support*: 3054 and 3032- *Key Support*: 3000, a crucial level to maintain the bullish trend- *Stop-Loss (SL)*: 3110, to limit potential losses if the price moves against your positionFrom a technical perspective, the path of least resistance for the Gold price remains to the upside, driven by safe-haven demand amid global trade war tensions and a potential US economic slowdown. However, the Relative Strength Index (RSI) on the daily chart is already flashing overbought conditions, warranting some caution.The XAU/USD pair has been forming a correction within a descending channel, and the situation is becoming increasingly complex due to uncertainty around US tariff policies. Any corrective slide now seems to attract some dip-buyers near the $3,054-3,048 horizontal zone, which should help limit the downside for the Gold price near the $3,032-3,030 region.In terms of economic indicators, investors are waiting for the US Personal Consumption Expenditure (PCE) Price Index data to gauge the trajectory for further rate cuts, which will influence the USD price dynamics and provide a fresh impetus to the non-yielding yellow metal ¹.Keep your best wishes to the Travis 👍

Expert_Travis
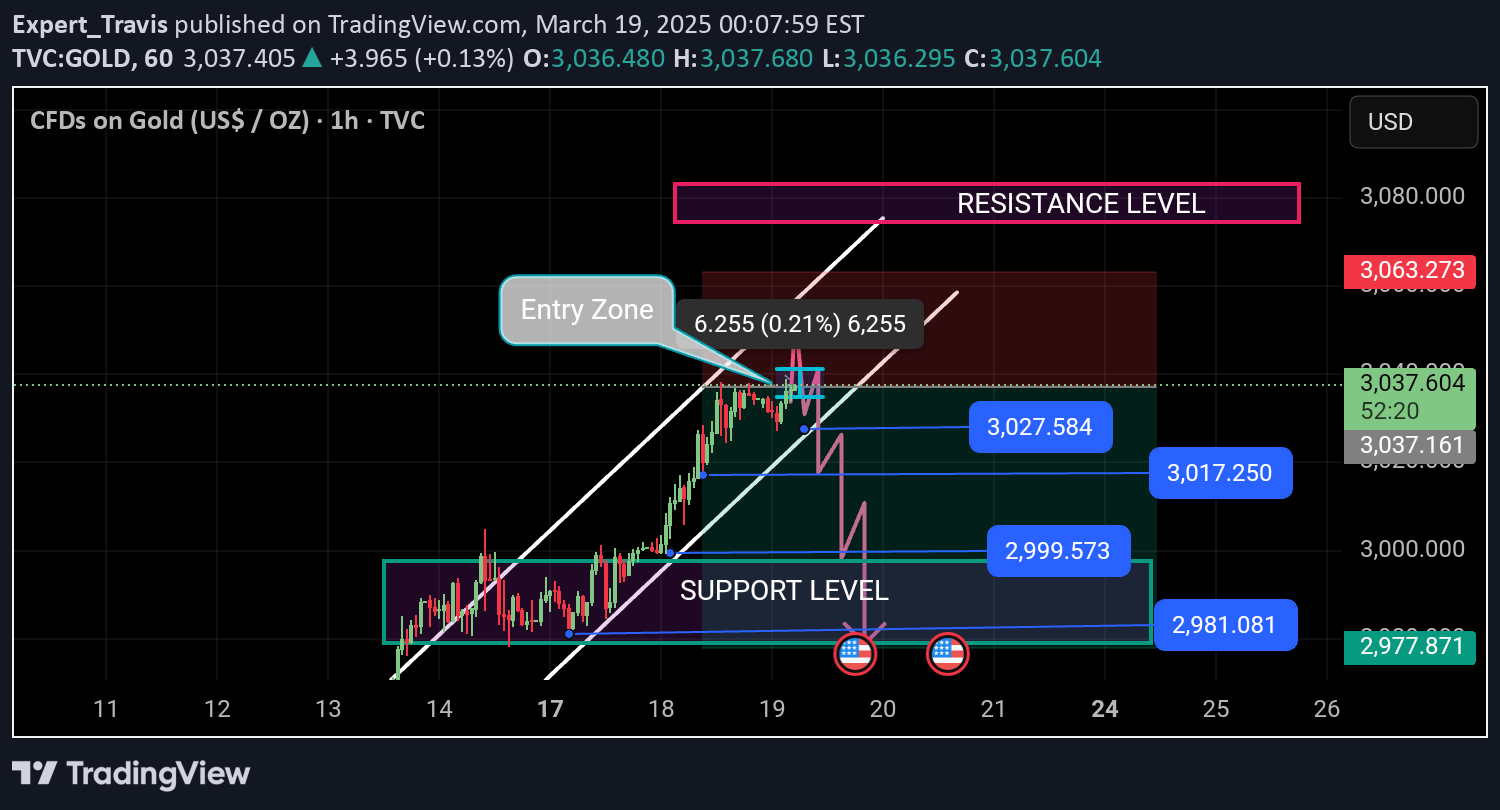
GOLD Sell ZoneA potential selling opportunity has been identified in Gold, with a sell entry between 3037 and 3040.*Sell Entry:* 3037 - 3040*Target Levels:*- _TP1: 3027_- _TP2: 3017_- _TP3: 3000_- _TP4: 2981_*Stop-Loss:* 3063*Reasons to Sell:*1. *Resistance Zone:* Gold has reached a strong resistance zone between 3037 and 3040.2. *Overbought Conditions:* Gold's RSI indicator is showing overbought conditions.3. *Potential Reversal:* A reversal in Gold's price could be imminent, given the recent rally.*Market Context:*Gold prices are consolidating after reaching a record high, with investors cautious ahead of the US Federal Reserve's monetary policy announcements. A hawkish decision could lead to a sharp correction in gold prices.*Federal Reserve Decision:*The Fed is widely expected to extend the pause to its interest-rate-cutting cycle in March. However, any hints of a further extension of the pause, or fewer rate cuts this year, could trigger a sharp correction in gold prices.*Geopolitical Tensions:*Persisting tensions, such as the Israel-Gaza conflict and Ukraine-Russia tensions, may cap any downside in gold prices.*Trading Strategy:*Sell Gold between 3037 and 3040, with a stop-loss at 3063. The TP levels can be used to take profits or adjust the stop-loss to break-even.Keep your best wishes to Travis 👍Our first tp hit guysOur 3rd tp is about to hit guys. Bearish is still on the way 🔥🔥🔥

Expert_Travis
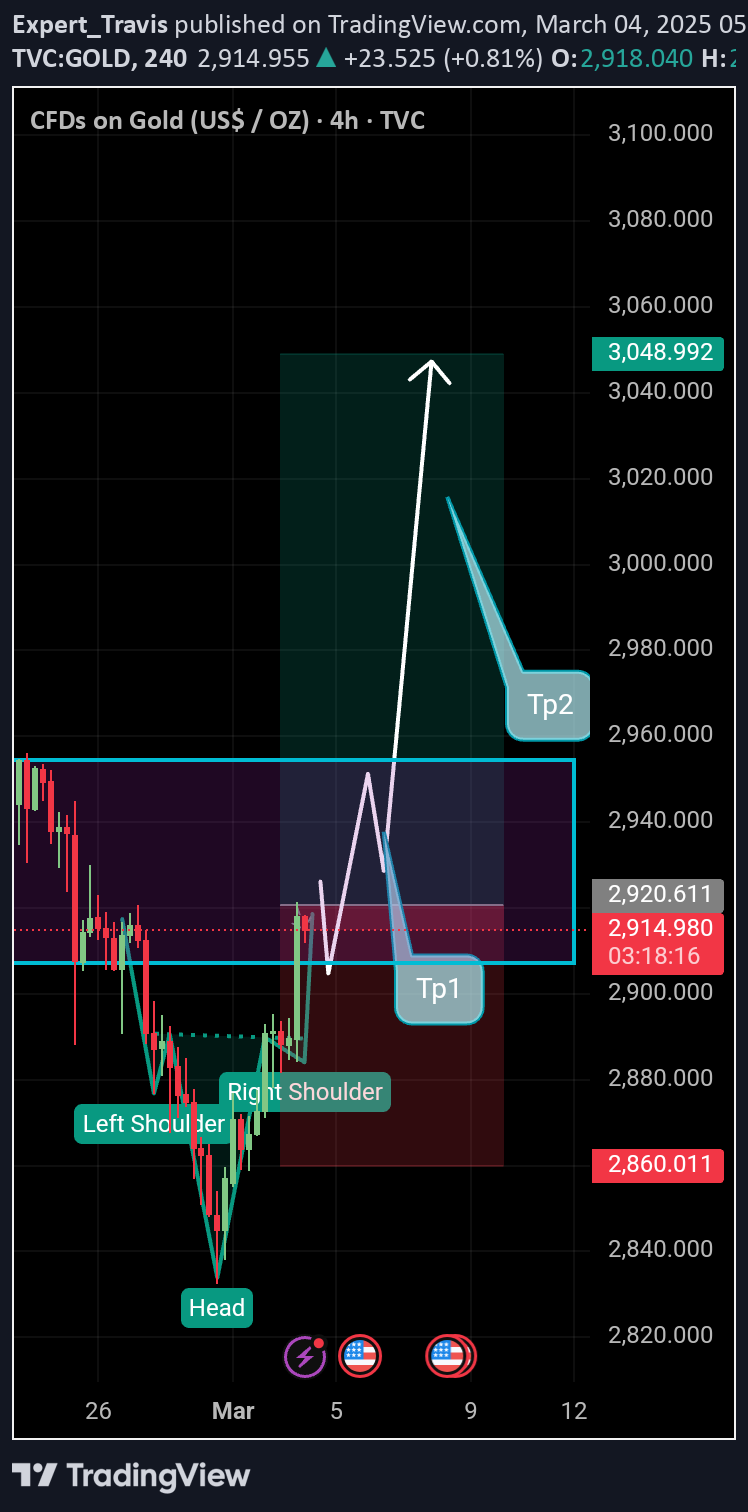
*$2920 Support Level:*The gold price has found support at the $2920 level, which is a crucial technical level. This level has acted as a strong support in the past, and a bounce from this level could indicate a further upward move.*Technical Analysis:*From a technical perspective, the $2920 level is:- *Confluence of Support:* The $2920 level is a confluence of support, where the 50-day and 100-day simple moving averages (SMAs) intersect. This makes it a strong support level.- *Trend Line Support:* The $2920 level is also a trend line support, where the gold price has bounced multiple times in the past.- *Oscillator Support:* The oscillators, such as the Relative Strength Index (RSI) and the Moving Average Convergence Divergence (MACD), are also showing signs of support at this level.*Potential Upward Move:*If the gold price bounces from the $2920 support level, it could indicate a further upward move. The potential targets for this move could be:- *$3000 Level:* The $3000 level is a strong resistance level, and a break above this level could indicate a bullish reversal.- *$3050 Level:* The $3050 level is another strong resistance level, and a break above this level could indicate a further upward move.- *Higher Highs:* If the gold price breaks above the $3050 level, it could indicate a trend reversal, and the price could make higher highs.Remember us in best wishes 👍

Expert_Travis
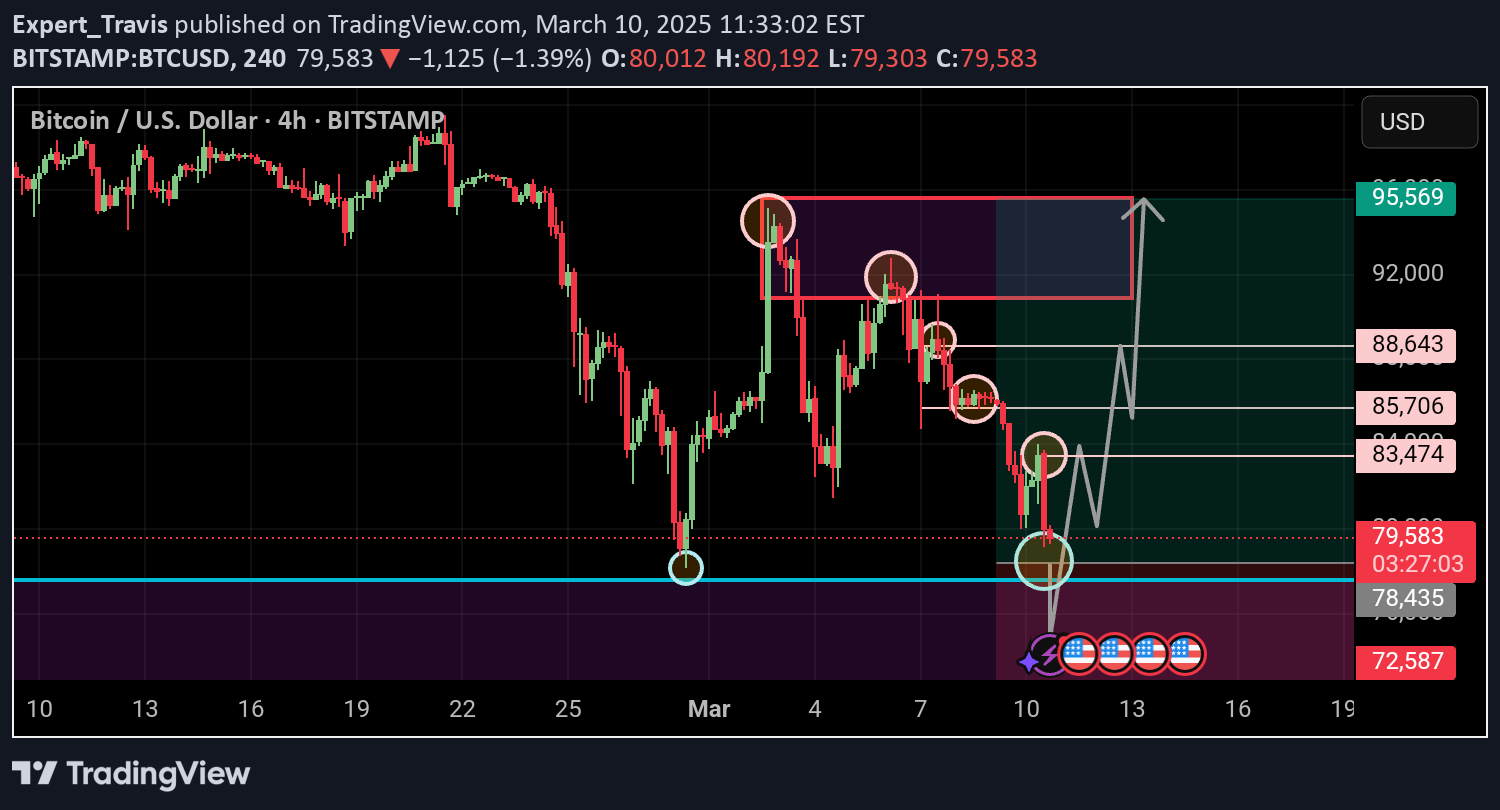
BTC/USD Buy Analysis From 78500 Zone:A potential buying opportunity has been identified in the BTC/USD pair, with a buy entry at 78,500. This level has been identified as a strong support level, where buyers may enter the market and push prices higher.Support Level: 78,500Target Levels:_TP1: 83,490__TP2: 85,700__TP3: 88,600__TP4: 91,000 - 95,500_ (a potential range for the pair to reach)Reasons for the Buy Opportunity:1. Technical Reversal:The BTC/USD pair has formed a technical reversal pattern, indicating a potential change in trend.2. Support Level:The 78,500 level has been identified as a strong support level, where buyers may enter the market and push prices higher.3. Momentum Indicators: The Relative Strength Index (RSI) and Moving Average Convergence Divergence (MACD) indicators are showing bullish signals, indicating a potential rise in prices.4. Fundamental Analysis:The BTC/USD pair has been influenced by positive news and developments in the cryptocurrency space, including increasing adoption and institutional investment.Evidence:1. Chart Patterns: The BTC/USD pair has formed a bullish chart pattern, indicating a potential rise in prices.2. Candlestick Analysis: The pair has formed a bullish candlestick pattern, indicating a potential change in trend.3. Technical Indicators: The pair's technical indicators, including the RSI and MACD, are showing bullish signals.Trading Strategy:Buyers may look to enter the market at the support level of 78,500, with a stop-loss below 72,5000. The TP levels can be used to take profits, or to adjust the stop-loss to break-even.Remember me with best wishes👍. Travis

Expert_Travis
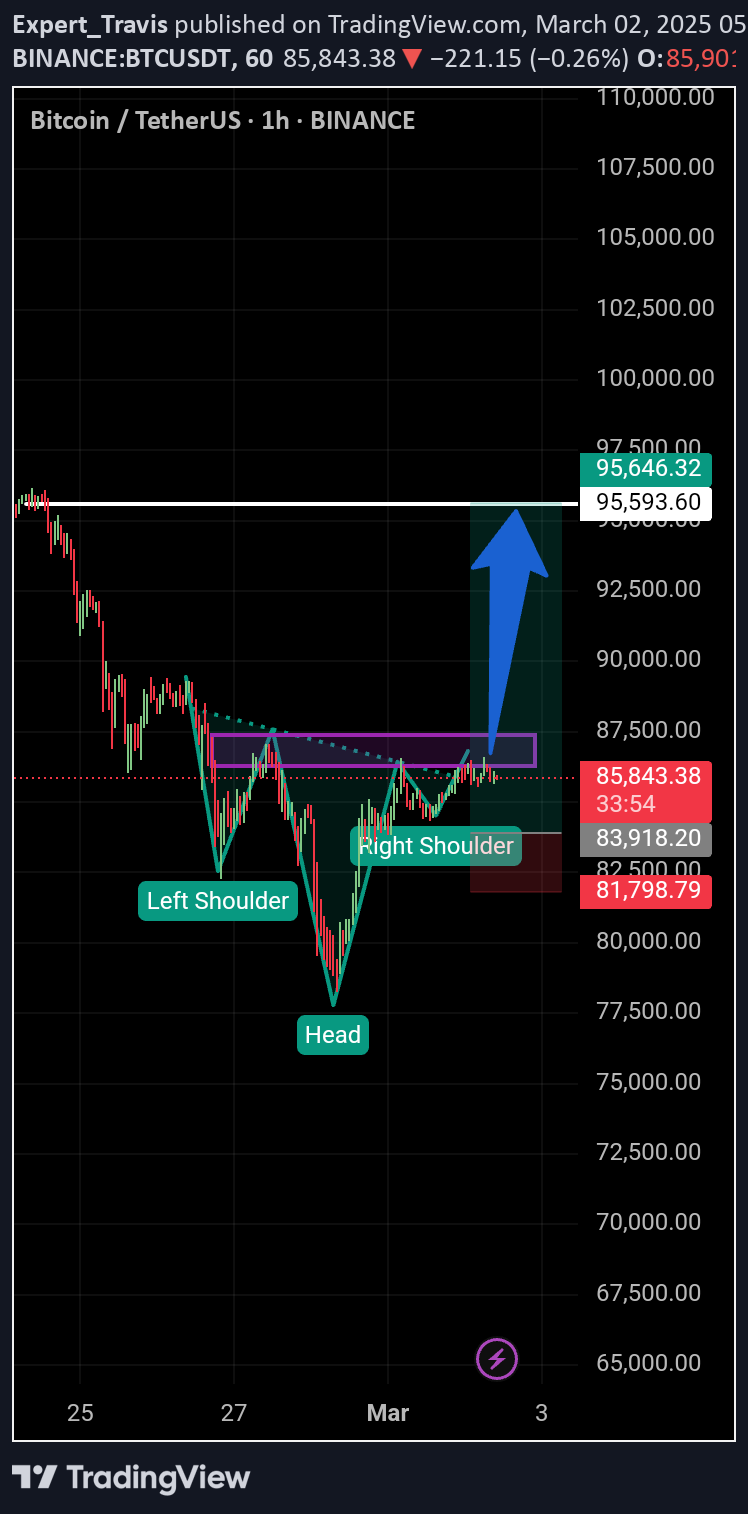
BTCUSD is poised for a significant rebound after yesterday's pullback from $87,055. The current price of $80,474 represents a 50% Fibonacci correction level of the $52,600-$108,350 rise, providing a strong foundation for a bullish reversal.Key points:- The recent downturn has created a buying opportunity, with a potential target of $95,000.- The $80,474 level serves as a crucial support, with a bounce expected to propel prices higher.- The 50% Fibonacci correction level indicates a likely reversal, as the market seeks to retest recent highs.- Bullish momentum is building, with a potential breakout above $87,055 paving the way for a rally to $95,000.- Traders should be prepared to buy, as the current setup favors a significant upside move.Best regards Travis ❤️Trade close:Target reached💯💯

Expert_Travis
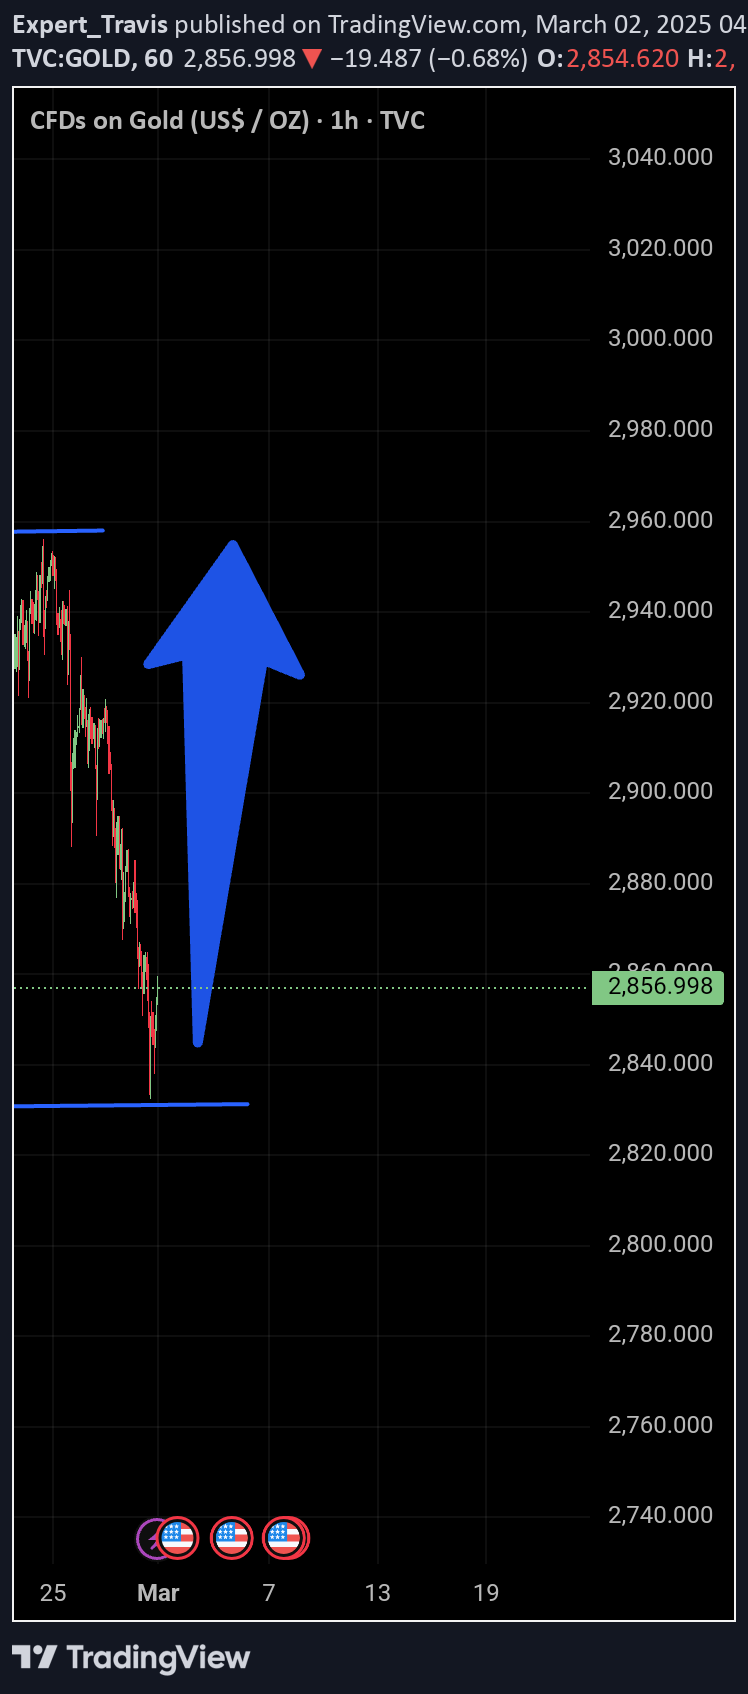
Gold Bulls Rejoice: Price Correction Presents Buying OpportunityAfter a near 3% pullback this week, Gold's price (XAU/USD) is poised to rebound, driven by robust fundamentals and a weakening US dollar. The precious metal's correction presents a buying opportunity for investors seeking to capitalize on the ongoing tariff tensions and growing demand for safe-haven assets.Key Levels to Watch:- Support: $2,790 (strong demand zone), $2,835 (moderate support), and $2,856 (minor support)- Resistance: $2,888 (daily Pivot Point), $2,909 (daily R1), and $2,941 (daily R2)Market Sentiment:The daily digest market movers indicate a risk-on mood, with investors seeking safe-haven assets like Gold. The CME Fedwatch Tool shows increasing odds of a June rate cut, which could further boost Gold prices.Growing Demand:Gold ETFs are seeing significant inflows, with onshore fund holdings increasing by 17.7 tons in the first three weeks of February. This growing demand, combined with ongoing geopolitical tensions, sets the stage for a potential breakout above $3,000.What's Next?Our experts predict a strong rebound in Gold prices, driven by the confluence of technical and fundamental factors. Stay tuned for our weekly XAU/USD forecasts, where we provide insights into the next possible moves of the gold-dollar pair.Best regards Travis ❤️
Disclaimer
Any content and materials included in Sahmeto's website and official communication channels are a compilation of personal opinions and analyses and are not binding. They do not constitute any recommendation for buying, selling, entering or exiting the stock market and cryptocurrency market. Also, all news and analyses included in the website and channels are merely republished information from official and unofficial domestic and foreign sources, and it is obvious that users of the said content are responsible for following up and ensuring the authenticity and accuracy of the materials. Therefore, while disclaiming responsibility, it is declared that the responsibility for any decision-making, action, and potential profit and loss in the capital market and cryptocurrency market lies with the trader.