
ElliotXSolana
@t_ElliotXSolana

What symbols does the trader recommend buying?
Purchase History
پیام های تریدر
Filter
ElliotXSolana
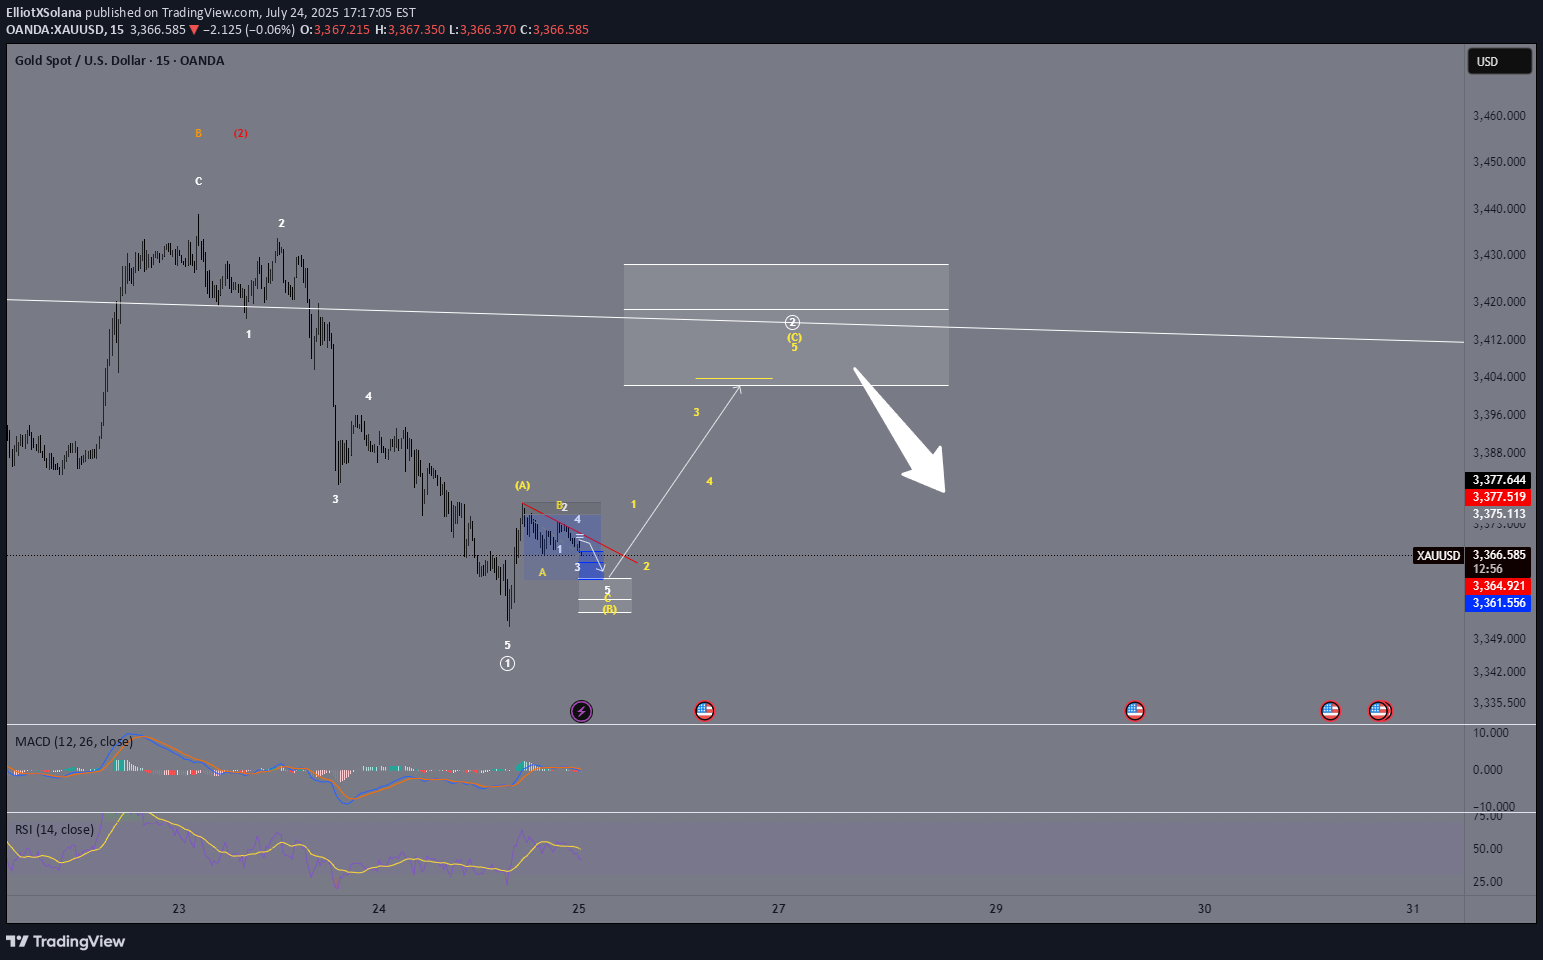
XAU/USD – Bearish Momentum Building: Circle 2 Top In?
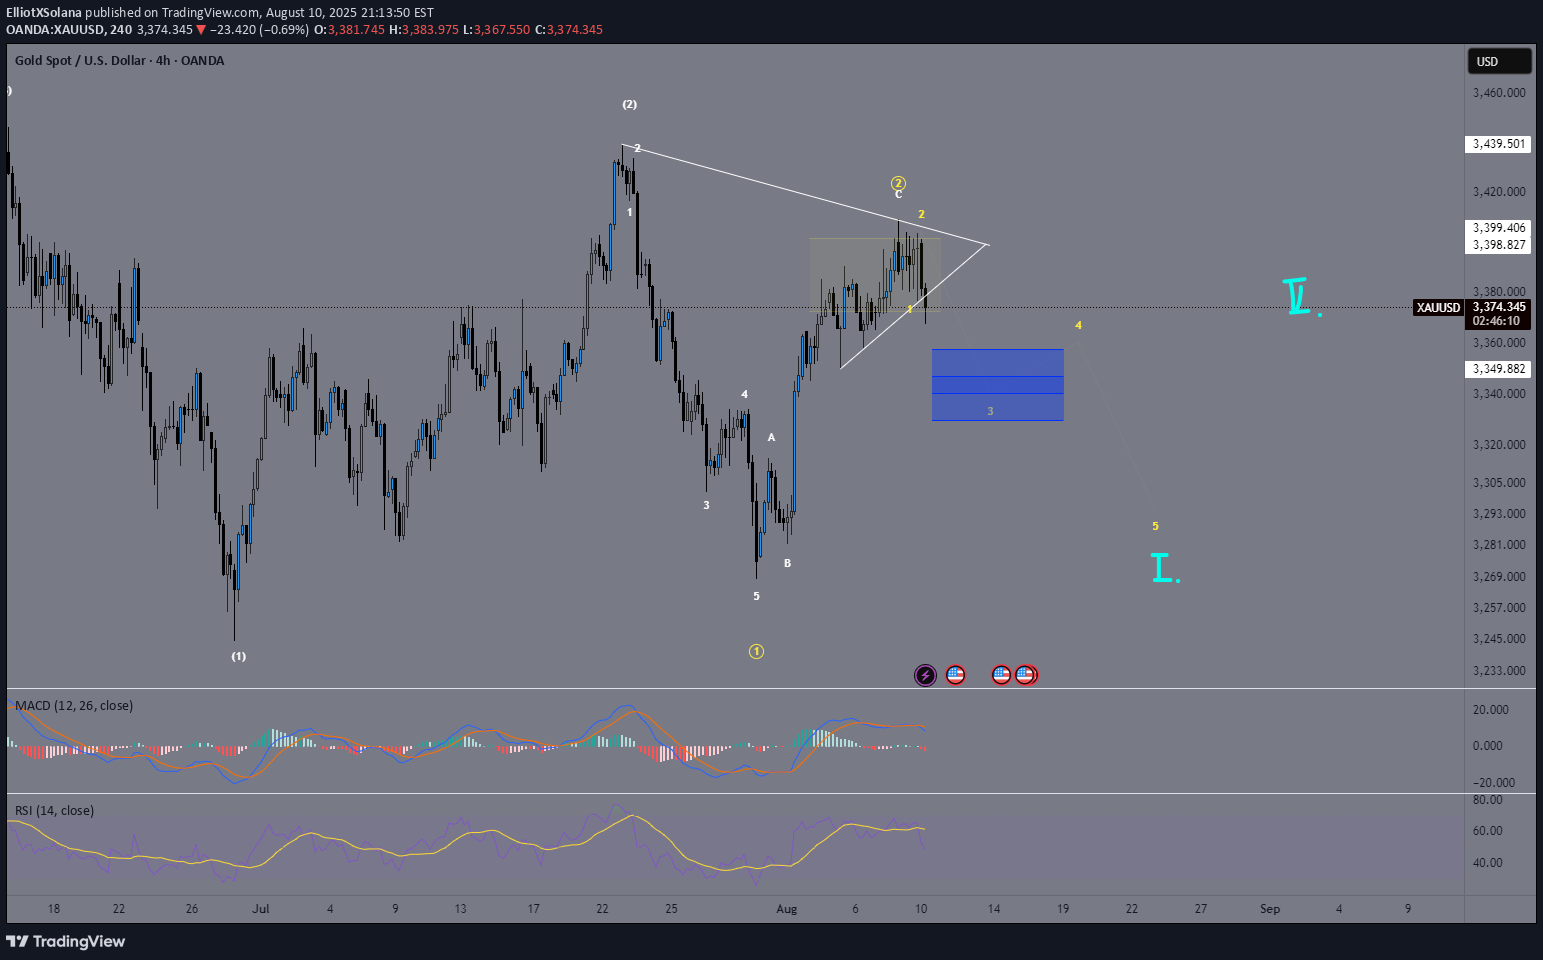
XAUUSD We have now completed a 1-2-3-4-5 move to the downside (in white), followed by a counter-correction in the form of an A-B-C. This may have already completed our yellow (Circle) Wave 2 🟡 — though it’s not confirmed just yet. We still have two potential resistance levels at 3400 and 3418 that could serve as final topping points for Circle 2. Today, we can also observe a break of structure with the white trendline being broken, adding further confirmation to the bearish outlook 🔻. I am now tracking my 1-2-3-4-5 structure in yellow, which should unfold into Circle Wave 3 🟡. Bias remains bearish, and I expect this move to develop in line with the yellow projection already shown on my chart. If price breaks decisively above our Fibonacci resistance, the alternative scenario would be an ABCDE triangle formation that has potentially been forming over the past months — in that case, I’ll post a dedicated update 📌. For now, I’m actively looking for sell setups and have already entered short positions ✅.4 positions already made sl above the last high. For more informations about my entrys look my last idea posts. :)
ElliotXSolana
XAU/USD – Bearish Momentum Building: Circle 2 Top In?
XAUUSD We have now completed a 1-2-3-4-5 structure to the downside (in white). Following that, we got a counter-correction in the form of an A-B-C, which potentially marks the completion of our yellow (Circle) Wave 2 🟡. However, it’s not confirmed just yet — we still have two additional Fibonacci levels at 3400 and 3418, which could act as resistance zones and final topping areas for Circle 2. We are now anticipating a 1-2-3-4-5 impulse into Circle 3, as already illustrated in yellow 🟡. So at the moment, bias remains bearish 🔻. Should we break above the Fibonacci levels mentioned, I do have an alternative scenario in mind — an ABCDE triangle formation that may have developed over the past months. If that becomes relevant, I’ll make a separate upload for it 📌. For now, I'm actively looking for sell positions, and I’ve already entered shorts ✅.
ElliotXSolana
XAU/USD – Endphase der Circle Wave 1 & Vorbereitung auf die Korr
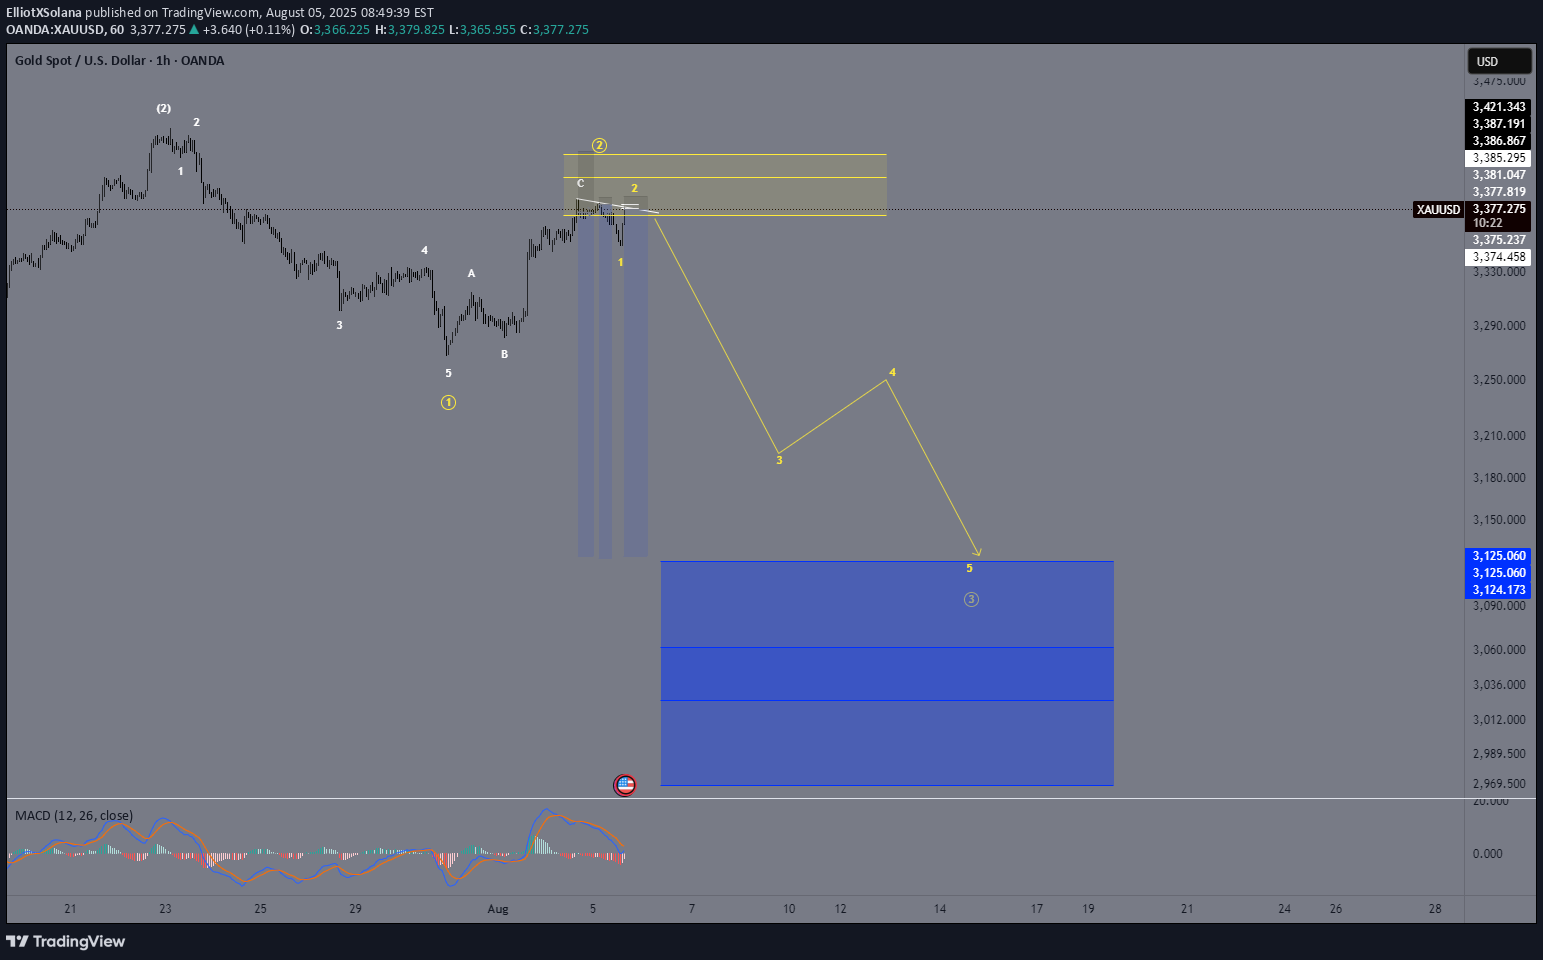
XAUUSD We are currently in the final stages of the yellow (Circle) Wave 1 on Gold. We have just completed wave 4. How do I identify wave 4? Simple: 📏 I drew a trendline, and once that trendline was broken, the trend of wave 3 was considered complete. However, we’ve now made a new low, which broke the low of wave 3 — this could very well be our wave A of wave 4 ⚠️. I’m expecting one more final low, potentially around 3252, or even as low as 3200. But personally, I lean towards ~3252 as the likely target 🎯. After that, we should see a move upward into the yellow Fibonacci zone of wave 2 🟡. The path from Circle 1 to Circle 2 will likely unfold as a corrective A-B-C structure to the upside 🔁. Following that, we hopefully get a clean five-wave impulse into our (Circle) Wave 3 🚀.
ElliotXSolana
XAU/USD – Current Wave Count & Potential Scenarios
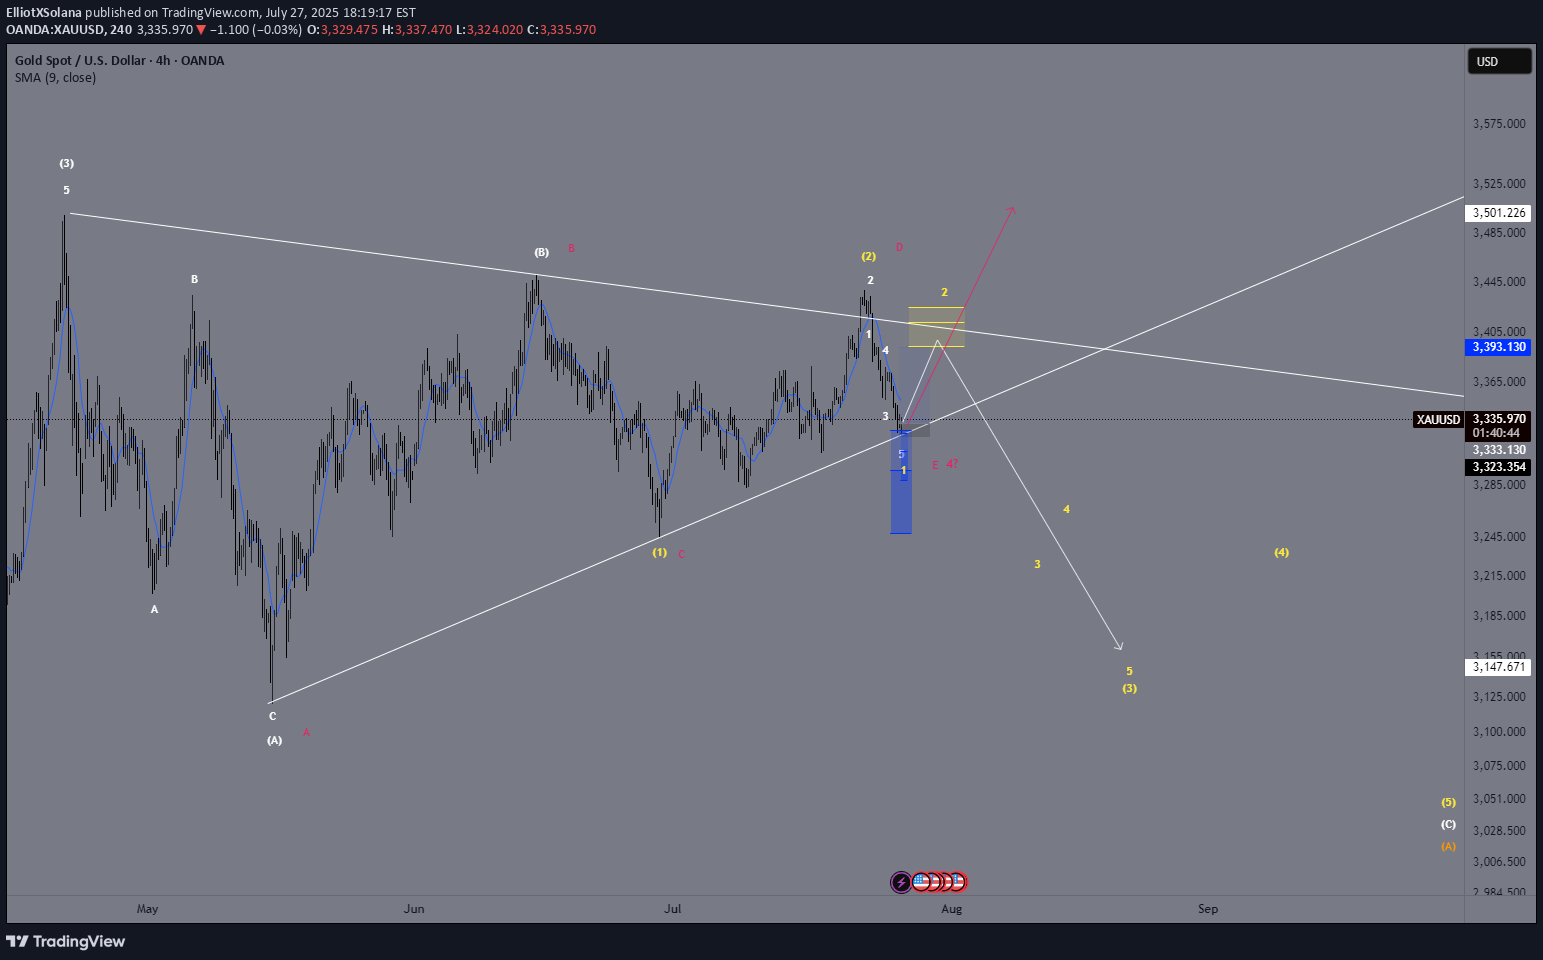
XAUUSD We are currently moving from (white) wave 3 to (white) wave 4. So far, I am leaning towards the white count where the waves labeled (A), (B), (C) form a larger corrective wave A, which leads to wave B, and then to (white) wave 4. Up to now, we have only completed (A) and (B). Now, in the yellow bracket, we can interpret a 1-2-3-4-5 structure leading to (white) wave C 🟡. Alternatively, one could interpret a triangle pattern (pink count): Waves A, B, C, D, E, which would then form our wave 4. In that case, we would expect bullish targets afterwards 🚀. We need to watch closely if the price reverses or breaks through our yellow Fibonacci zone 🟡. For now, we are primarily looking for upside potential 🔼. From our yellow wave 2, we saw a downward push, which could theoretically be our yellow wave 1 leading into yellow wave 2 and the yellow Fibonacci zone — essentially a five-wave move from wave 2 to wave 3.buy position already running. For conformation I would wait to make the first a in the abc correction to wave yellow 2Sl hit. the one still is not inished we need to se a 12345 wave to the upside to identiy our wave one low
ElliotXSolana
XAU/USD – Elliott Wave Update | Wave (2) in Progress)
XAUUSD 🔍 Wave Structure Overview We’re currently in a [identify the wave: e.g. blue wave (2), orange wave B, red wave 2] Prior impulse (likely 1-2-3-4-5) completed, forming (Circle) wave ① Current correction unfolding as (A)-(B)-(C) in yellow ↳ Presently in wave (A) or transitioning into (B) ↳ Within (B), structure is forming as A-B-C ↳ Currently tracking 5-wave move from 4 to 5 📐 Fibonacci & Key Levels Watching 61.8% retracement as a critical support zone ✅ This level also marks a high-probability TP area for short positions Strong confluence: 🔹 Fibonacci retracement 🔹 Extension alignment (e.g. yellow fib extension to ~4403) 🔹 Trendline reaction expected 🧠 Trade Setup (Scenario-Based) 🔸 Scenario A – Early Entry: Enter small long near 61.8% Fib zone SL: Below last swing low TP: To be refined once C-wave completes 🔸 Scenario B – Confirmation Entry: Wait for break above red trendline Add position SL below Fib zone low TP around Fibonacci extension / structure resistance (~4403) ⚠️ Key Considerations Many positions will close in this zone → increase in selling pressure Possible reversal zone → watch for confirmation (impulse or ABC) Once wave (C) completes, we’ll likely see entry into a larger bearish move 📎 Conclusion This is a high-probability reversal zone, supported by Elliott structure and Fib levels. I’m planning to scale in based on price action and confirmation. 📈 Stay flexible, manage risk, and watch the structure evolve.
ElliotXSolana
XAU/USD – Wave 2 Breakout Confirmed | Tracking the Impulse
XAUUSD We’ve now seen the first bullish push out of the blue (2) Fibonacci zone. This allows us to start tracking a potential blue (1)-(2) structure, setting the stage for an impulsive move into blue (3) – although we haven't fully arrived there yet. Within this blue wave (2) to (3), we can already identify a white 1-2-3-4 in progress, and from white 4, we're seeing a yellow 1-2-3-4-5 impulse forming. 📌 Currently, we are at yellow wave 4, right below the Take Profit zone of the Fibonacci extension projected for blue wave (3). This level aligns perfectly with the yellow Fibonacci extension zone calculated from yellow wave 2 to 3 to 4, which gives us the expected yellow wave 5 target. 🚀 Once that move is complete, I anticipate a potential upward breakout above 3400, leading to a blue wave (5). This blue wave (5) would then mark the blue wave 1 of a larger bearish sequence: specifically, the broader move from yellow wave (2) to (3). https://www.tradingview.com/chart/XAUUSD/zeH03ZbJ-XAU-USD-Likely-Wave-%E2%91%A4-Top-In-ABC-Correction-in-Progress/waterfall
ElliotXSolana
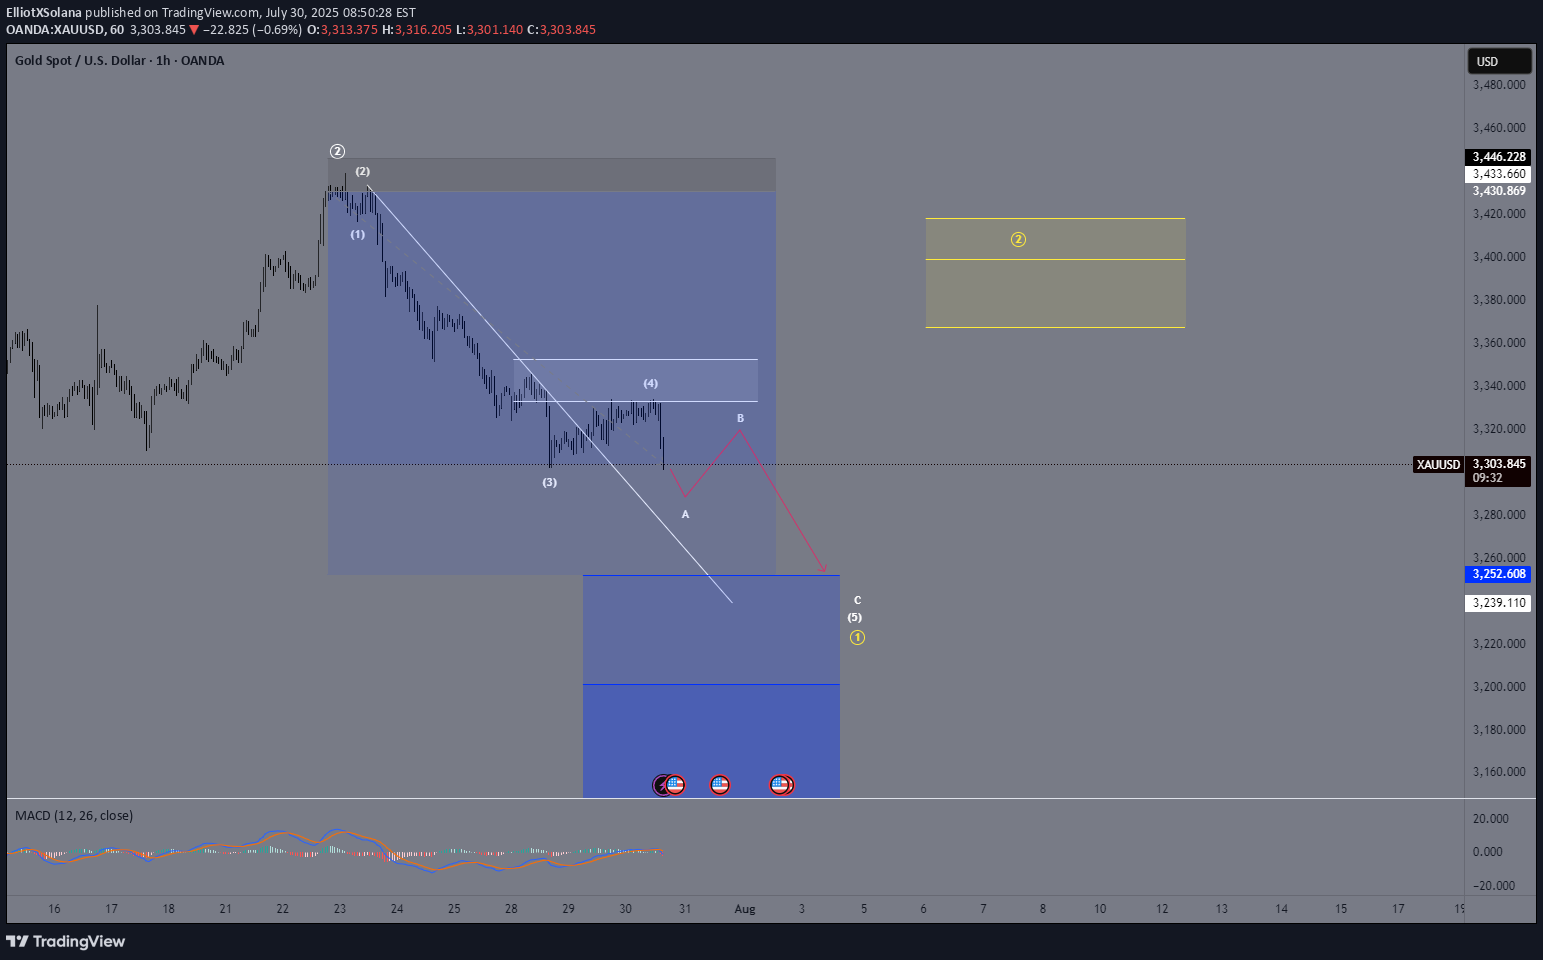
XAU/USD – Likely Wave ⑤ Top In – ABC Correction in Progress!
XAUUSD ✅ We’ve most likely completed our (Circle) Wave ⑤, and are now entering the first corrective wave of an ABC pattern (marked in 🟡 yellow brackets). 🔹 The (A) wave unfolded as a clean white ABC correction – textbook structure, worked out perfectly. 🔹 From (A) to (B) we saw an impulsive move (likely a 1-2-3-4-5, though not labeled). 🔻 From (B), a strong bearish move broke right through our 🔴 ascending trendline, signaling a potential trend reversal. 👉 We’ve likely completed wave 1 of the new downtrend and are now in a corrective move upward, forming yellow wave 2: 🟡 (A) – (B) – (C), with the (B) once again forming an internal ABC structure. 🎯 We’re now watching for the completion of wave C – this will complete yellow wave 2. 📐 The target zone (TP) lies in the yellow Fibonacci retracement area, with a key level at the 78.6% retracement (marked in white). 🛑 Stop Loss should be placed above the 4-month zone, or just above wave (B). 📊 The Take Profit will be more precise once the top of wave C is confirmed – but expect it to align closely with the 🔵 Fibonacci extension zone.
ElliotXSolana
XAU/USD Analysis – Wave 2 Still in Progress
XAUUSD We're currently in a corrective structure following our Circle Wave 3. ✅ (A) and (B) of the correction are already complete. 🔽 Now we're in the development of Wave (C), which should unfold as a 1–2–3–4–5 structure. 📌 Current Situation Wave 1 of (C) was very impulsive – a strong move confirming the structure We're now in Wave 2, which is developing as a classic ABC correction ✅ Circle A and Circle B are complete 🔄 Currently transitioning from Circle B to Circle C 🧠 Market Insight We’ve already seen the first touch of the Fib zone, but I don’t believe that marks the end of Circle C just yet – the time duration of B → C is too short compared to 1 → A and A → B. That's why I expect a smaller degree correction playing out now: → (A) → (B) → (C) (lower timeframe within Circle C) Alternatively, the whole 1 → 2 could even unfold as an A–B–C–D–E triangle, though I personally prefer ABC structures for cleaner setups and better trade entries. 📈 Trade Setup There are two short setups currently marked in the chart: Sell from small B → small C 🎯 Take-Profit: Aligned with Fib Extension Zone near 3400 🛑 Stop-Loss: Just above the small A Sell from small C extension move 🛑 Stop-Loss: Below (B) 🎯 Target: Also around the major Fib confluence zone at 3400 📊 Conclusion ✅ Wave (1) done 🔄 Wave (2) still unfolding as complex ABC ⚠️ Be patient for confirmation of small B → C 🟢 Fib zones aligned – volume expected around 3400 🧩 Clean setups preferred over triangle flags
ElliotXSolana
Gold elliot wave count
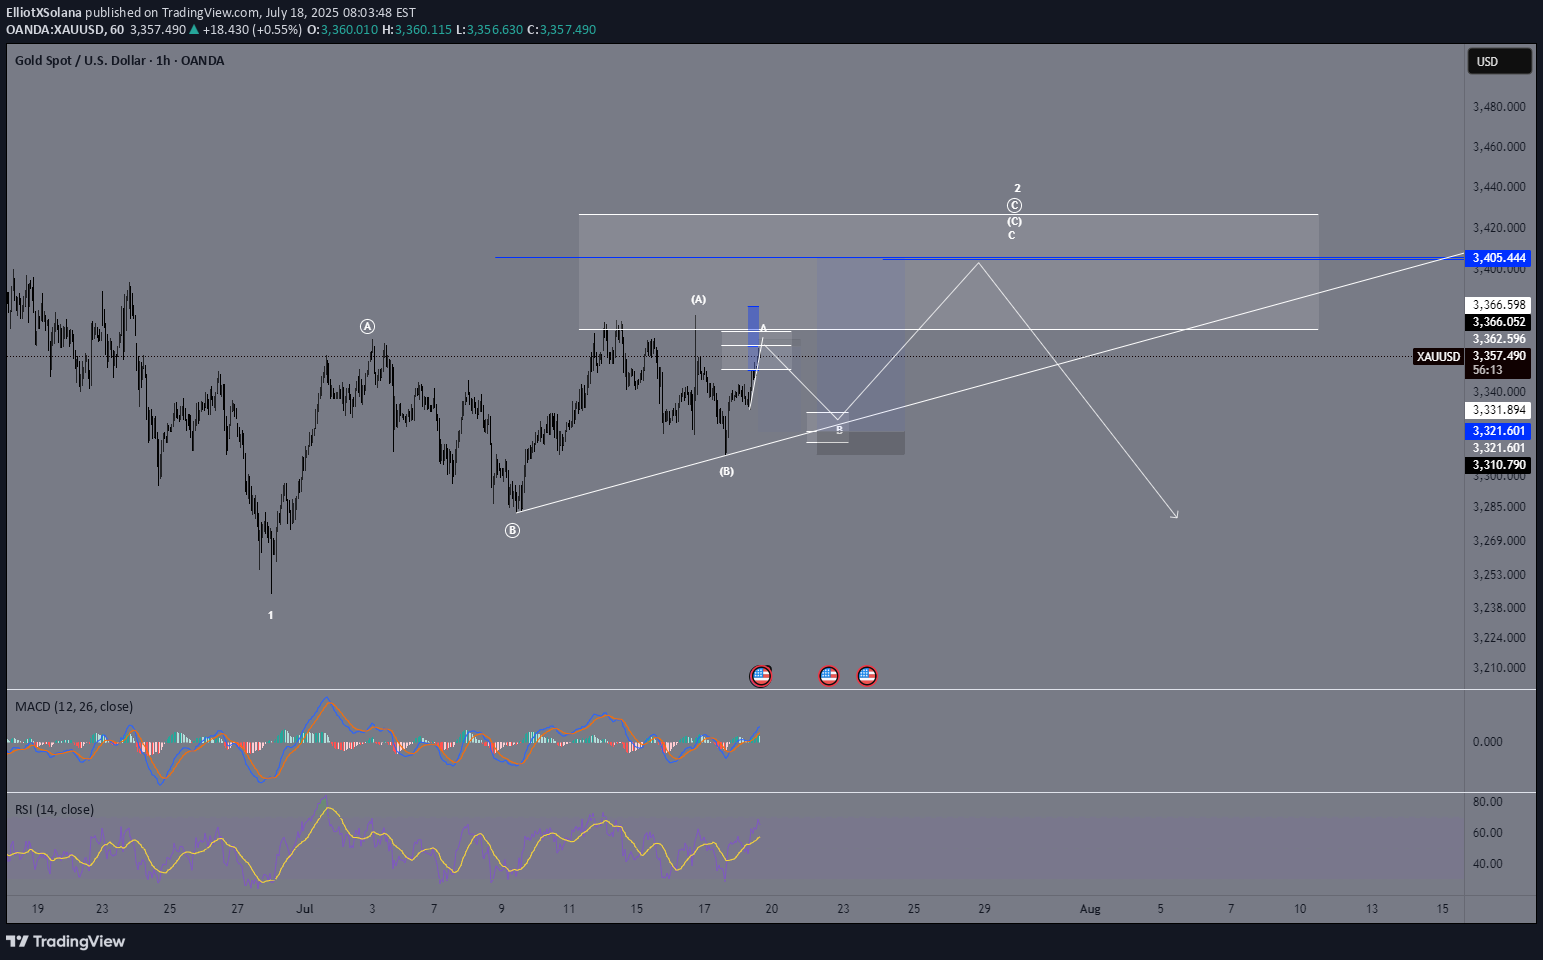
Market Structure – Corrective Wave 2 Still in Progress We're currently in a Wave 2 correction, unfolding as a classic ABC structure – labeled with Circle A → Circle B → Circle C. ✅ Circle A and Circle B are already complete. We're now in the move from Circle B → Circle C, which itself is unfolding as a: → (A) → (B) → (C) (in parentheses) Currently, we are in the move from (B) to (C), which again is breaking down as a smaller A → B → C move. 🔍 Key Levels to Watch: 📈 We might now be completing Wave A of (C) around the 3362 level. 🔁 A pullback to around 3322 could follow as Wave B, ➡️ leading to a final Wave C (of (C), of Circle C, completing Wave 2) targeting around 3405. ⏳ What’s Next? Once we hit the 3405 zone, that would potentially complete the entire Wave 2 correction. From there, I expect a trend reversal to the downside, beginning the next impulsive wave down.
ElliotXSolana
Elliott Wave Update – Is Wave 2 Complete?

XAUUSD We're currently in an ABC correction following our Wave 1. Potentially, Wave C is already completed, which would mean that Wave 2 has found its top. ❗ Why do I say potentially? Because there's still a chance we could see a higher high before the real drop begins. However, based on the current structure, I believe the top is in ✅ ⚠️ Key Confirmation – White Trendline 📉 If we break below the white trendline, it confirms the end of Wave 2. Then I expect a 5-wave move down: ➡️ (1) - (2) - (3) - (4) - (5) 📈 If the trendline holds, we might still see a higher Wave 2 before reversal. 📏 Fib Zones are marked on the chart for confluence and targets. Let’s see how price reacts in the coming hours. A confirmed breakdown would set the stage for the next impulse ⚡
Disclaimer
Any content and materials included in Sahmeto's website and official communication channels are a compilation of personal opinions and analyses and are not binding. They do not constitute any recommendation for buying, selling, entering or exiting the stock market and cryptocurrency market. Also, all news and analyses included in the website and channels are merely republished information from official and unofficial domestic and foreign sources, and it is obvious that users of the said content are responsible for following up and ensuring the authenticity and accuracy of the materials. Therefore, while disclaiming responsibility, it is declared that the responsibility for any decision-making, action, and potential profit and loss in the capital market and cryptocurrency market lies with the trader.