
ElizatradingQueen
@t_ElizatradingQueen

What symbols does the trader recommend buying?
Purchase History
پیام های تریدر
Filter
ElizatradingQueen
Gold Price Rebound: Bullish Target Set at 3370

This 1-hour chart of Gold (XAU/USD) highlights a recent downtrend followed by a potential reversal. After forming a support level near 3,270 USD, the price has begun to climb, suggesting bullish momentum. A target of 3,370 USD is projected, as indicated by the arrow and label. The setup implies a breakout from the descending channel, offering a possible short-term buying opportunity. Keep an eye on volume and confirmation candles for stronger signals. 3. Breakout & Momentum ShiftAfter touching the support, the price rallied, breaking above the descending channel.The recent green candles indicate bullish momentum, potentially marking the start of a trend reversal or a bullish correction.---4. Target and ResistanceThe chart marks a target level at $3,370, aligning with previous support-turned-resistance or a Fibonacci retracement zone.This could be a realistic short-term target if bullish momentum sustains.---5. Volume and ConfirmationThe chart doesn't show volume, but confirmation of this reversal would be stronger with increasing volume on green candles.
ElizatradingQueen
Gold Price Breakdown Imminent Bearish Setup Target$3220 Support
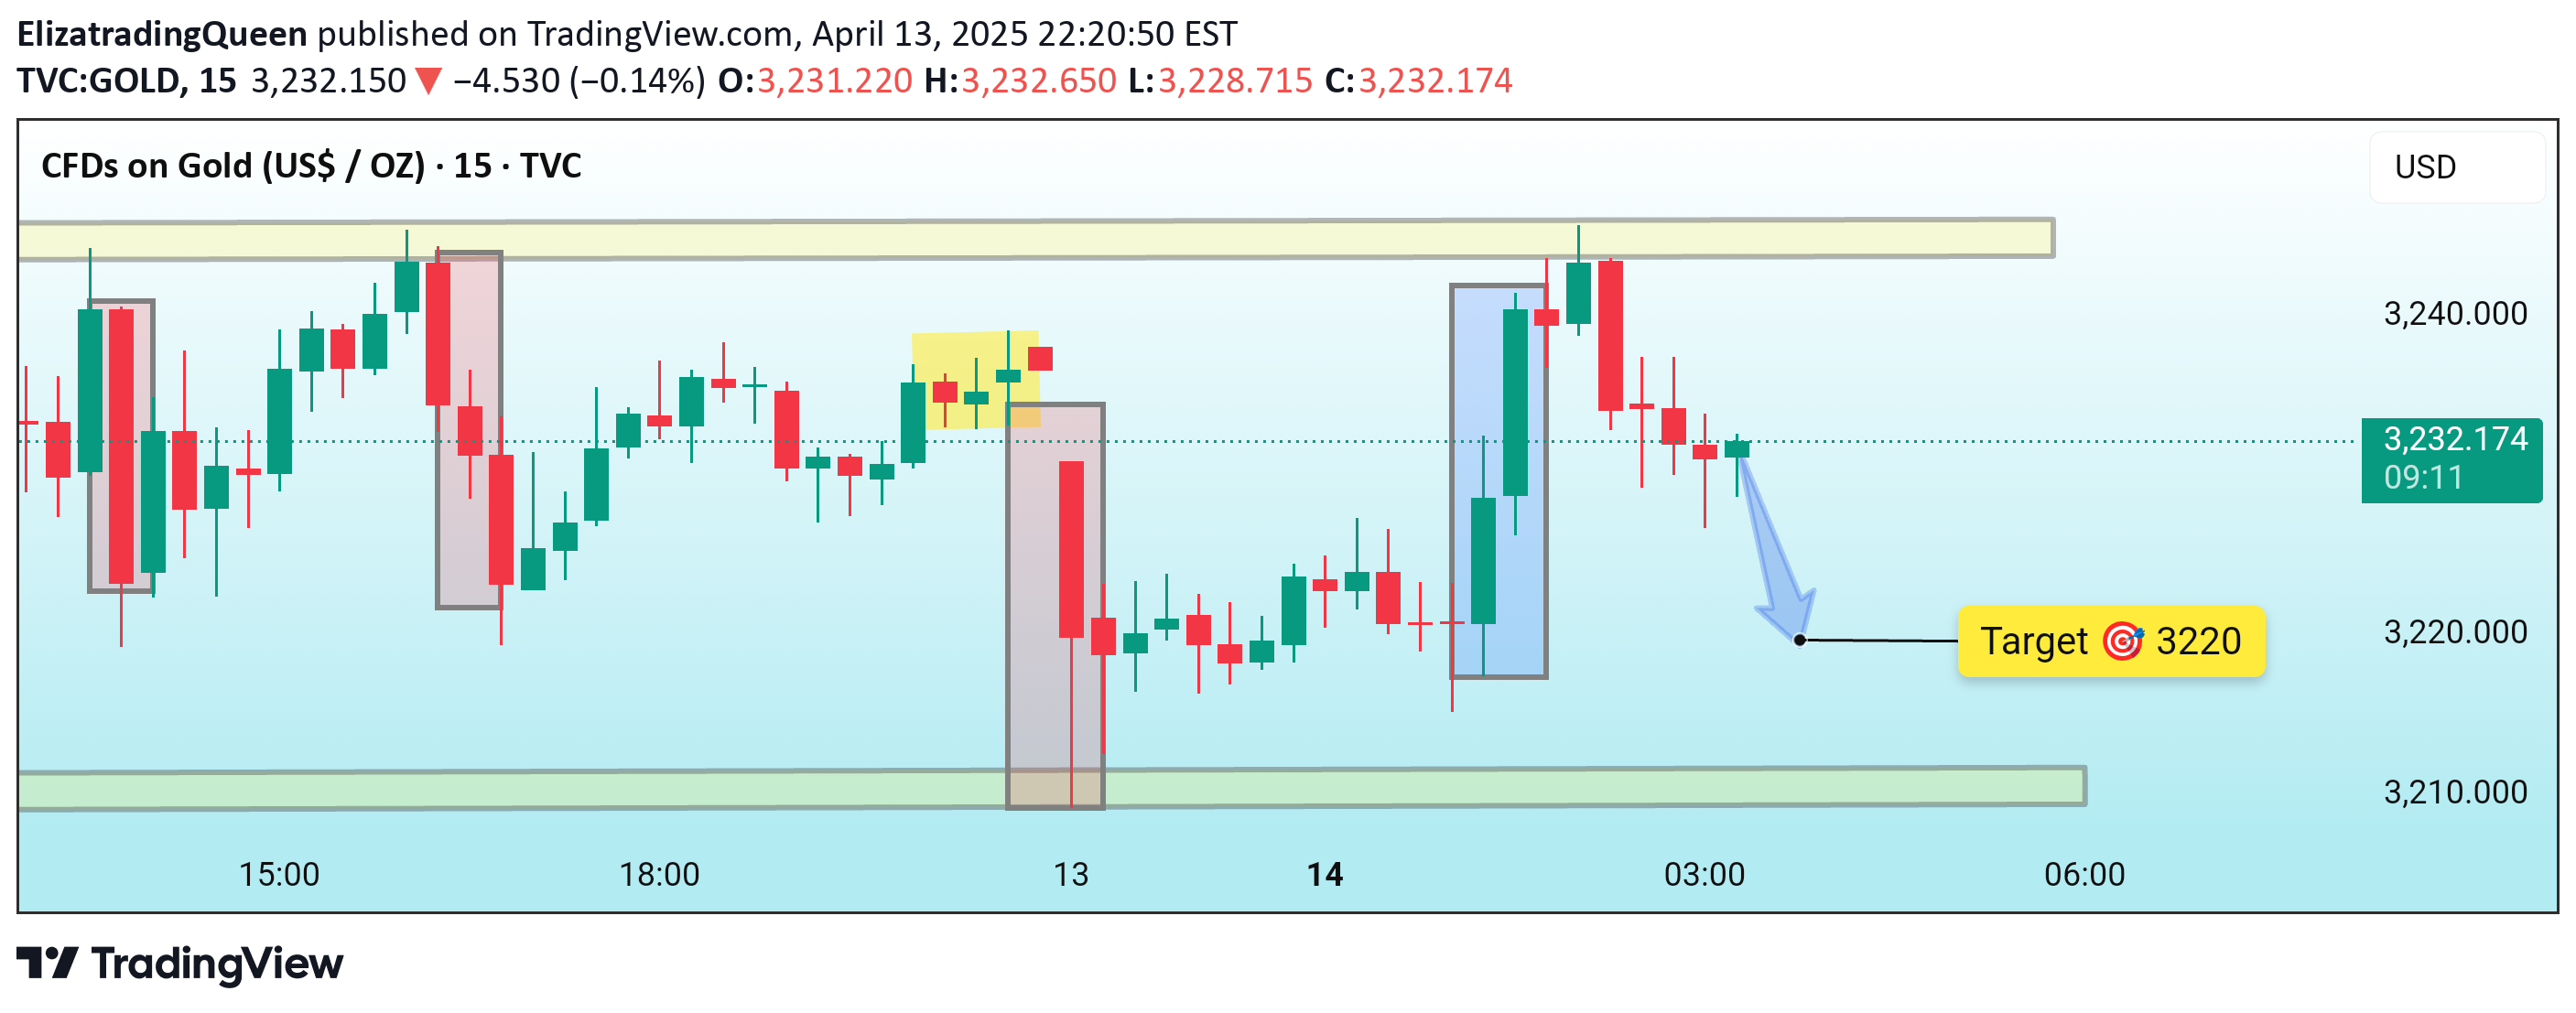
This 15-minute chart for Gold (XAU/USD) highlights a bearish reversal from a key resistance zone near $3,240. The price formed a strong bearish engulfing pattern after testing resistance, suggesting downside momentum. A potential short trade setup is illustrated with a target at $3,220, aligning with a previous demand zone. The blue arrow indicates expected price movement, supported by recent volatility and price structure. Traders should watch for confirmation before entering positions.1. Price Structure & Key Zones:Resistance Zone (~$3,240):This zone has been tested multiple times (marked with yellow and shaded boxes), acting as a strong supply area. Each test results in rejection, indicating sellers are defending this level.Support Zone (~$3,210–$3,220):Highlighted at the bottom, this demand zone has held price up in the past, making it a logical target for any short setups.---2. Price Action Patterns:Bearish Engulfing Patterns:Several shaded areas on the chart highlight strong bearish candles following bullish ones, indicating momentum shifts in favor of the bears.Fakeout (Yellow Box):A small bullish breakout above a recent high failed, leading to a sharp reversal. This often traps long traders and fuels downside momentum.---3. Current Price Action:The latest candles show a loss of bullish momentum after testing the resistance zone again.A strong red candle followed by lower highs signals a potential bearish continuation.A blue arrow points downward, suggesting that a short setup is in play with a clear target at $3,220, as marked.---4. Trade Idea:Bias: Bearish (short-term)Entry: Below $3,232 confirmation candleTarget: $3,220 (marked)Stop Loss: Above $3,240 resistance zoneRisk/Reward: Appears favorable given the structureTarget reached successfully
ElizatradingQueen
Bitcoin Eyes Breakout: Bullish Structure Targets 86K

This 15-minute chart of Bitcoin/USDT (BINANCE) highlights a bullish structure with a clear sequence of higher lows and higher highs. Price is currently consolidating within a range, and the formation suggests potential upward momentum. The target is set at 86,000 USDT, as indicated by the breakout projection. Key support and resistance zones are visually marked, and the bullish arrow suggests a likely continuation toward the target. Traders are watching for a breakout above the resistance level to confirm the move.Structure Observed:Current Market Snapshot:Price: $84,665.30Timeframe: 15-minutePlatform: BinanceChange: -0.43% (short-term pullback)Target: $86,000 (highlighted)---Technical Analysis:1. Bullish Structure Intact:The chart still shows a higher low and higher high, key indicators of an uptrend.Despite the current red candle and slight price dip, the structure hasn't been invalidated.2. Support & Resistance:Resistance Zone: Around $85,800–$86,000, tested but not yet broken.Support Zone: Around $84,000–$84,300, aligned with the previous higher low area. Holding above this zone keeps the bullish outlook alive.3. Pullback or Reversal?Current dip could be a healthy pullback within the range.As long as price stays above the higher low, bulls remain in control.4. Price Action Outlook:Price is consolidating before a potential breakout.The blue arrow points to the bullish scenario—a bounce from current levels toward the $86K target.
ElizatradingQueen
Bitcoin Breakout Setup: Targeting $84,000 Resistance Zone

This 15-minute BTC/USDT chart shows a bullish continuation setup, following a strong ascending channel. Price is currently consolidating within a horizontal range, and the chart suggests a potential breakout toward the $84,000 target zone. A slight dip before the upward move may offer a solid entry point. Watch closely for breakout confirmation above resistance.Key Levels to Watch:Support Zone: $82,300 – $82,500Resistance Zone (Target): $83,700 – $84,000Breakout Confirmation: Close above $83,700 with strong bullish candlesTarget reached successfully
Disclaimer
Any content and materials included in Sahmeto's website and official communication channels are a compilation of personal opinions and analyses and are not binding. They do not constitute any recommendation for buying, selling, entering or exiting the stock market and cryptocurrency market. Also, all news and analyses included in the website and channels are merely republished information from official and unofficial domestic and foreign sources, and it is obvious that users of the said content are responsible for following up and ensuring the authenticity and accuracy of the materials. Therefore, while disclaiming responsibility, it is declared that the responsibility for any decision-making, action, and potential profit and loss in the capital market and cryptocurrency market lies with the trader.