
DrDovetail
@t_DrDovetail

What symbols does the trader recommend buying?
Purchase History
پیام های تریدر
Filter
DrDovetail
Absolute worst case scenario for bitcoin if top is actually in
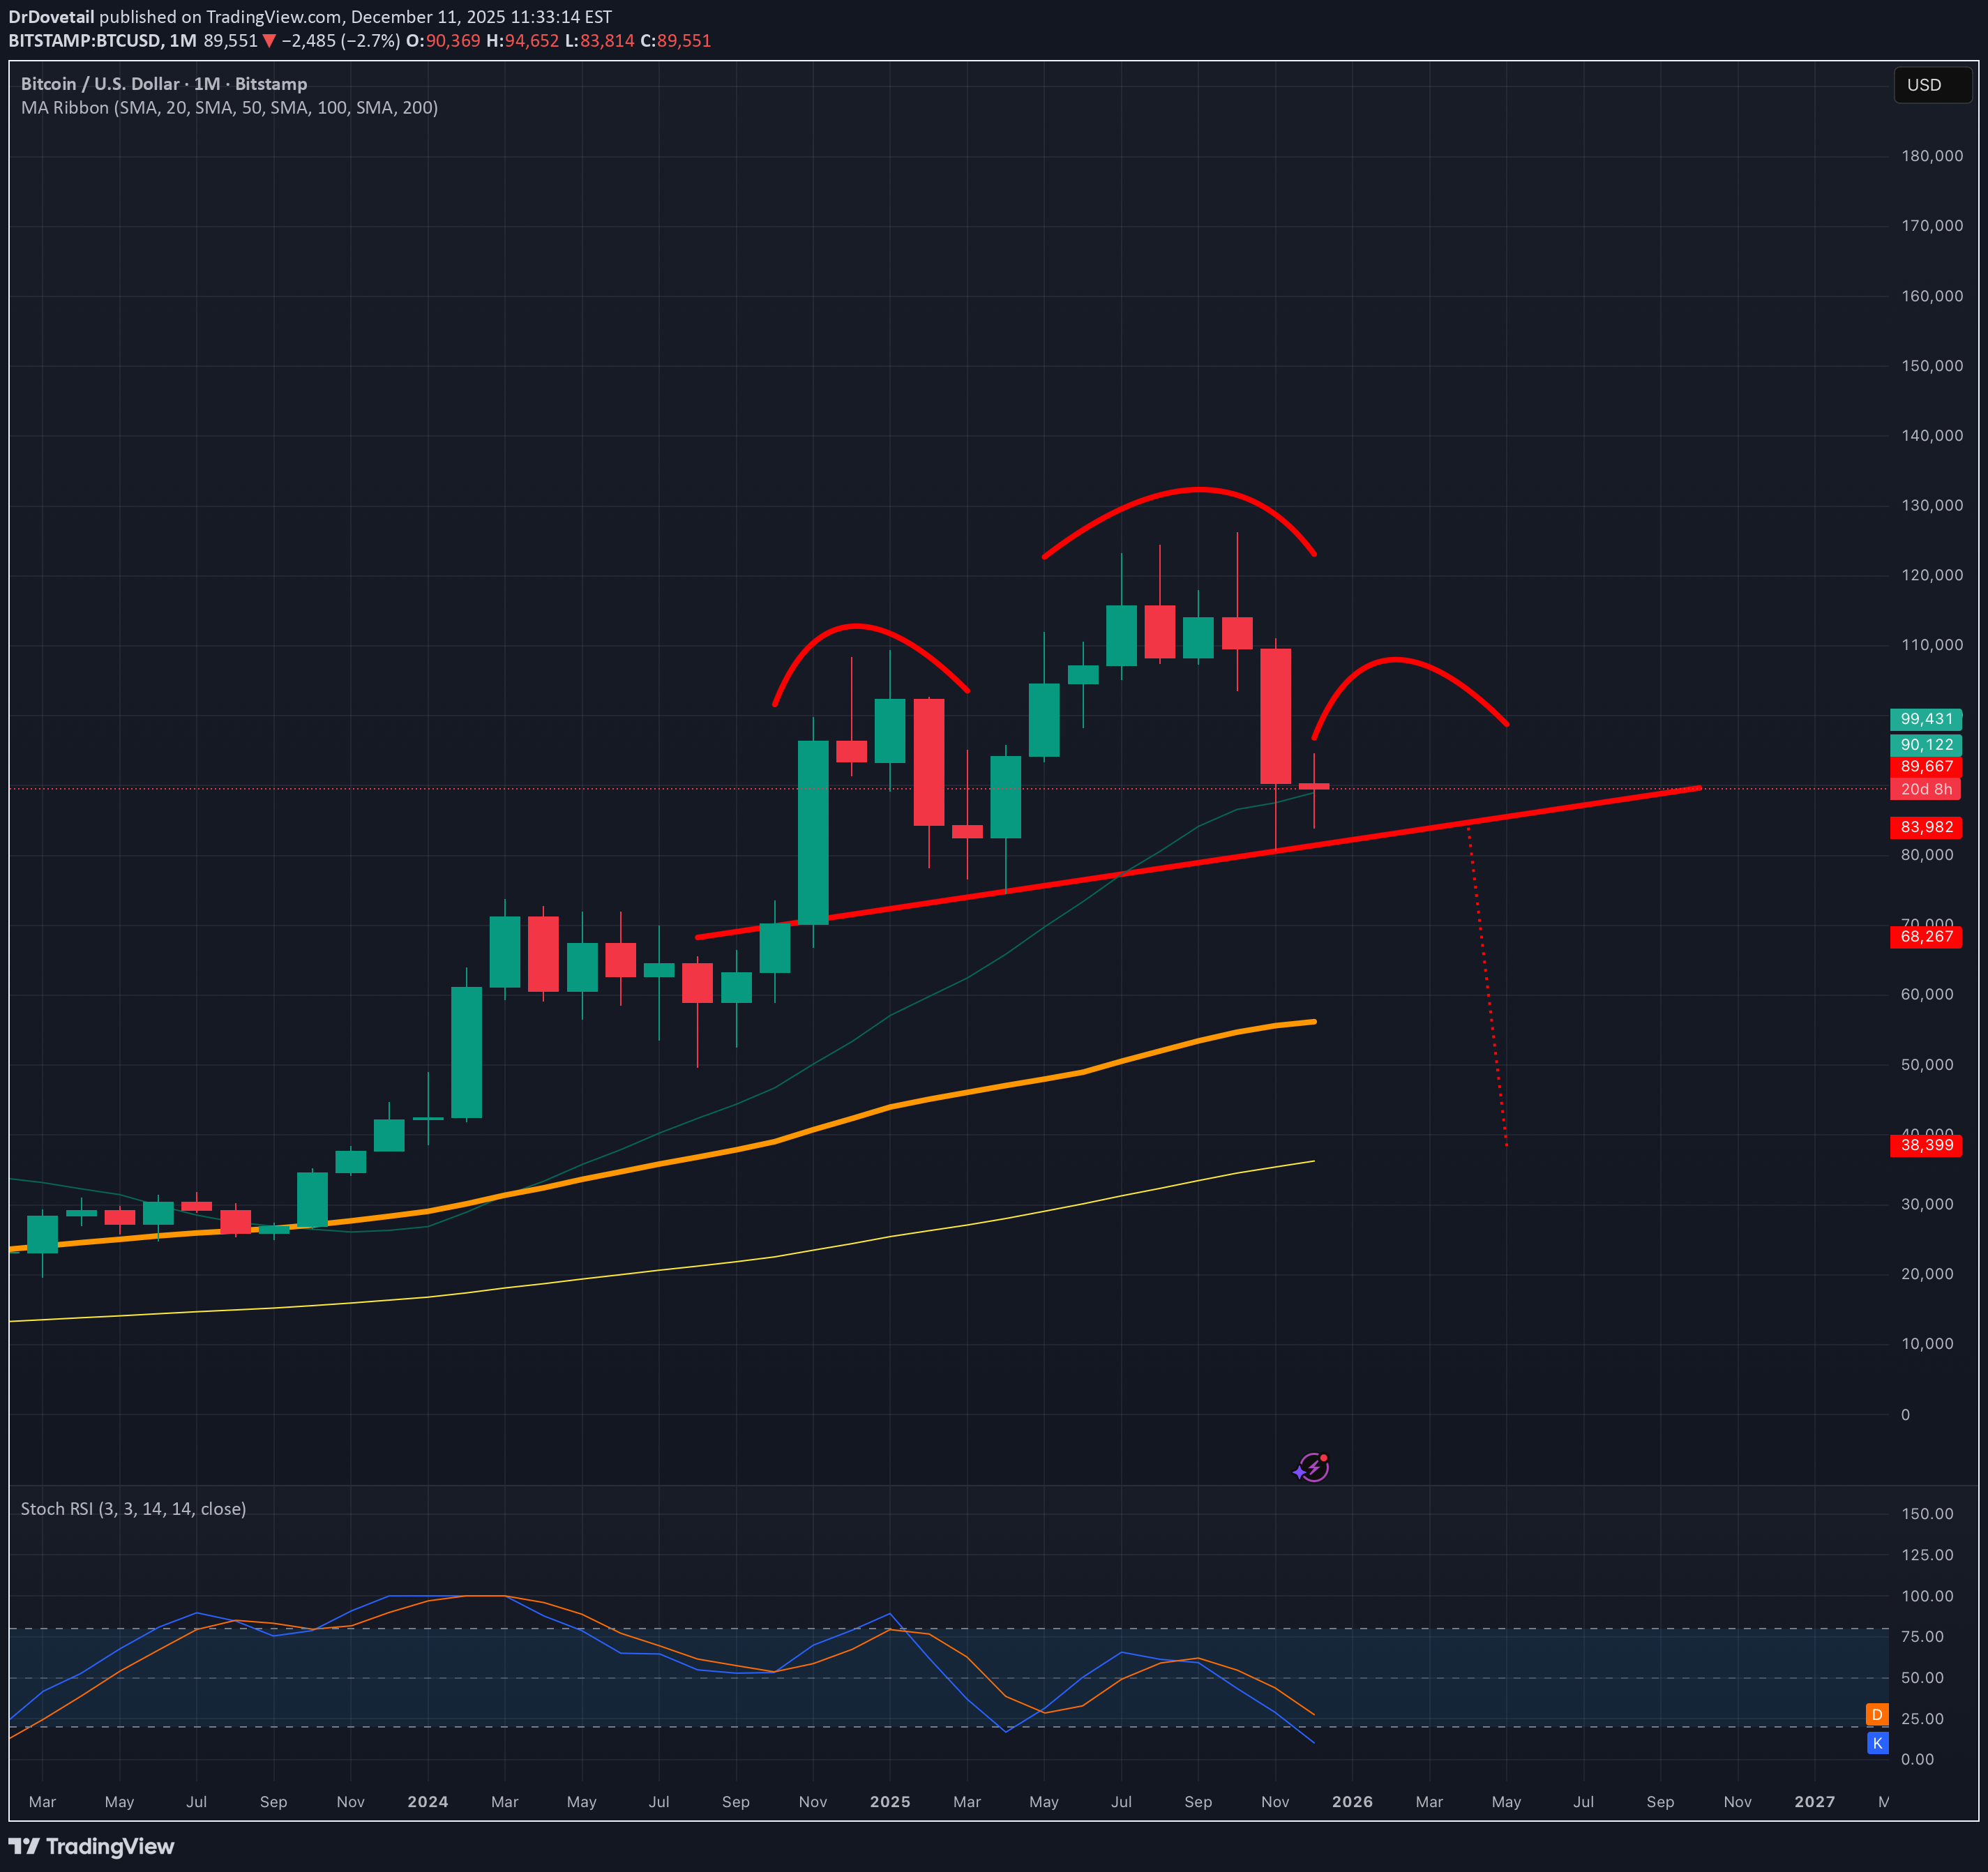
Very few reasons in my opinion to believe the top is currently in but there are a couple worth considering, the fact that it has run the normal 4 year cycle, and that a candle has gotten rejected after a retest of the the top trendline of the channels idea i have been posting since 2023. So even though there still far more reasons currently why the top of the bull market isnt in, I think it is always wise to try to look at all possibilities and angles of the chessboard here so on this chart idea, I am approaching it from the perspective of if the top of the bull market is actually already in even though for now I think that is a lower probability. If indeed the top is in though, then that would allow this head and shoulders pattern I have shown here to have a good liklihood of playing out. If it were to actually validate this head and shoulders pattern its breakdown target would be 38k which lines up perfectly with the monthly 100ma. So although, I personally feel like the bullmarket top being in is currently a low probability, if somehow it is then i think 38k would likely be the next bear market bottom with the monthly 100ma once again being the bear market bottom support. I still think the top isn’t in and we have better odds of entering a supercycle but I must also keep my mind open to a bearish possibility like this one to make sure I am properly prepared for whatever outcome may end up unfolding and am ready to take advantage no matter which way the market heads. *not financial advice*
DrDovetail
بازبینی کانال لگاریتمی: آیا قیمت به سقف برخورد کرده است؟
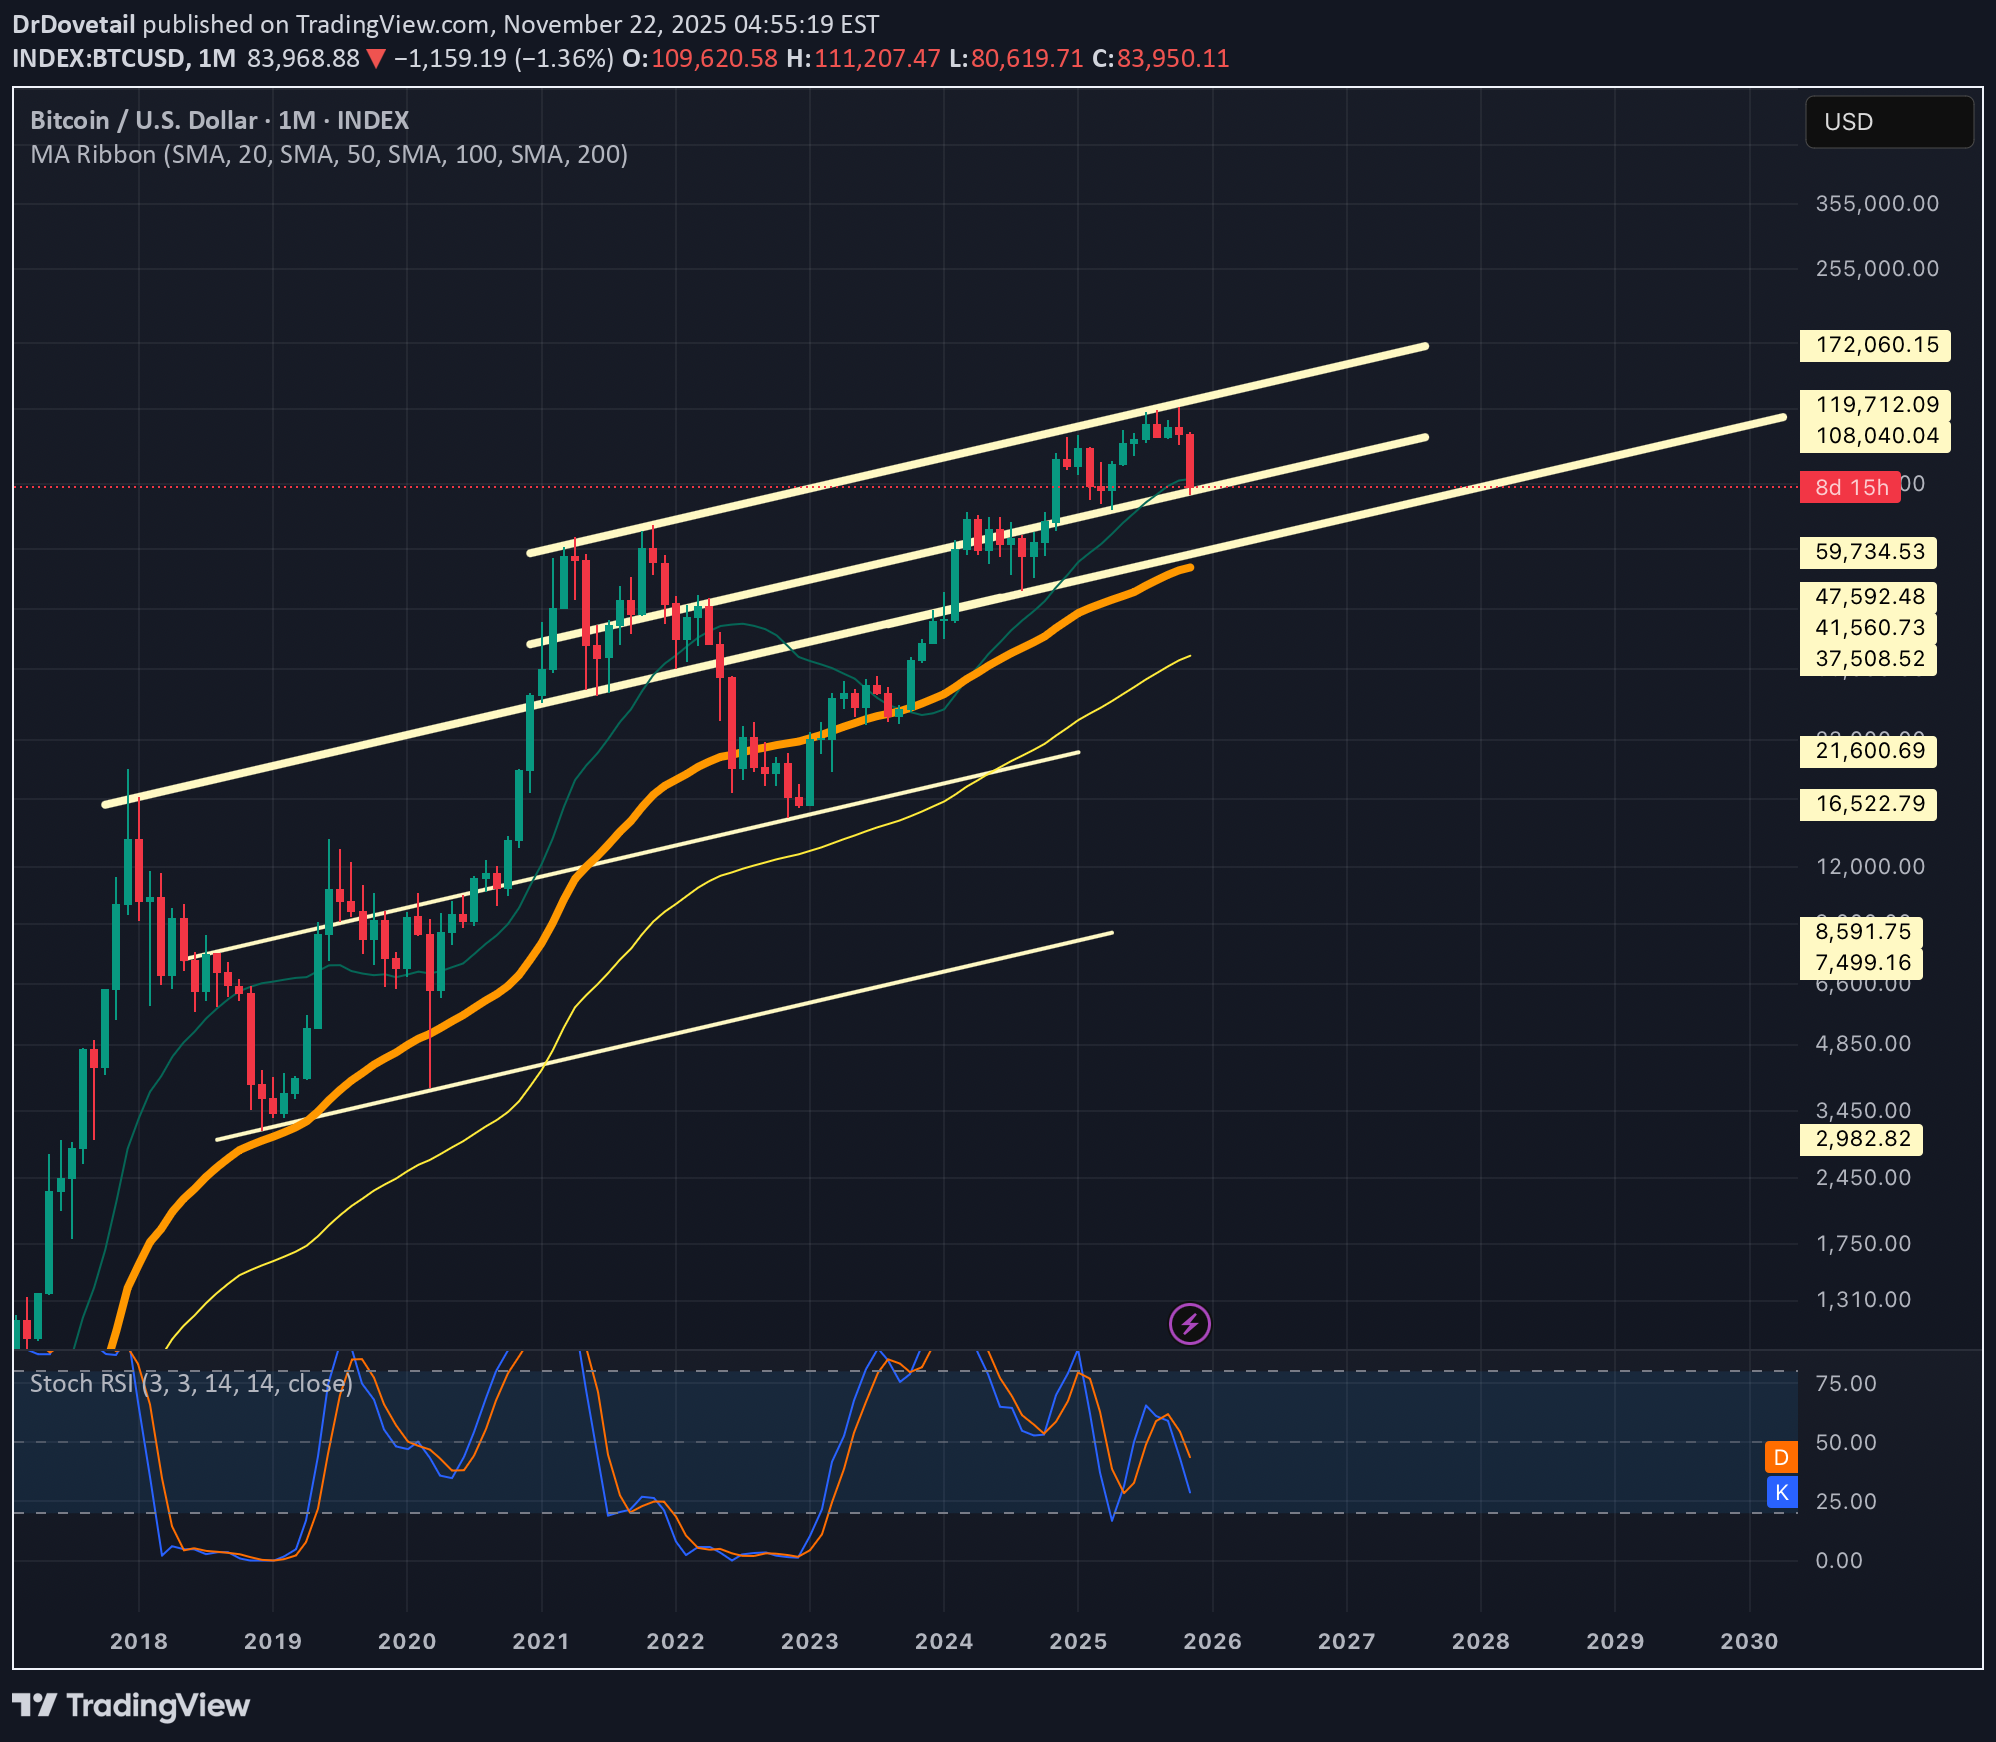
With the trendlines of this channel slightly shifted we can see that it is possible that priceaction has already tested the top trendline of the channel. However in my previous version of this idea which I will try to post below it hasn’t connected with the top trendline yet. Would make more sense for it to be having the rejection it is having if it has already retested this top trendline though so I decided to post this version of the chart too so I can keep an eye on both. Even if somehow this does signal some sort of top it looks like we have very strong support on the next trendline just below the current one which should have the monthly 50ma double reinforcing its support in the very near future. SOo in that case that 50k zone there should hold strong support,but hopefully this is So another correction and not the top in which case the current trendline we have just retested will hold support. *not financial advice*
DrDovetail
ترامپ/دلار: آیا شکست قیمتی منجر به دو برابر شدن ارزش میشود؟ (تحلیل تکنیکال)
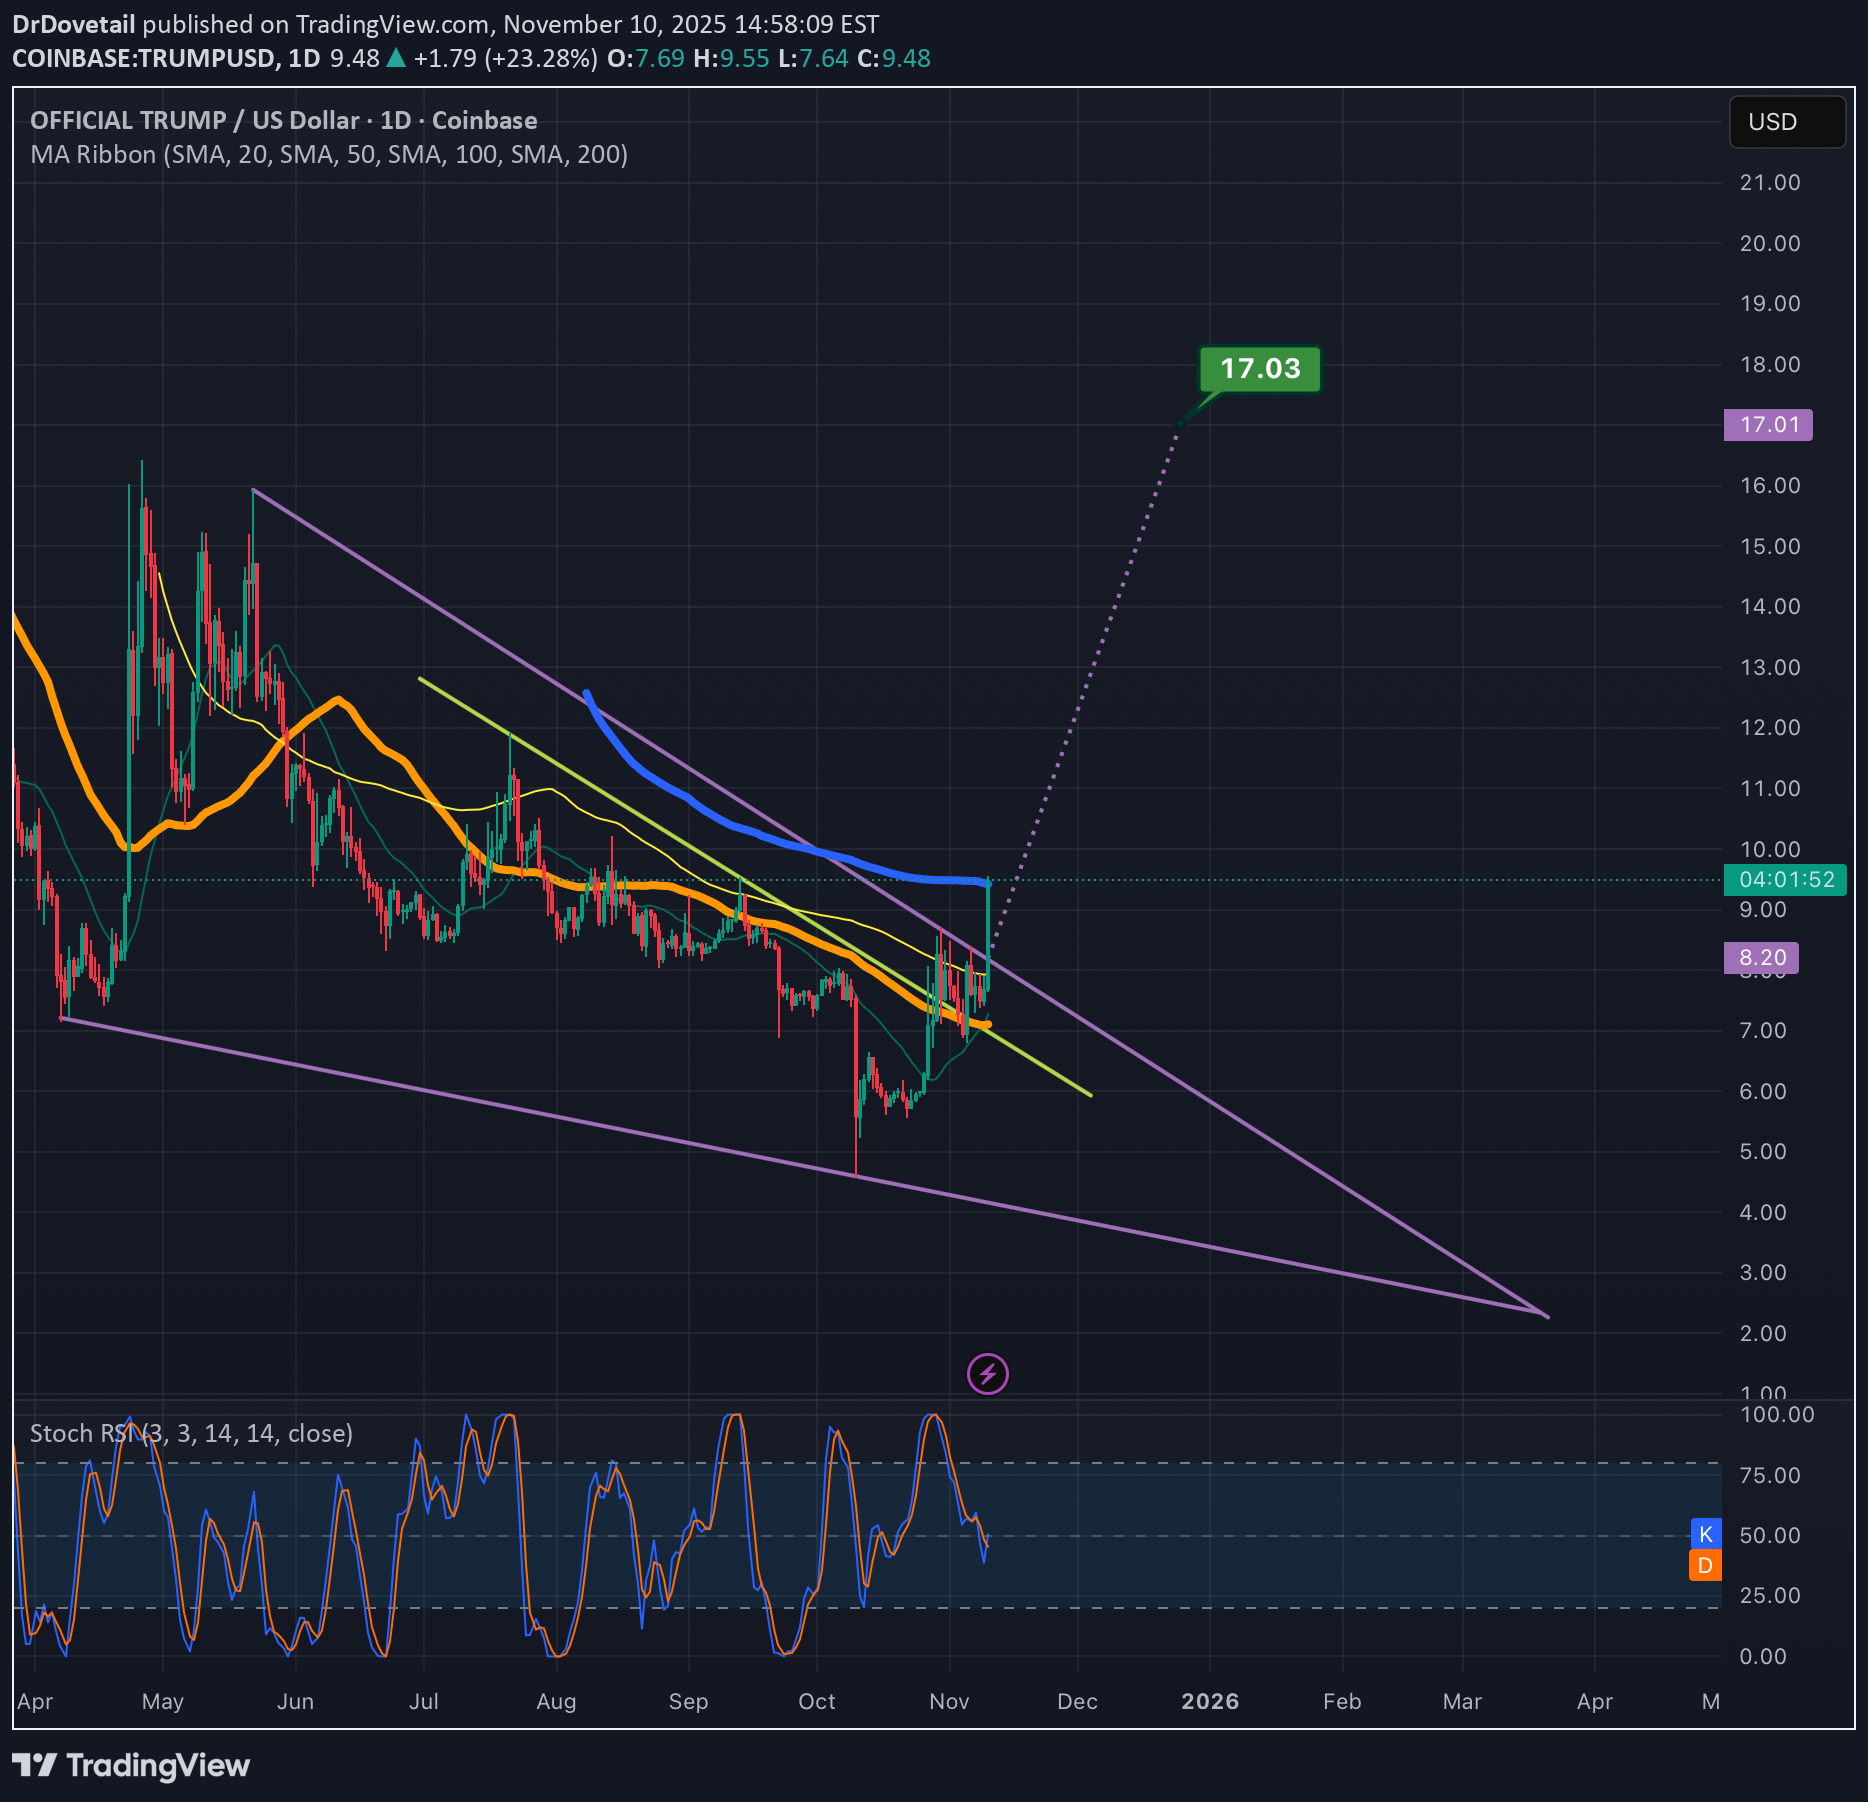
It will need to flip the blue 200ma to solidified support to validate the breakout in my opinion but if it does it should 2x from its current value. *not financial advice*
DrDovetail
هدف شگفتانگیز ریپل: پرچم گاوی XRP به کجا میرسد؟ (تحلیل فنی)
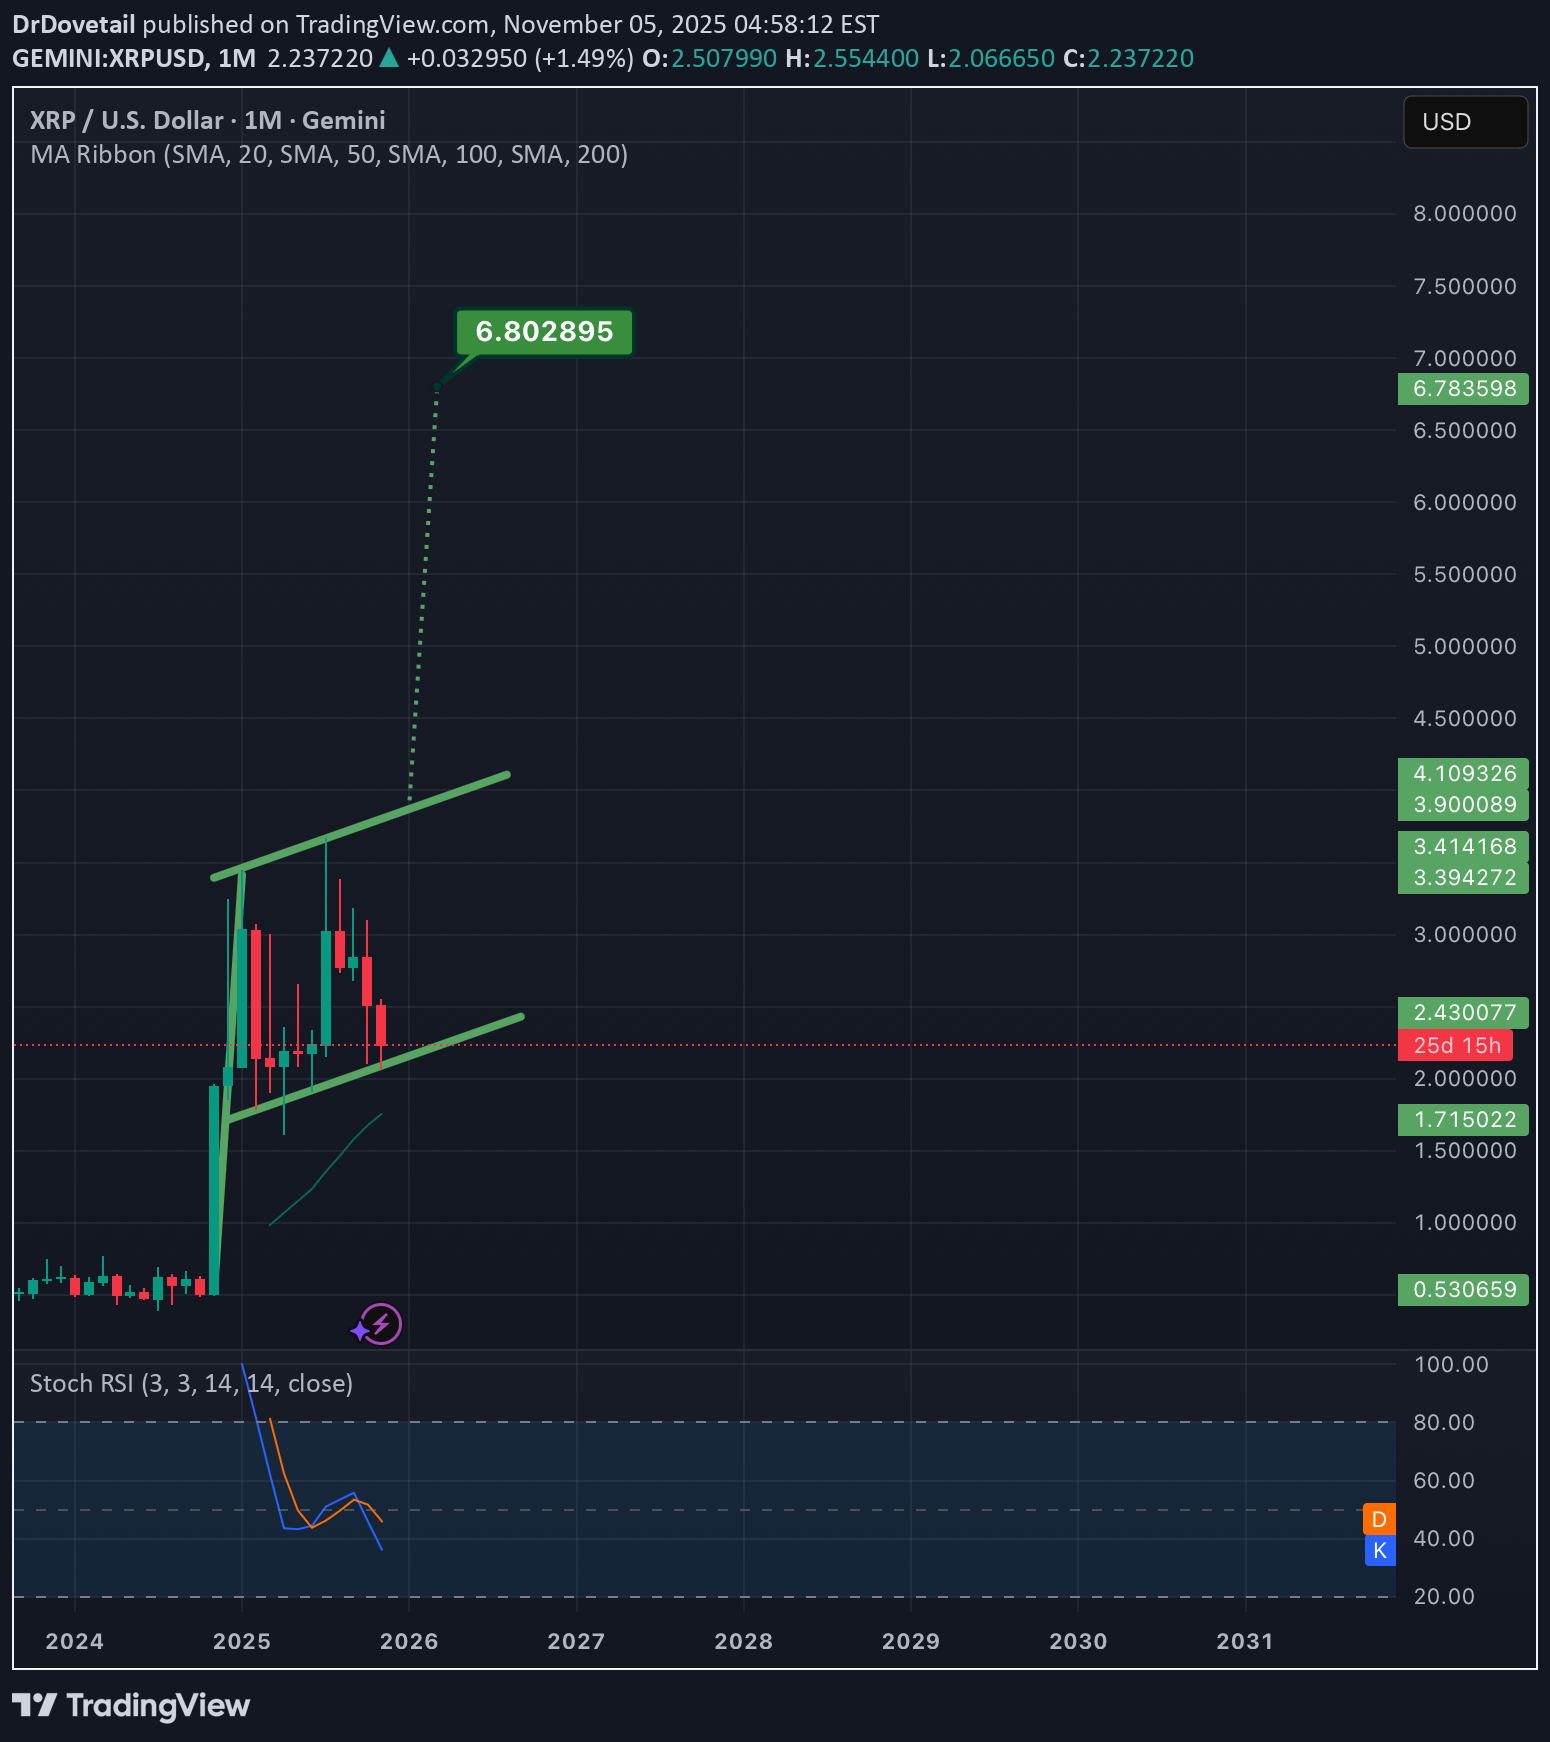
Will be a very good sign if it finds a way to hold this bottom trendline as support.Even if it does hold support a wick below it is still very possible. *not financial advice*
DrDovetail
چالش بزرگ دش: آیا میتواند به زِکش برسد؟ (تحلیل پامپ بزرگ پیش رو)
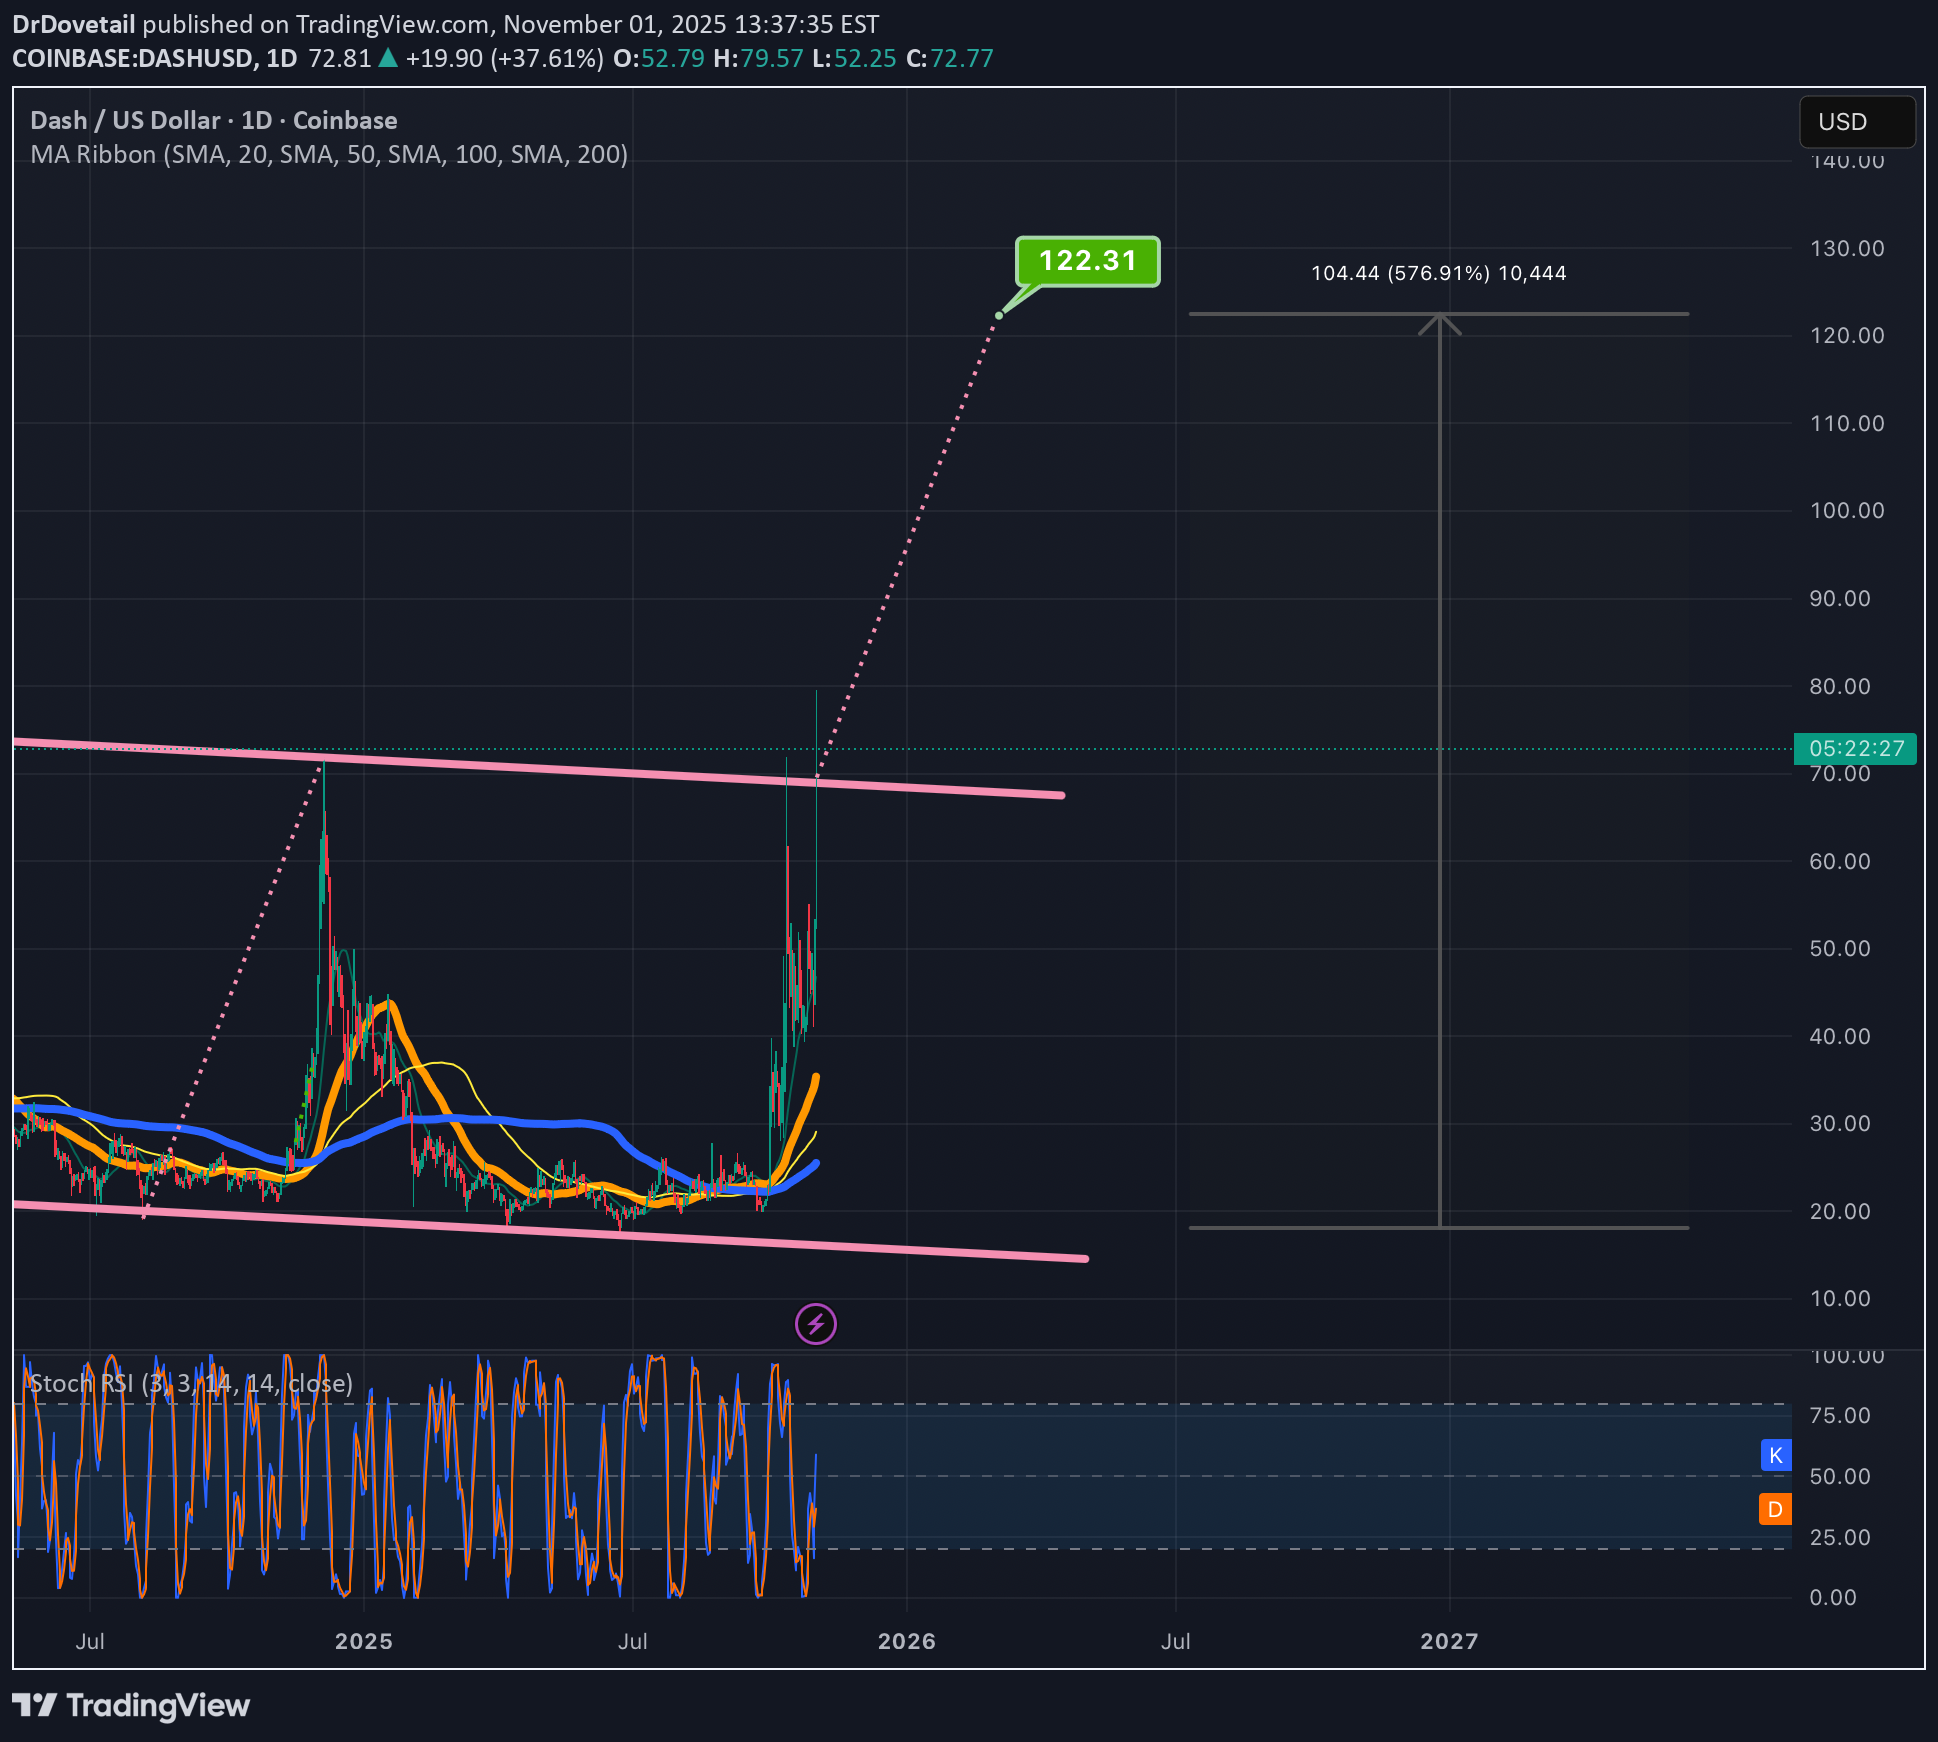
Until recently, Zcash and Dash tended to pump and dump in tandem with eachother, ever since ZCash’s recent big breakout though Dash has noticeably lagged behind. It was hard to say whether it was just delayed reaction on dash’s part or if a true decoupling between the two ahd occurred but it seemed like a least a safe gamble(not financiala dvice) to put a little chunk of money on dash in the interim in case it would do something similar to what Zec has been doing in the enar future. So that’s what I did and now dash is pumping and has gotten above the top trendline of this pink channel. If it validates the breakout at this breach point the measured move target is around $122. From the bottom around $18 thats over a 500% gain. Could always just keep going after that like Zcash has done also but that remains to be seen. First things first is just to validate the breakout of the channel which has not yet happened but a decent probability that it will. *not financial advice*
DrDovetail
بیت کوین رکورد زد: آیا مسیر صعودی تا ۱۵۳ هزار دلار قطعی شد؟

Feels like it may be validating the breakout above the blue line as it also seems to be climbing up the dotted measured move line here on the last few candles. So probability is quite good that we validate the breakout on this impulse. If so the full measured move target is around 152.9k or more or less 153k. *not financial advice*
DrDovetail
هدف نهایی طلا کجاست؟ راز پشت پرده صعود انفجاری XAUUSD تا 4059 دلار!

Because of the bullflag with the long pole it is currently breaking up from *not financial advice*
DrDovetail
Descending channel/Bull flag on xrpusd revealed
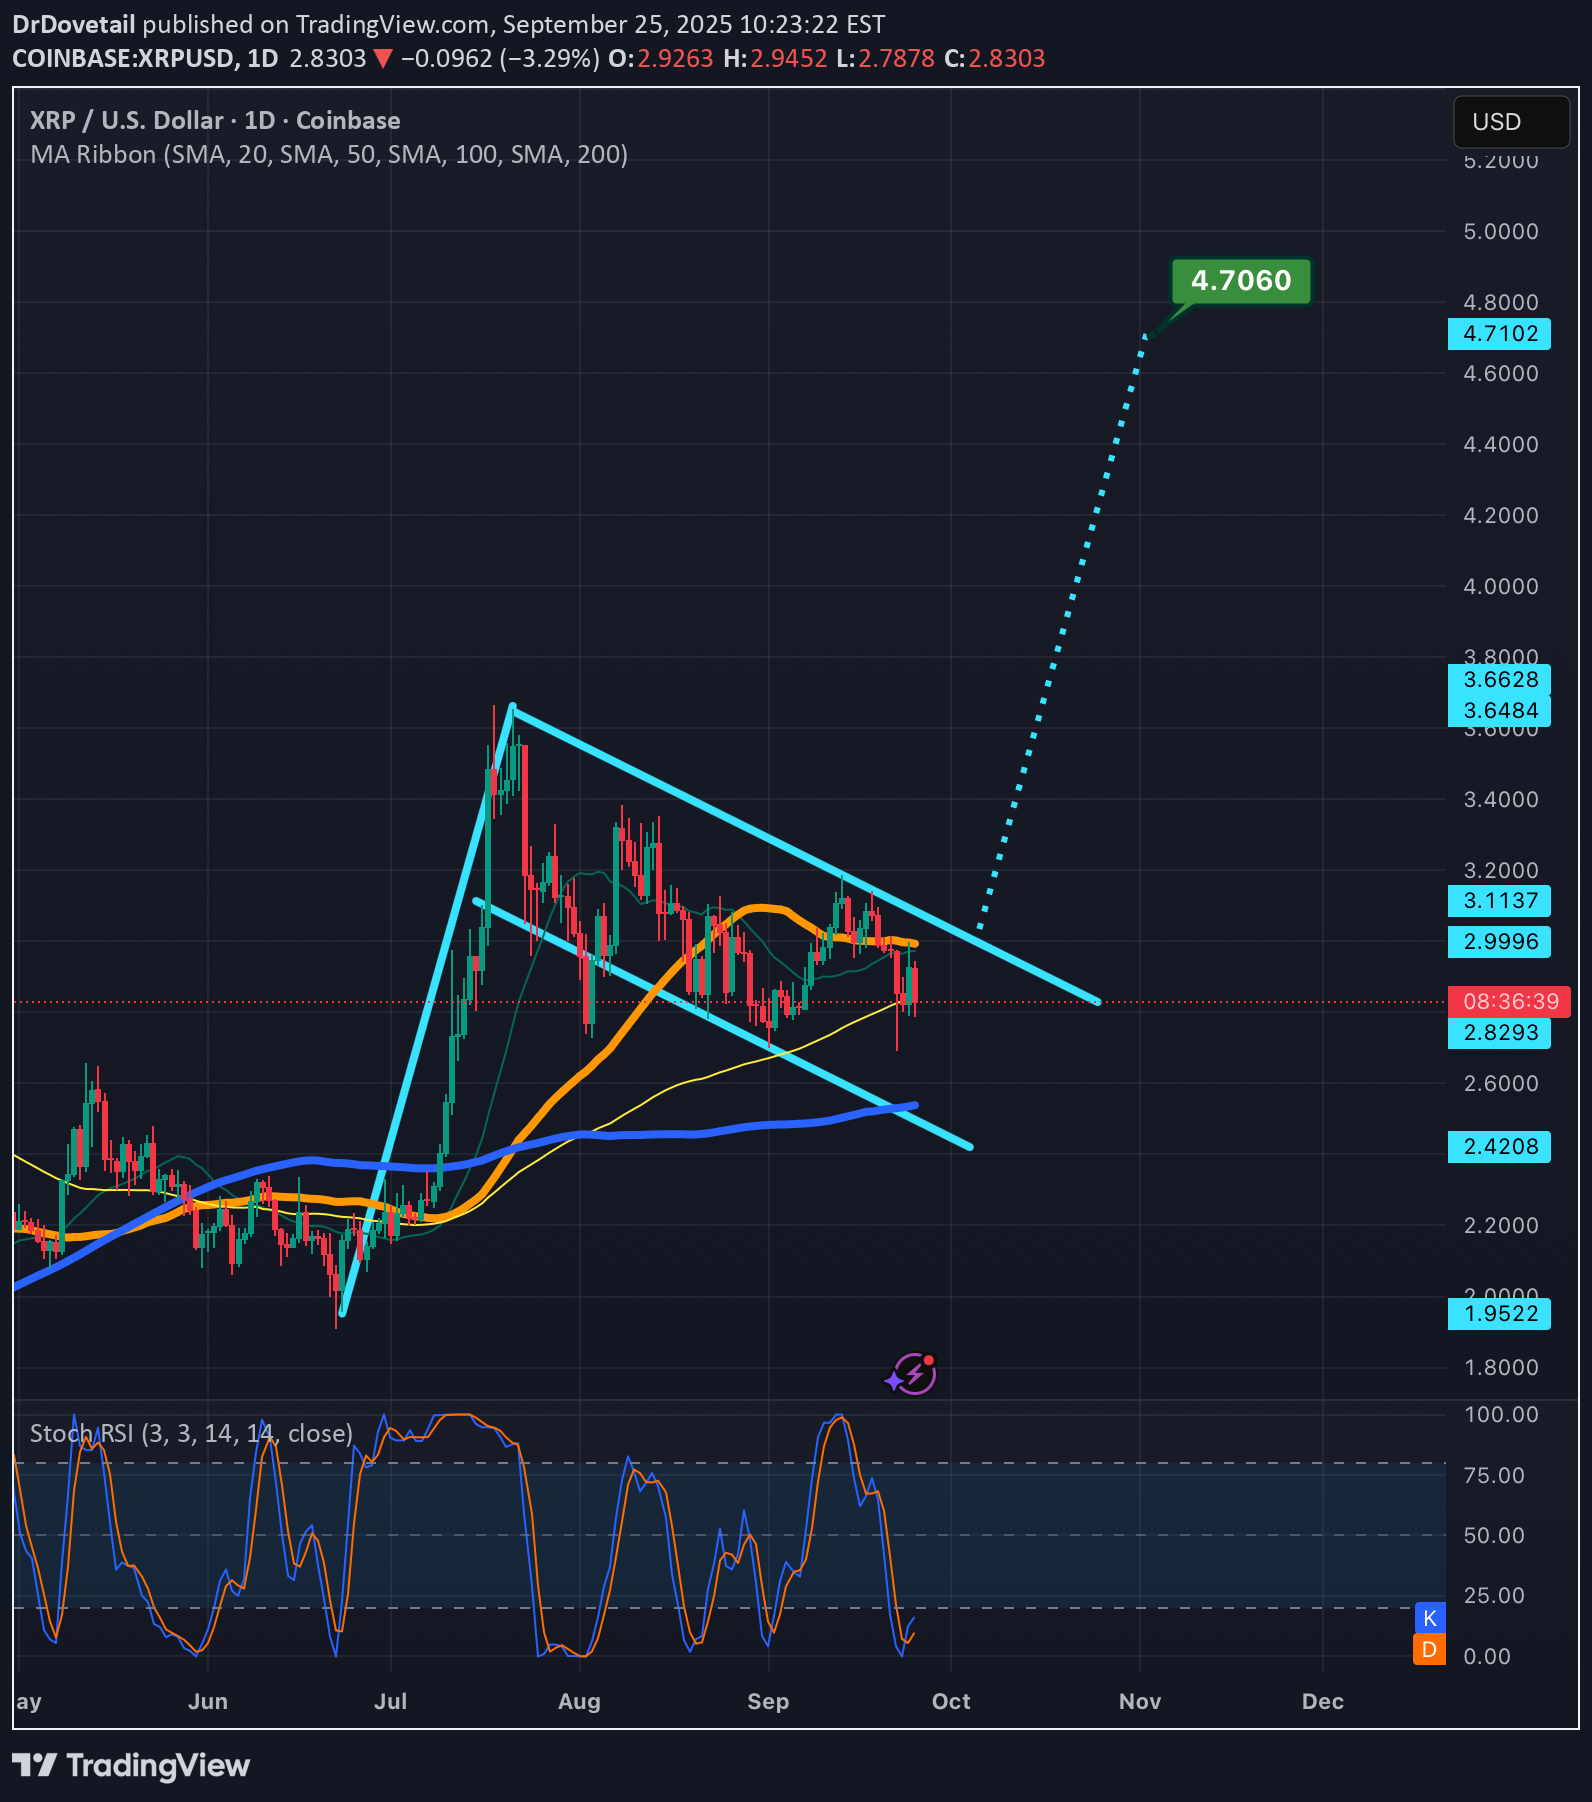
After the most recent resistance was found I was able to find the channel xrpusd price action is currently in which also is functioning as a bullflag. My guess is the uptrend will resume in October but we will know soon enough *not financial advice*
DrDovetail
A descending channel/bullflag reveals itself on btcusd
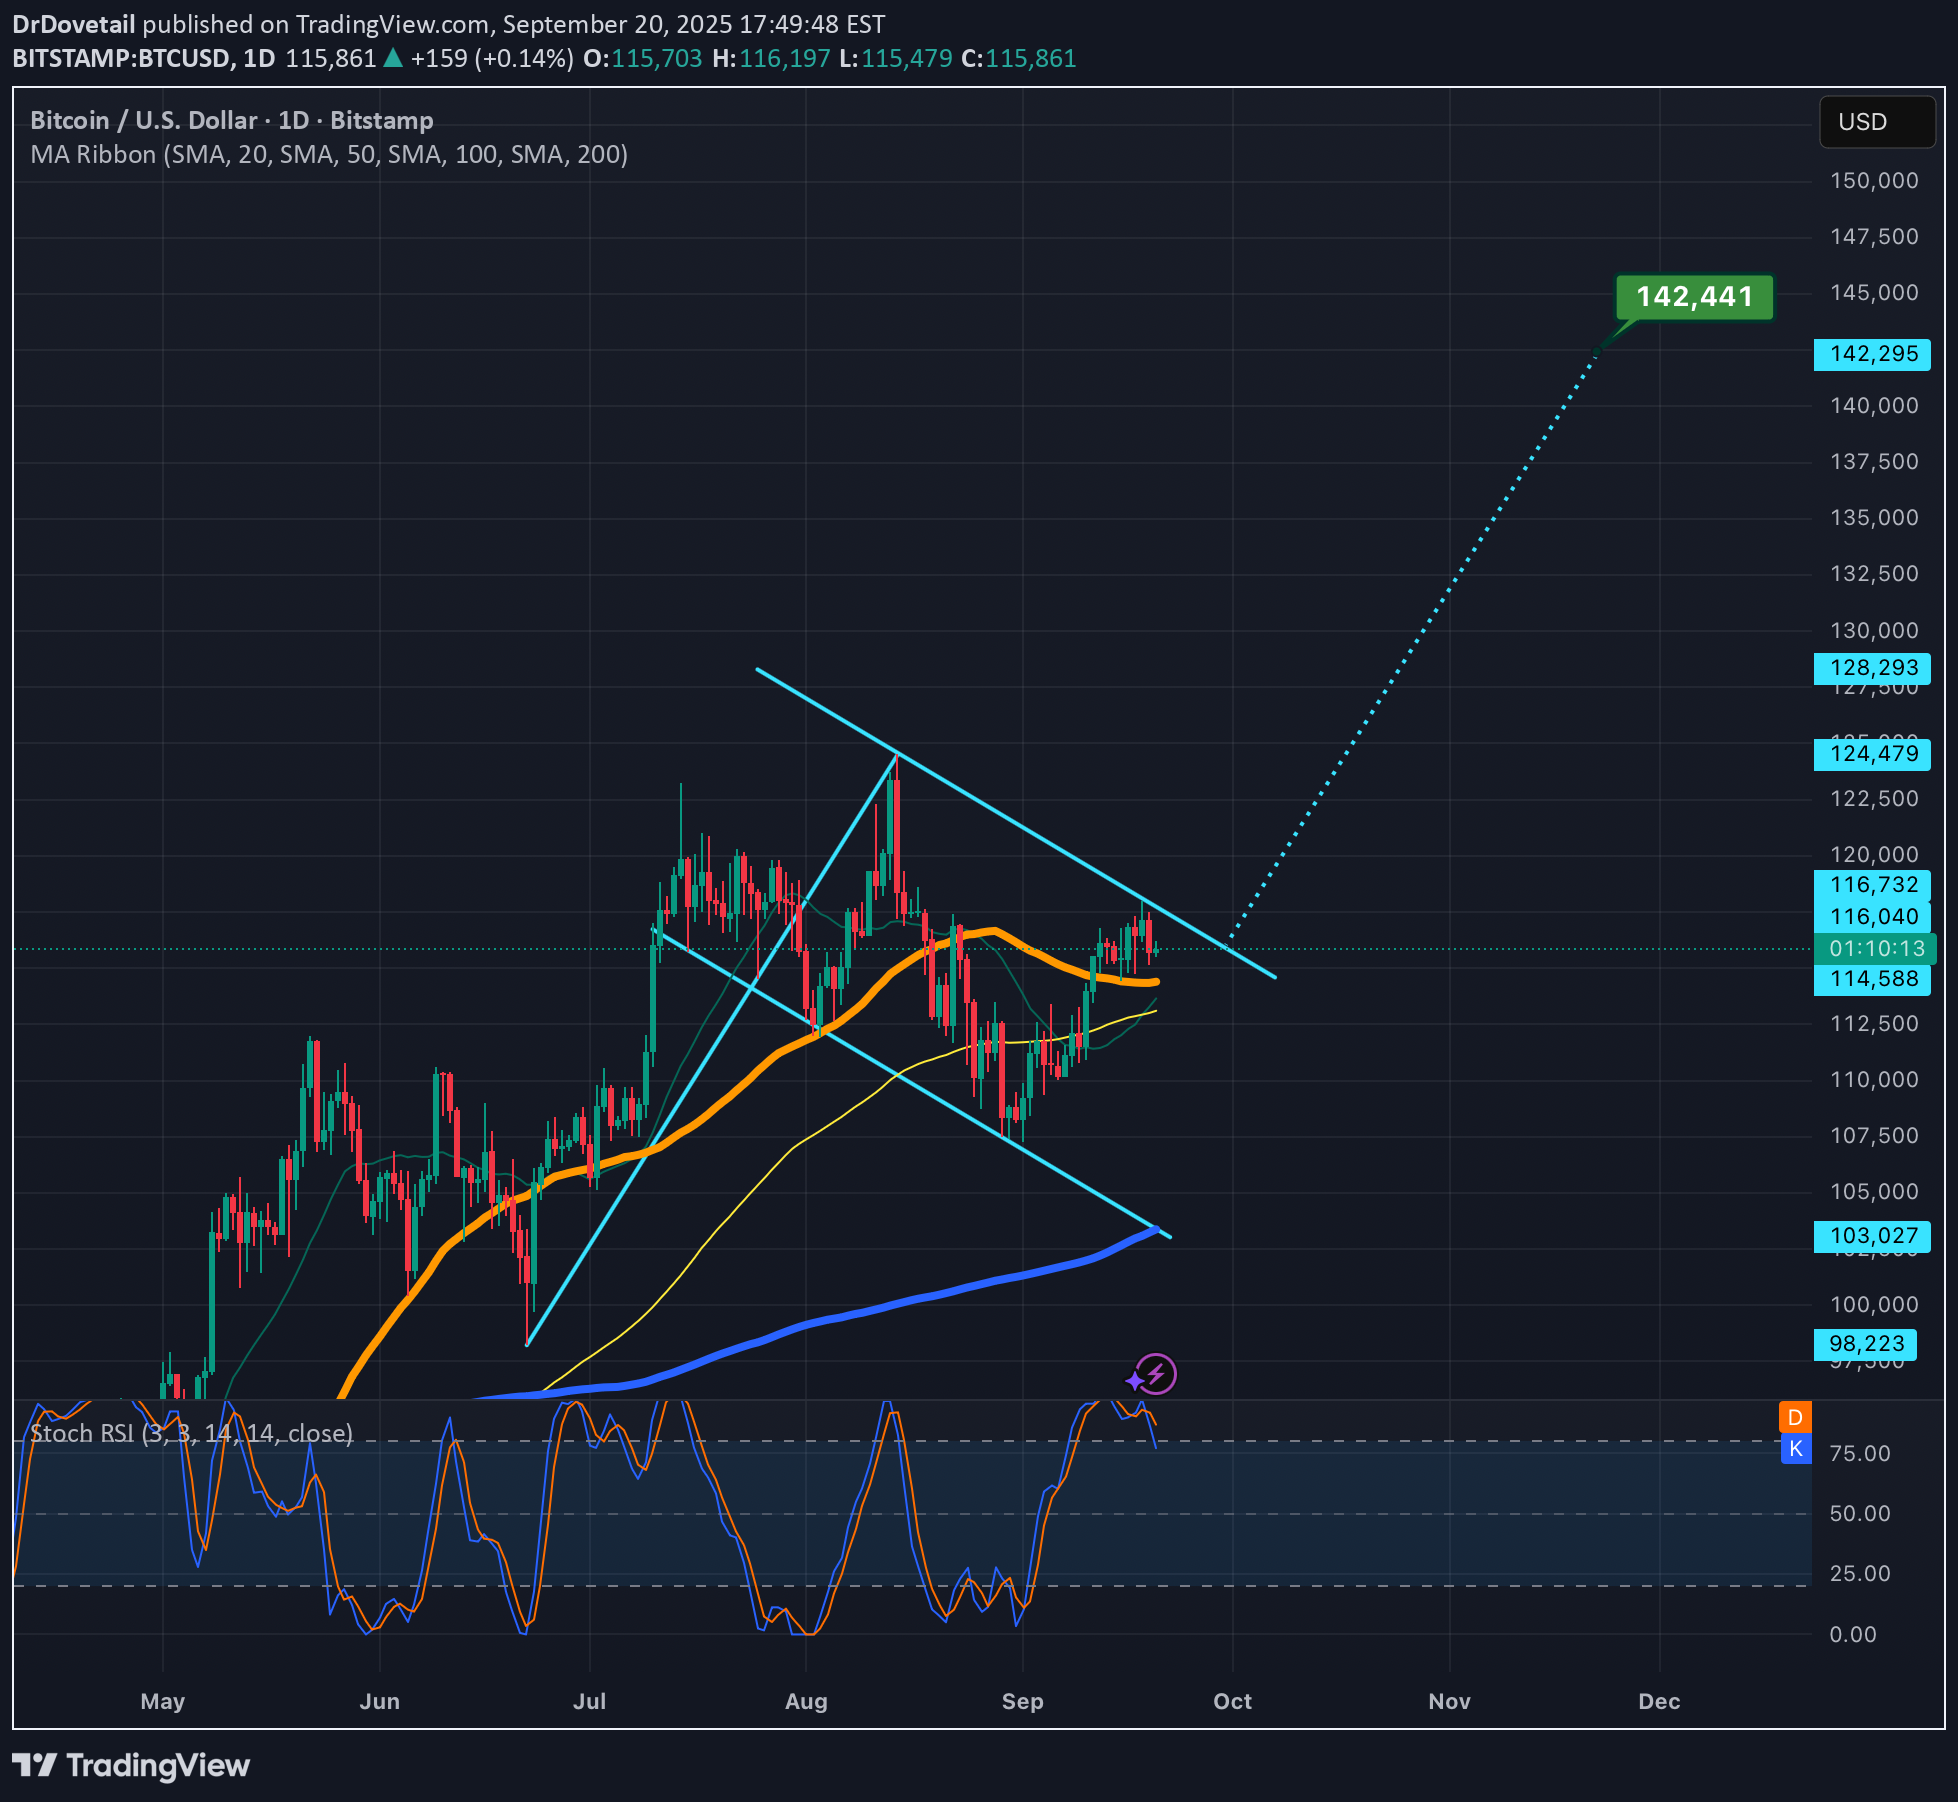
The pole looks more obvious on longer timeframe charts but the flag/ channel itself is best illustrated on the 1day time frame. In fact there is a much longer pole than the one shown here on the monthly chart, but I didn’t go with that one because the flag on the monthly is more of a horizontal channel than the descending channel shown here on the 1day chart. *not financial advice*
DrDovetail
Near moving above invh&s w/ a double bottom neckline just above
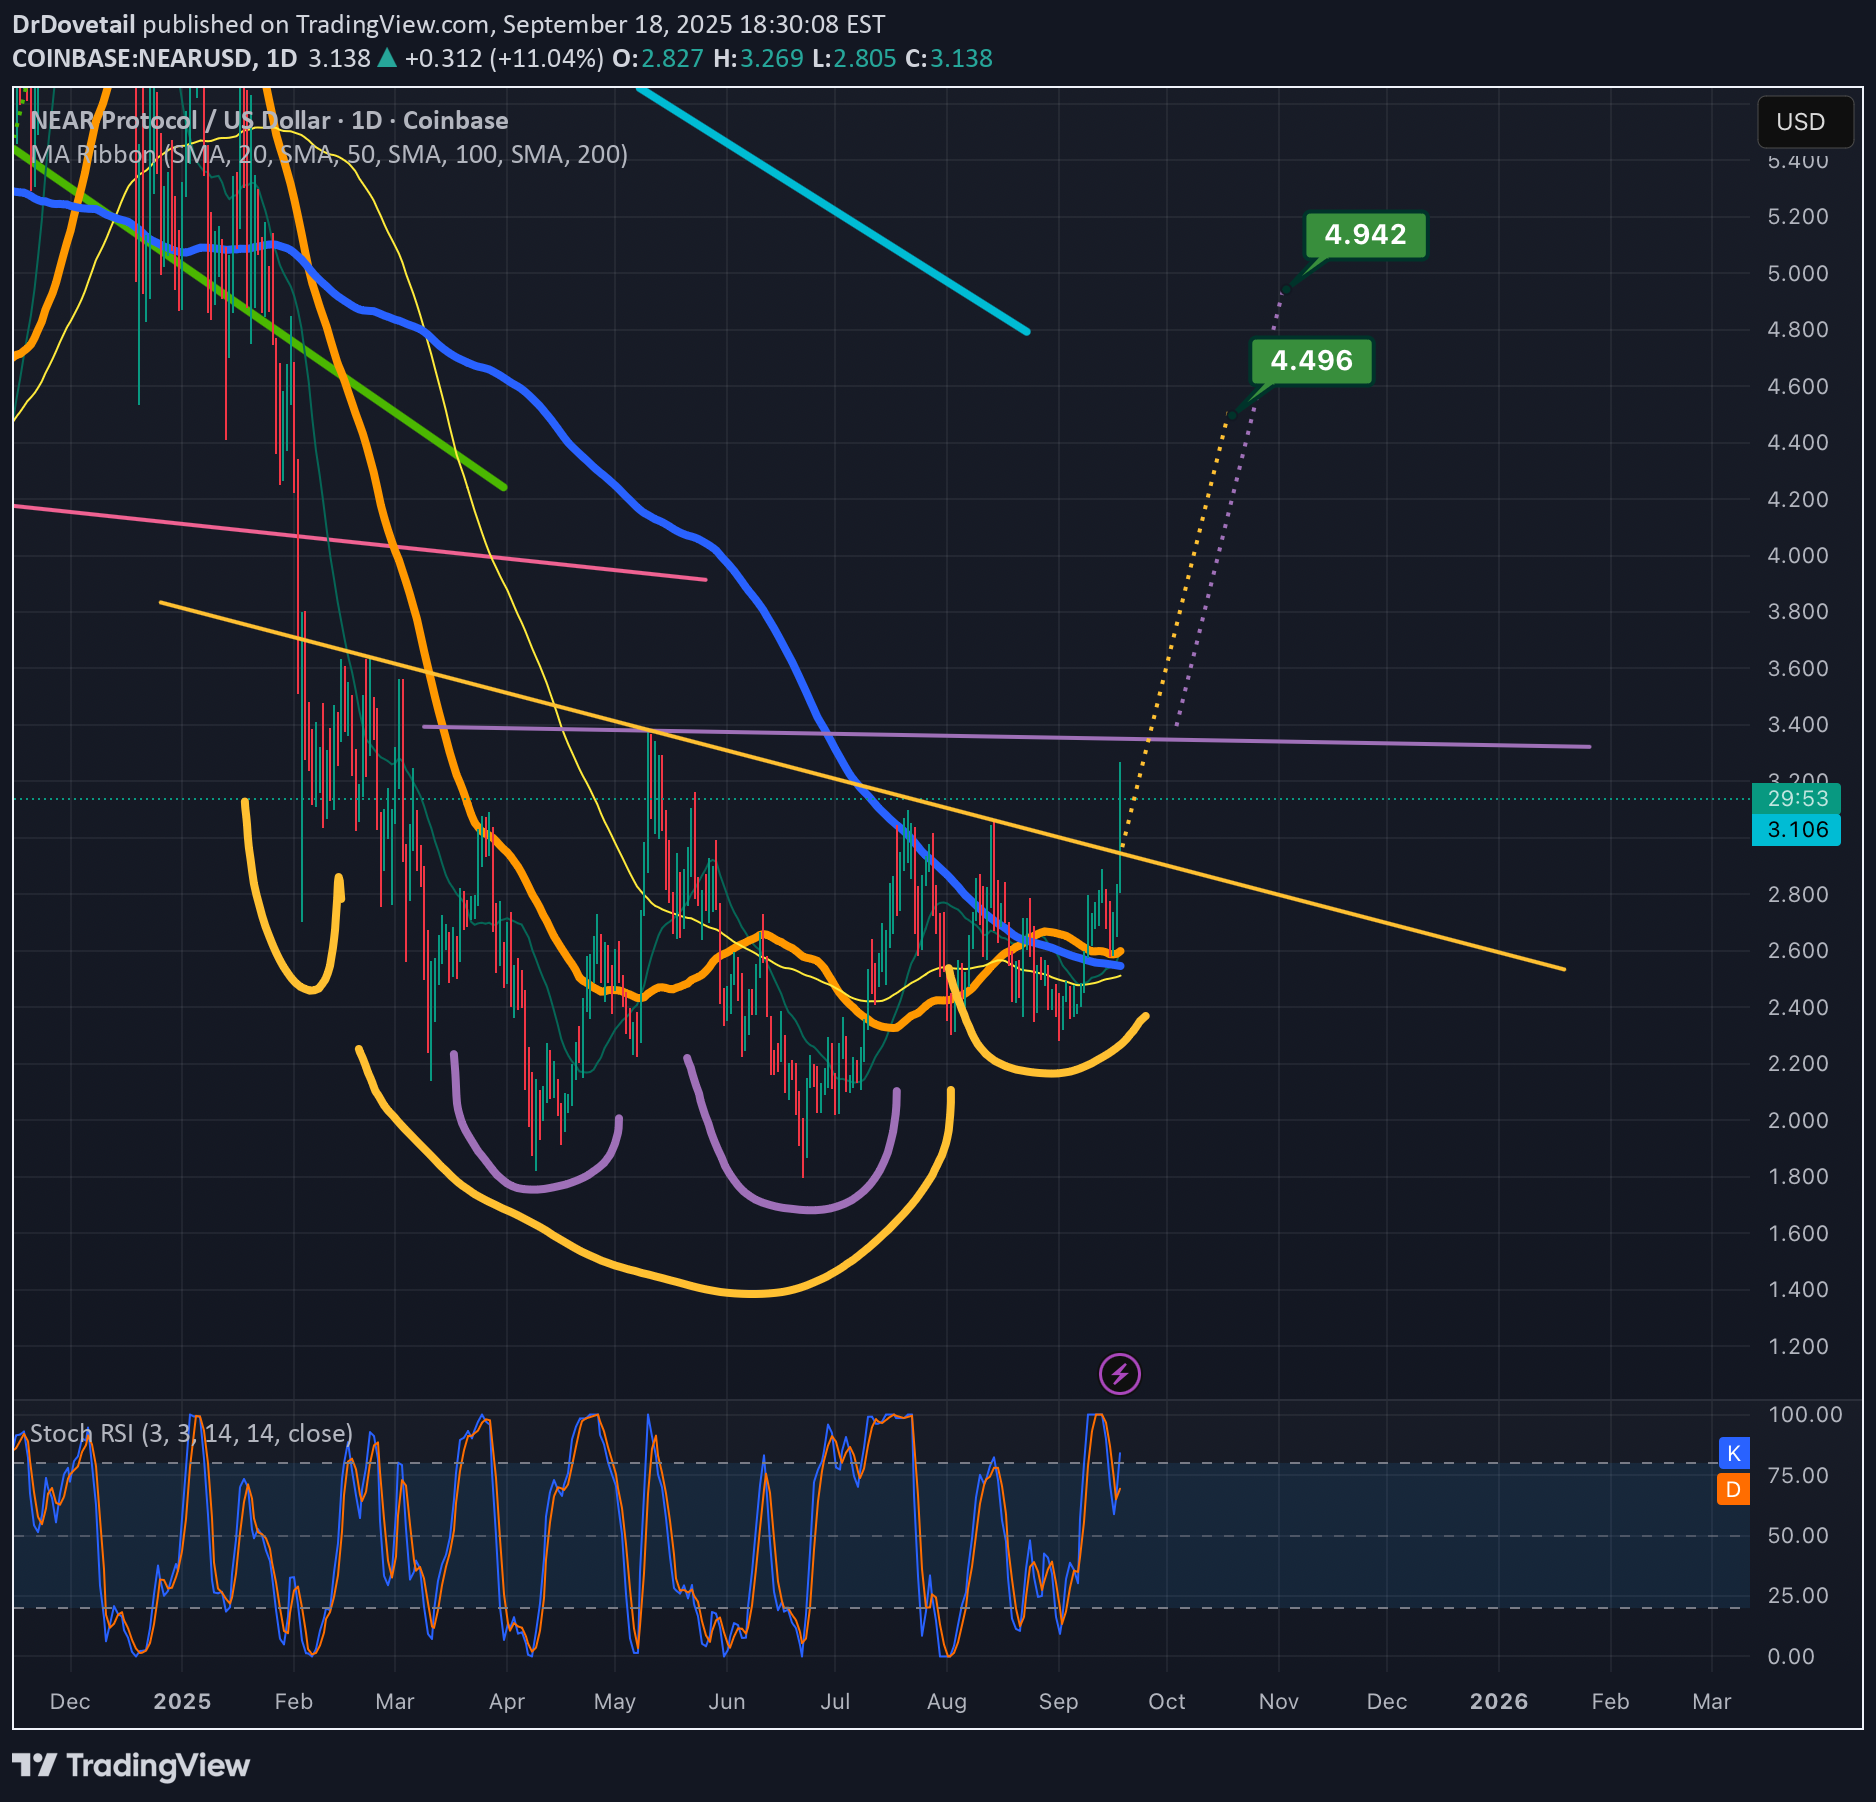
The inverse head and shoulders breakout not yet fully confirmed, but price is currently comfortably above its neckline. In hitting the inverse head and shoulders full target, it should also validate the double bottom breakout as well. *not financial advice*
Disclaimer
Any content and materials included in Sahmeto's website and official communication channels are a compilation of personal opinions and analyses and are not binding. They do not constitute any recommendation for buying, selling, entering or exiting the stock market and cryptocurrency market. Also, all news and analyses included in the website and channels are merely republished information from official and unofficial domestic and foreign sources, and it is obvious that users of the said content are responsible for following up and ensuring the authenticity and accuracy of the materials. Therefore, while disclaiming responsibility, it is declared that the responsibility for any decision-making, action, and potential profit and loss in the capital market and cryptocurrency market lies with the trader.