
Dee9549
@t_Dee9549

What symbols does the trader recommend buying?
Purchase History
پیام های تریدر
Filter
XAUUSD

Resistance Zone (Red Box at the Top): The highlighted red area at the top represents a resistance zone. This is where the price has previously struggled to move higher and has reversed multiple times, indicating strong selling pressure at this level. Support Levels (Horizontal Red Lines Below): There are multiple horizontal red lines drawn below the price, which indicate support levels. These levels are where the price has previously found buying interest, preventing it from falling further. Current Price Action: The price trades near the resistance zone (around 2,703–2,712), showing consolidation or hesitation to break higher. A rejection from this level could lead to a retracement toward lower support levels. Trend Direction: The overall trend appears to be bullish as the price has been forming higher highs and higher lows from the left-hand side of the chart (mid-November). Key Levels: Resistance: Around 2,710–2,720 (area of strong selling pressure). Support: Levels such as 2,680, 2,660, and lower levels are marked on the chart. Market Sentiment: The chart indicates that bulls are attempting to increase prices, but sellers are actively defending the resistance zone. A breakout above this zone could indicate further upward momentum, while rejection might lead to a pullback. Specific Signals to Watch Bullish Buy Signal: A breakout above 2,710–2,720 with strong candles. A dip to 2,680 or lower with clear rejection candles. Bearish Sell Signal: Rejection at 2,710–2,720 with bearish candles. A breakdown below 2,680 with no signs of recovery. To determine the ideal times to buy or sell based on this chart, you can use the following guidelines: Buying Opportunities On a Pullback to Support Levels: Look to buy near support zones (e.g., 2,680, 2,660) where the price has shown previous buying strength. Confirmation: Wait for bullish reversal candlestick patterns (e.g., hammer, engulfing candles) or signs of increased volume. On a Breakout Above Resistance: If the price breaks above the resistance zone (2,710–2,720) with strong momentum (e.g., large green candles, high volume), it could signal continuation of the uptrend. Consider buying after the breakout and on a retest of the broken resistance (now support). Trend Following: Since the overall trend appears bullish (higher highs and higher lows), you could look for buying opportunities on dips in the uptrend. Selling Opportunities At Resistance Zones: If the price reaches the resistance zone (2,710–2,720) and starts showing bearish rejection patterns (e.g., shooting star, bearish engulfing), consider selling, expecting a pullback. This is a counter-trend trade, so it carries higher risk. On a Breakdown of Support: If the price breaks below a key support level (e.g., 2,680), it may indicate further downside. Consider selling after the breakdown and on a retest of the broken support (now resistance). Trend Reversal: If the price forms lower highs and lower lows or breaks below critical support zones, it may signal a trend reversal to bearish, presenting selling opportunities. Specific Signals to Watch Bullish Buy Signal: A breakout above 2,710–2,720 with strong candles. A dip to 2,680 or lower with clear rejection candles. Bearish Sell Signal: Rejection at 2,710–2,720 with bearish candles. A breakdown below 2,680 with no signs of recovery. Risk Management Stop Loss Placement: For buying trades, place your stop loss slightly below the most recent support. For selling trades, place your stop loss slightly above the resistance zone. Take Profit: For buys, aim for levels slightly below the next resistance. For sells, target levels slightly above the next support. Risk-to-Reward Ratio: Always aim for a minimum of a 1:2 risk-to-reward ratio to ensure profitability over time.
Gold

This phenomenon can also be seen in range (sideways movement), when the price goes beyond its limits and then turns around impulsively in the opposite direction. This phenomenon is called deviation
Gold

On the H1, XAUUSD has formed a descending triangle pattern, and the price is squeezed to support corresponding to 161.8 Fibonacci. The indicators do not give clear signals, making considering two possible scenarios necessary. 🔽 If the bears push the Gold below the support at 2415, the downside target will be 2395; 🔼 However, if the upper trend line is broken, the price may reach the resistance of 2440;
ENAUSDT
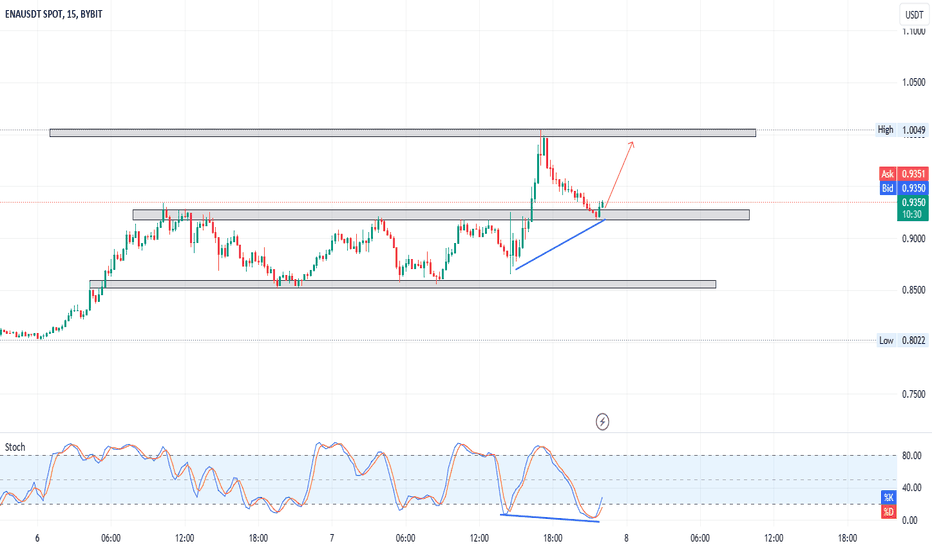
We have retest on a resistance level and divergence and oversold
Disclaimer
Any content and materials included in Sahmeto's website and official communication channels are a compilation of personal opinions and analyses and are not binding. They do not constitute any recommendation for buying, selling, entering or exiting the stock market and cryptocurrency market. Also, all news and analyses included in the website and channels are merely republished information from official and unofficial domestic and foreign sources, and it is obvious that users of the said content are responsible for following up and ensuring the authenticity and accuracy of the materials. Therefore, while disclaiming responsibility, it is declared that the responsibility for any decision-making, action, and potential profit and loss in the capital market and cryptocurrency market lies with the trader.