
David_strategy
@t_David_strategy

What symbols does the trader recommend buying?
Purchase History
پیام های تریدر
Filter
David_strategy
11.18 Russia-Ukraine Conflict Gold US Market Analysis and Operat

The current heavy pressure area of gold is concentrated in the 2600-2620 area. The market is volatile and the position of the card point may not be very accurate, but it does not affect the judgment and grasp of the rhythm. After the rapid decline last week, gold continued to fluctuate sideways without breaking a new low. The essence of the rebound is that there will be further declines, and gold has not bottomed out in a large cycle. Therefore, the next 2600 mark is another opportunity to arrange short orders, rather than chasing longs. The daily chart is still short, so after the short-term rebound is in place, it will start a new low decline. Even if it does not break a new low, it will fall back again to bottom out. SELL: 2598 2602 Stop loss: 2608 2612 $1: 2585 $2: 2575 $3: 2560
David_strategy
11.18 Gold breaks through the negative line, bulls profit

The gold market fell strongly last week. The market opened at 2684.7 at the beginning of the week, and then rose slightly to 2687.1, and then fell strongly. Under the pressure of negative fundamental factors and the resonance of technical profit-taking, it fell below multiple supports. The weekly line reached a low of 2535.7, and then the market was oversold and consolidated. The weekly line finally closed at 2561.5, and then the market closed with a long shadow line. After such a pattern, the market still has a need to fall back this week, but the short-term market pattern has already signaled an oversold point. If it falls back to a low point at the beginning of the week, you still need to prepare long orders. In terms of points, today's 2561 long stop loss is 2556, and the target is 2578 pressure. If it breaks, look at 2585, 2592 and 2600 pressure.There is no shortcut to success. Only by following a professional team can you make the right choice. The first order on Monday closed with a profit of 20K.
David_strategy
Gold 11.11-11.15 profit summary
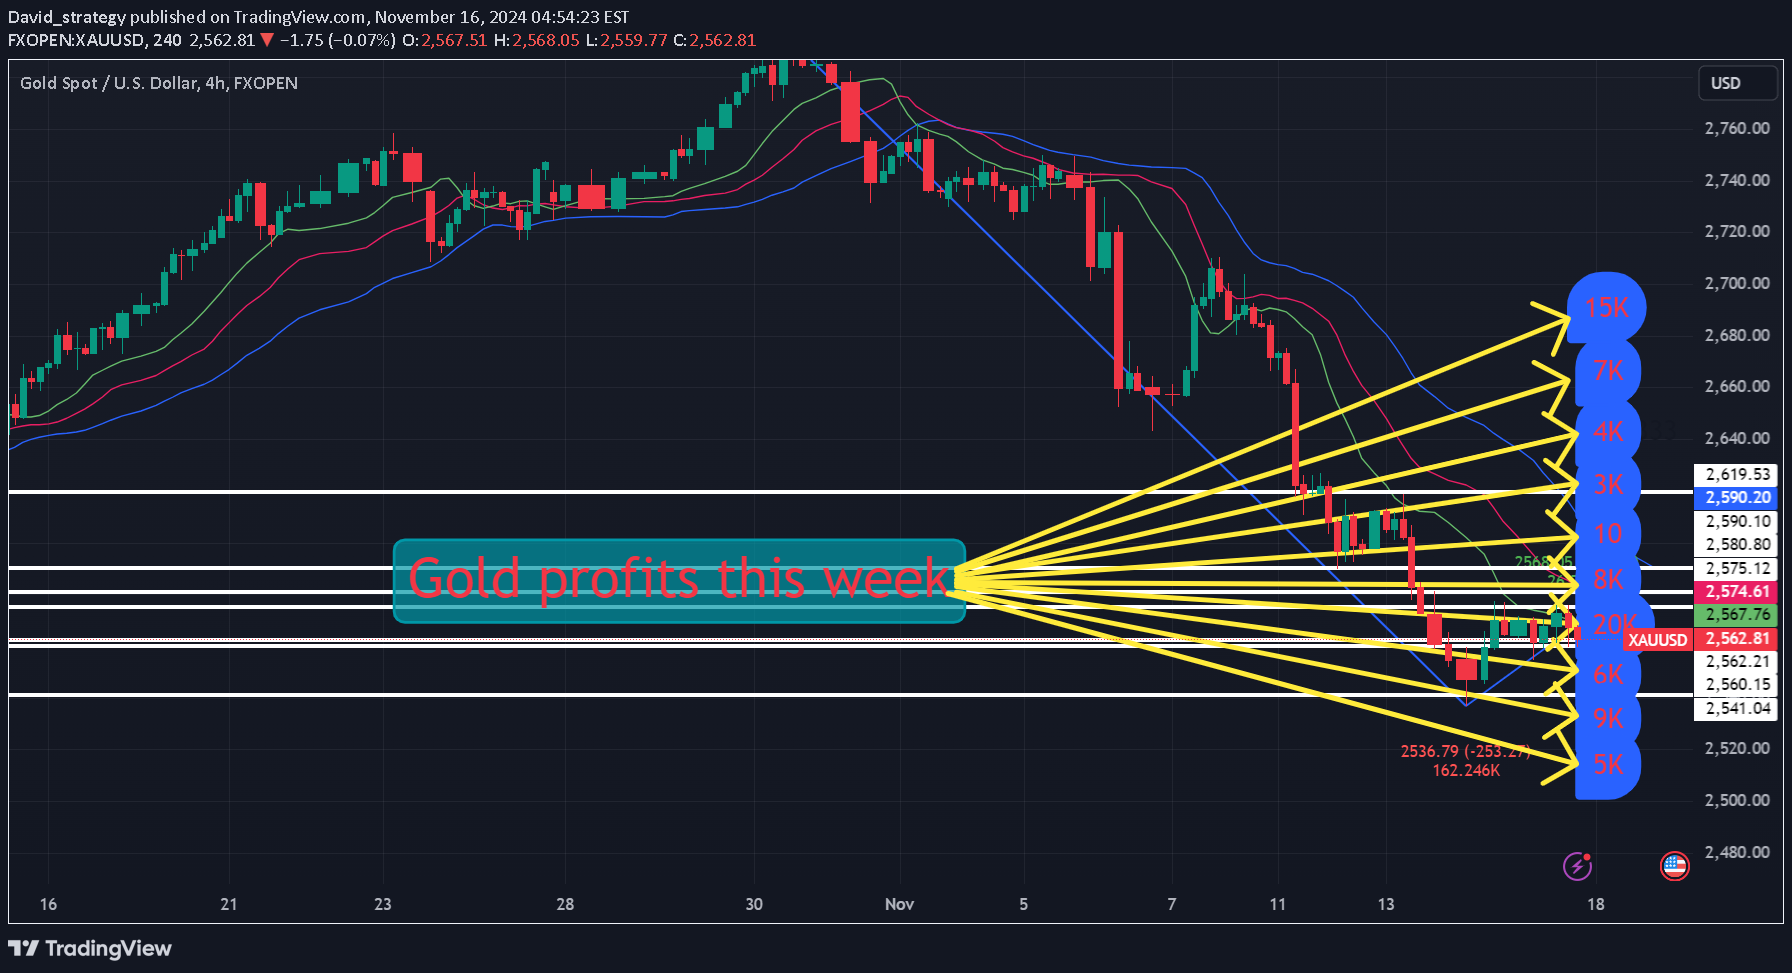
This week, through the efforts of all analysts on the team, we have exceeded the set profit target. We also congratulate our members and brothers for following us and expanding their own assets. Finally, I wish all brothers a happy weekend.Your profit comes from other people's losses. That is to say, when someone makes a mistake, there will be profits in the market, but you can't calculate or predict how many people will make mistakes next, how big the mistakes will be, and you can't guarantee that you are on the right side every time. So, in trading, the only thing you can do is to make the mistakes as short as possible when you make them. Join my team and I will guide you on the correct trading strategy.
David_strategy
11.15 Gold 50 stopped falling and turned to shock

On November 14, the gold market bottomed out and pulled up. It opened at 2572.8 in the morning and then pulled up to 2581.7. Then the market continued to fall back. The daily line reached 2536.5 as the lowest point. Then the market rebounded strongly and pulled up. The daily line finally closed at 2564.7. Then the market closed in a hammer pattern with a very long lower shadow. After this pattern ended, the daily line initially bottomed out. The market has technical needs to rebound today. In terms of points, today's 2552 long conservative 2550 long stop loss 2546, if it falls below 2550 long stop loss 2535, the target is 2565, 2572 and 2582, if it breaks, it is 2593 and 2602-2610.SELL: 2570 Target: 2550 BUY: 2550 Target 1: 2565 Target 2: 2575 Target 3: 2585618 on the upper side is at 2584. Even if it opened yesterday, it was at 2584, but this is a continued decline, not a double top, so the resistance is still at 618. Now, 20 US dollars is far away. As for the lower side, the US market rose and went sideways in the early morning. The current position is looking for support. Even if it breaks through and falls back, it is at 2550. And 618 is at 2552-3.69 to 62, take profit first, profit 7kThe last two orders of this week have been closed, with a profit of 7K. The total profit today is 14K. This week's target has been exceeded. Thanks to the efforts of the team brothers for such a generous return.
David_strategy
11.15 Technical guidance for short-term gold operations

From the technical chart, gold prices fell below the key support level of $2,600 on Wednesday night, which coincides with the 38.2% Fibonacci retracement line of the June-October rally. This break provides a new sell signal for the bears. The current oscillator on the daily chart remains in the negative zone, showing that the bears are still dominant. It is expected that the downward pressure on gold prices will continue, targeting the support range of $2,542-2,538. This area includes the 100-day simple moving average (SMA) and the 50% Fibonacci retracement line. Once this support is broken, the price of gold may further fall to the psychological level of $2,500. In the short term, gold may continue to fluctuate around $2,550. If it falls below the $2,500 mark, the bears may seek deeper downside space. However, considering the current global market environment, if gold can stabilize in the $2,540-2,550 area and stop falling and rebound, it may bring some buying power. Therefore, market participants should pay close attention to the Fed's policy guidance, inflation data and global risk events, and adjust strategies in a timely manner to cope with short-term market fluctuations Intraday short-term operations: SELL: 2580 Defense: 87----90 Target: 2560------50Insisting on profitability is the only criterion of strength. Never make ambiguous analysis. I have my own trading style. Followers have never failed in the past year. Others have been on the bus for a long time, but you are still hesitating whether to cross the red light. Hesitation will lead to failure. Follow my pace and reap wealth.
David_strategy
11.14 daily line big negative breaks support

Yesterday, the gold market opened at 2598.6 in the morning, and then the market rose. The daily line reached a high of 2619.3, and then the market fell rapidly. The daily line reached a low of 2572.8, and then the market closed with a long upper shadow line. After this pattern ended, the daily line effectively broke the current upward trend. Today's market has a need to continue to fall. In terms of points, the stop loss of yesterday's 2588 short position was followed up at 2590. Today's 2585 short stop loss is 2590. The lower targets are 2572, 2565 and 2561. BUY:2555 2550 Defense:2540 $:2560 2570 2580The largest single order profit this week appeared, with a profit of 21K Brothers are so awesome
David_strategy
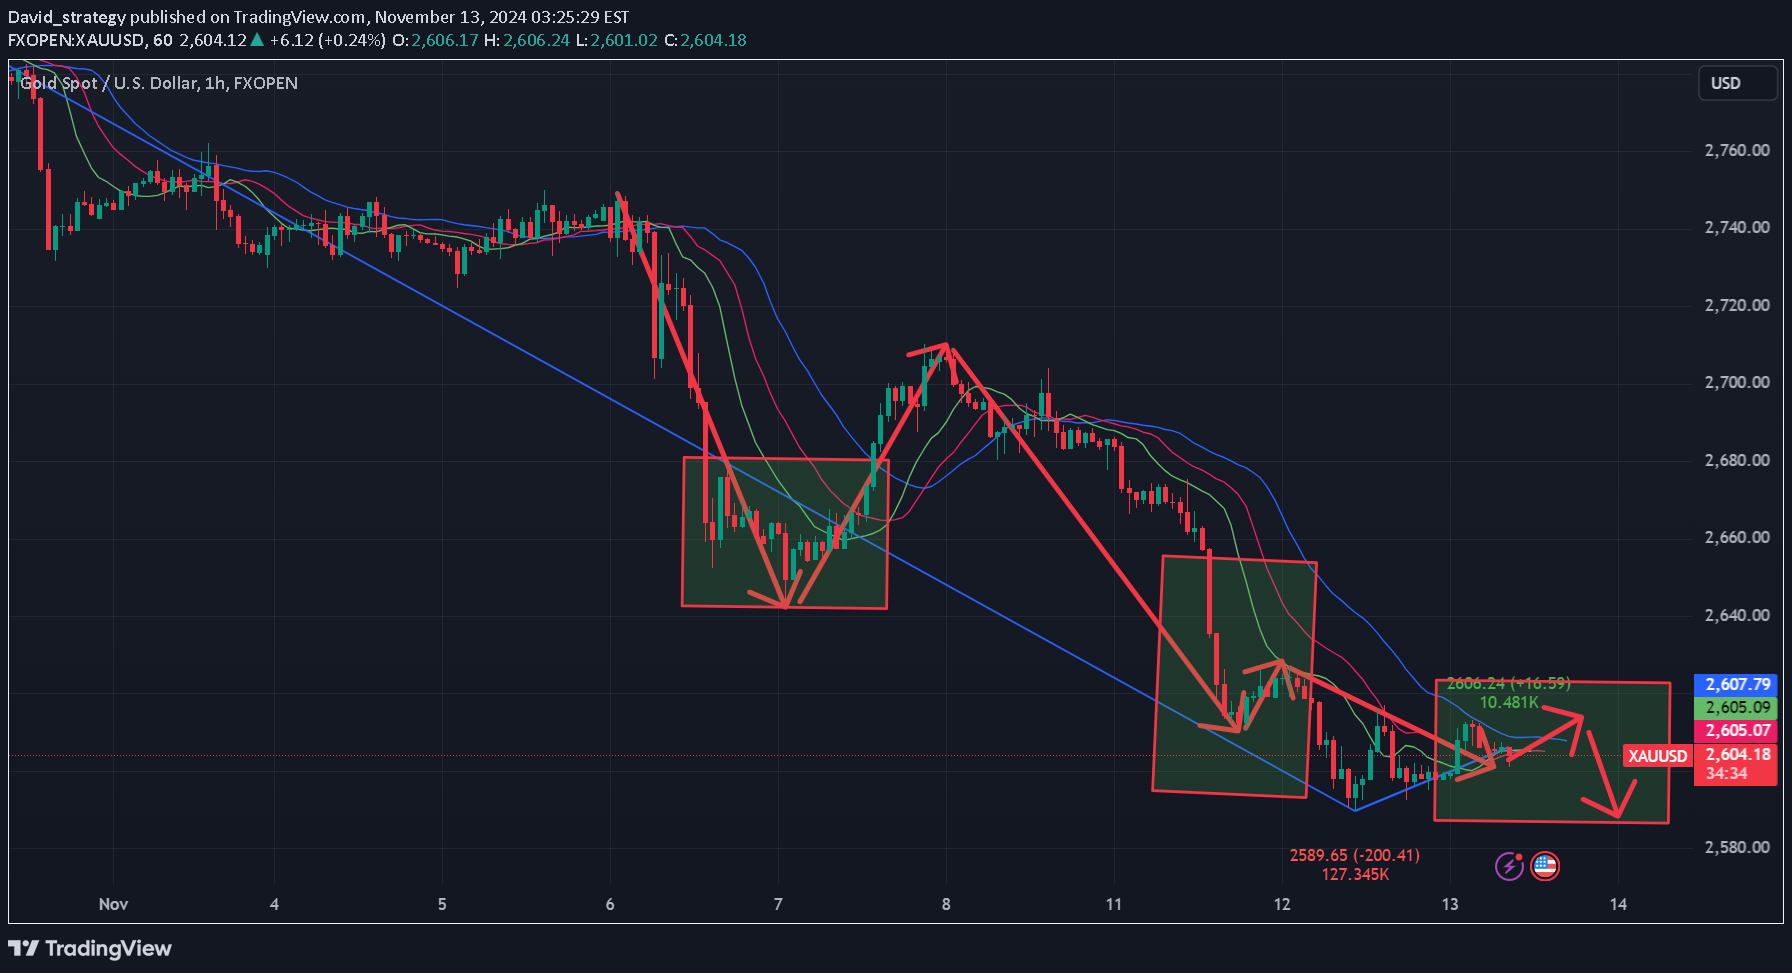
11.14 Analysis of short-term gold operations

Gold Technical Analysis On the daily chart, gold is currently trading near a key trendline near $2,600. Buyers enter here with a clear risk below the trendline to position for a rally to new highs. On the other hand, sellers would like the price to break below this level to increase bearish bets, targeting the next trendline support around $2,550. On the 4-hour chart, a stronger support around $2,600 can be seen more clearly, with the support zone formed by the previous swing low and the trendline together. There is also a downward trendline currently defining the existing bearish momentum. In the event of a pullback, sellers may use this opportunity to position to push the price below the primary trendline; while buyers will look for an upward breakout to increase bullish bets and challenge new highs. On the 1-hour chart, there is another secondary downward trendline defining the bearish momentum in this timeframe. More aggressive sellers may position here to push the price below the primary trendline; while buyers will look for a breakout to the upside to target a pullback to the next downward trendline.SELL: 2590 Defense 2600 Target: 2580 2570The first goal has been achieved and the profit is 10 points.
David_strategy
11.13 Gold Trend Looks at CPI Data
Yesterday, the gold market opened at 2619.5 in the morning, then rose slightly to 2627.6, then fell strongly. The daily line reached a low of 2588.8, then rose, and then fluctuated in the range. The daily line finally closed at 2598, and then the market closed with a middle-yin line with an upper shadow slightly longer than the lower shadow. The 1-hour short-term continued to move down from the high point and lose the low point. After the rebound last night, it fell back and stopped near 2696. The focus of the short-term short position is not 2590, but the breakthrough of the two key points of 2617/2627. Intraday data reference: US October unadjusted CPI annual rate US October seasonally adjusted CPI monthly rate BUY:2585 2580 Defense:2575 2770 Target:2605 2615 2620 2630
David_strategy
11.12 Gold Asian Market Operation Ideas!!!
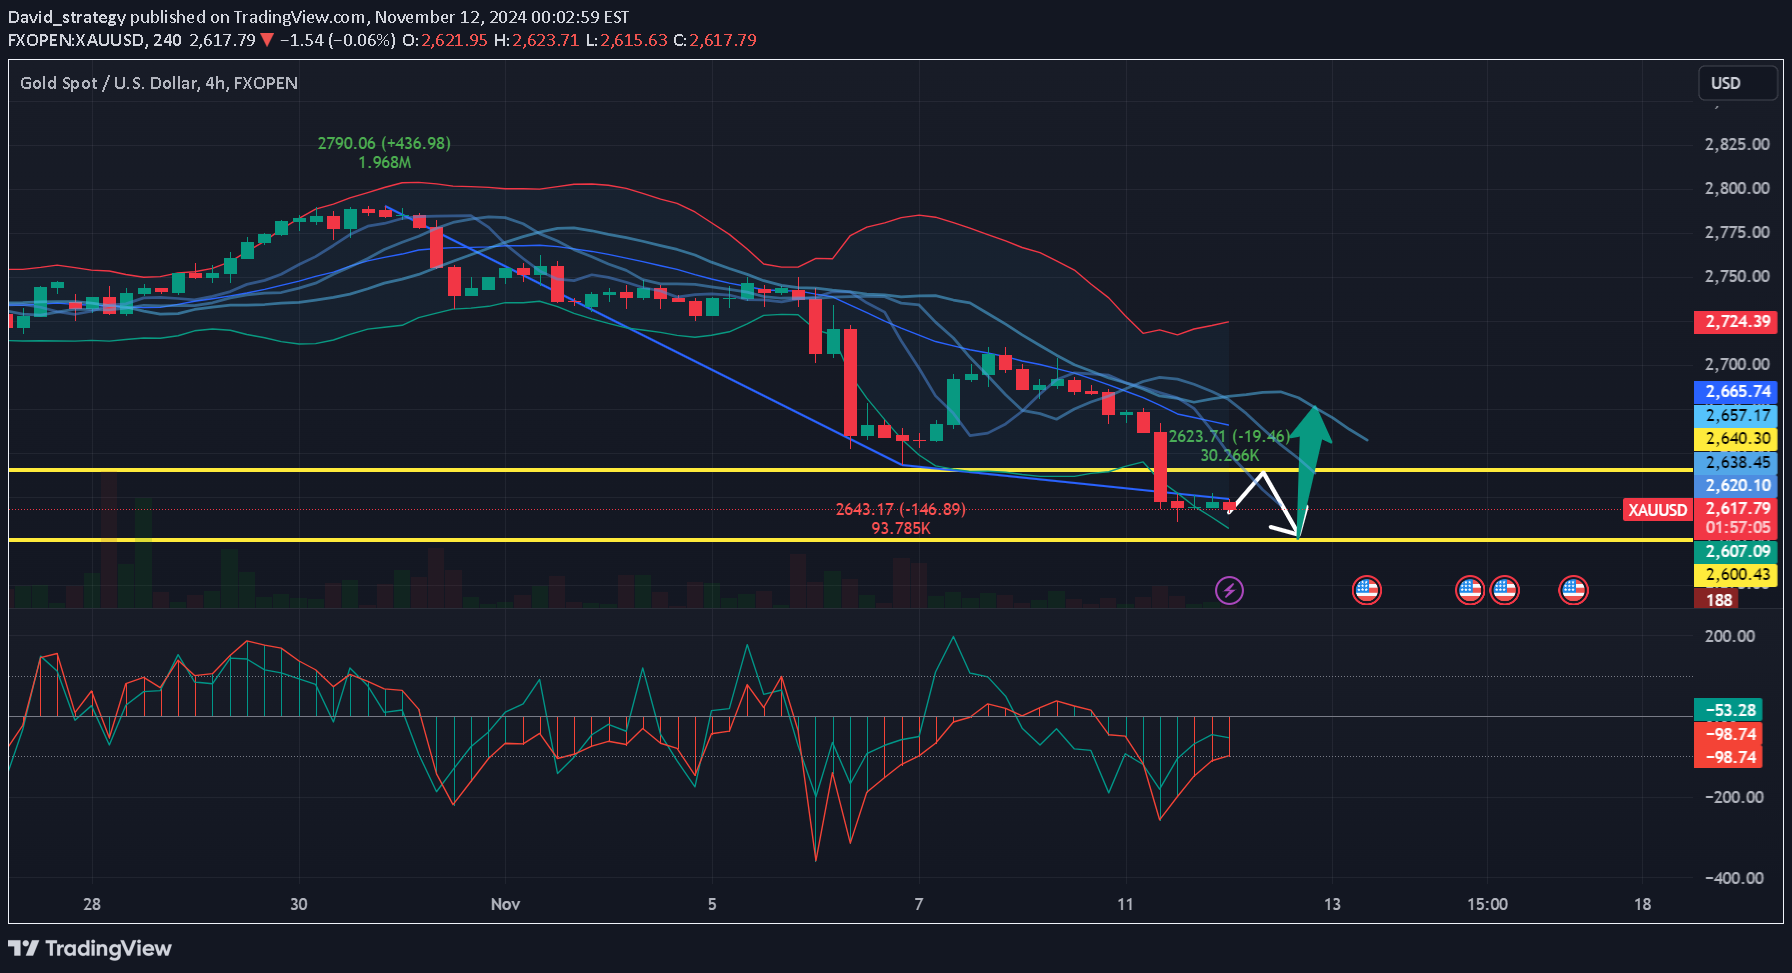
Yesterday, the gold market opened at 2684.8 in the morning, then rose slightly to 2686.3, then fell back strongly. The daily line reached a low of 2609.5, then the market was oversold and consolidated. The weekly line finally closed at 2619.4, and the market closed with a long shadow line. After this pattern ended, today's market still needs to be adjusted! ! ! ! BUY: 2605 2600 Defense: 2590 Target 1: 2620 Target 2: 2630 Target 3: 2640 SELL: 2640 2645 Defense: 2652 Target 1: 2630 Target 2: 2620Gold is still running at a low level today. The operation has not bottomed out yet. Brothers and sisters should enter the market cautiously.
David_strategy
11.8 Gold fluctuates slightly sideways, with a big downside

On Friday (November 8) in the European session, the spot gold price rebounded above the 2690 mark and was last traded at $2690.56/oz. The impact of the decline in US Treasury yields Against the backdrop of the Fed's interest rate cuts, US Treasury yields fell further, providing some support for gold. However, given the optimistic overall risk sentiment in the market, the rebound momentum of gold is still not strong. Although the gold price has returned to near the 50-day moving average, the overall trend is still under pressure. From a technical point of view, the gold price has returned to above $2690/oz, but its rebound was blocked when it approached 2718 (50% Fibonacci retracement level). If this resistance can be effectively broken, gold is expected to continue to test $2734/oz (61.8% Fibonacci retracement level). If there is continued buying in the future, it may indicate that the previous correction has ended, and gold may further attack the static resistance level of $2750/oz, or even hit the 2758-2790 area.SELL:2692 Target:2680----70
Disclaimer
Any content and materials included in Sahmeto's website and official communication channels are a compilation of personal opinions and analyses and are not binding. They do not constitute any recommendation for buying, selling, entering or exiting the stock market and cryptocurrency market. Also, all news and analyses included in the website and channels are merely republished information from official and unofficial domestic and foreign sources, and it is obvious that users of the said content are responsible for following up and ensuring the authenticity and accuracy of the materials. Therefore, while disclaiming responsibility, it is declared that the responsibility for any decision-making, action, and potential profit and loss in the capital market and cryptocurrency market lies with the trader.