
David_Perk
@t_David_Perk

What symbols does the trader recommend buying?
Purchase History
پیام های تریدر
Filter
David_Perk
رمز موفقیت در ترید: چرا سیستم مکانیکی و آمار، کلید غلبه بر ذهنیت بازنده است؟
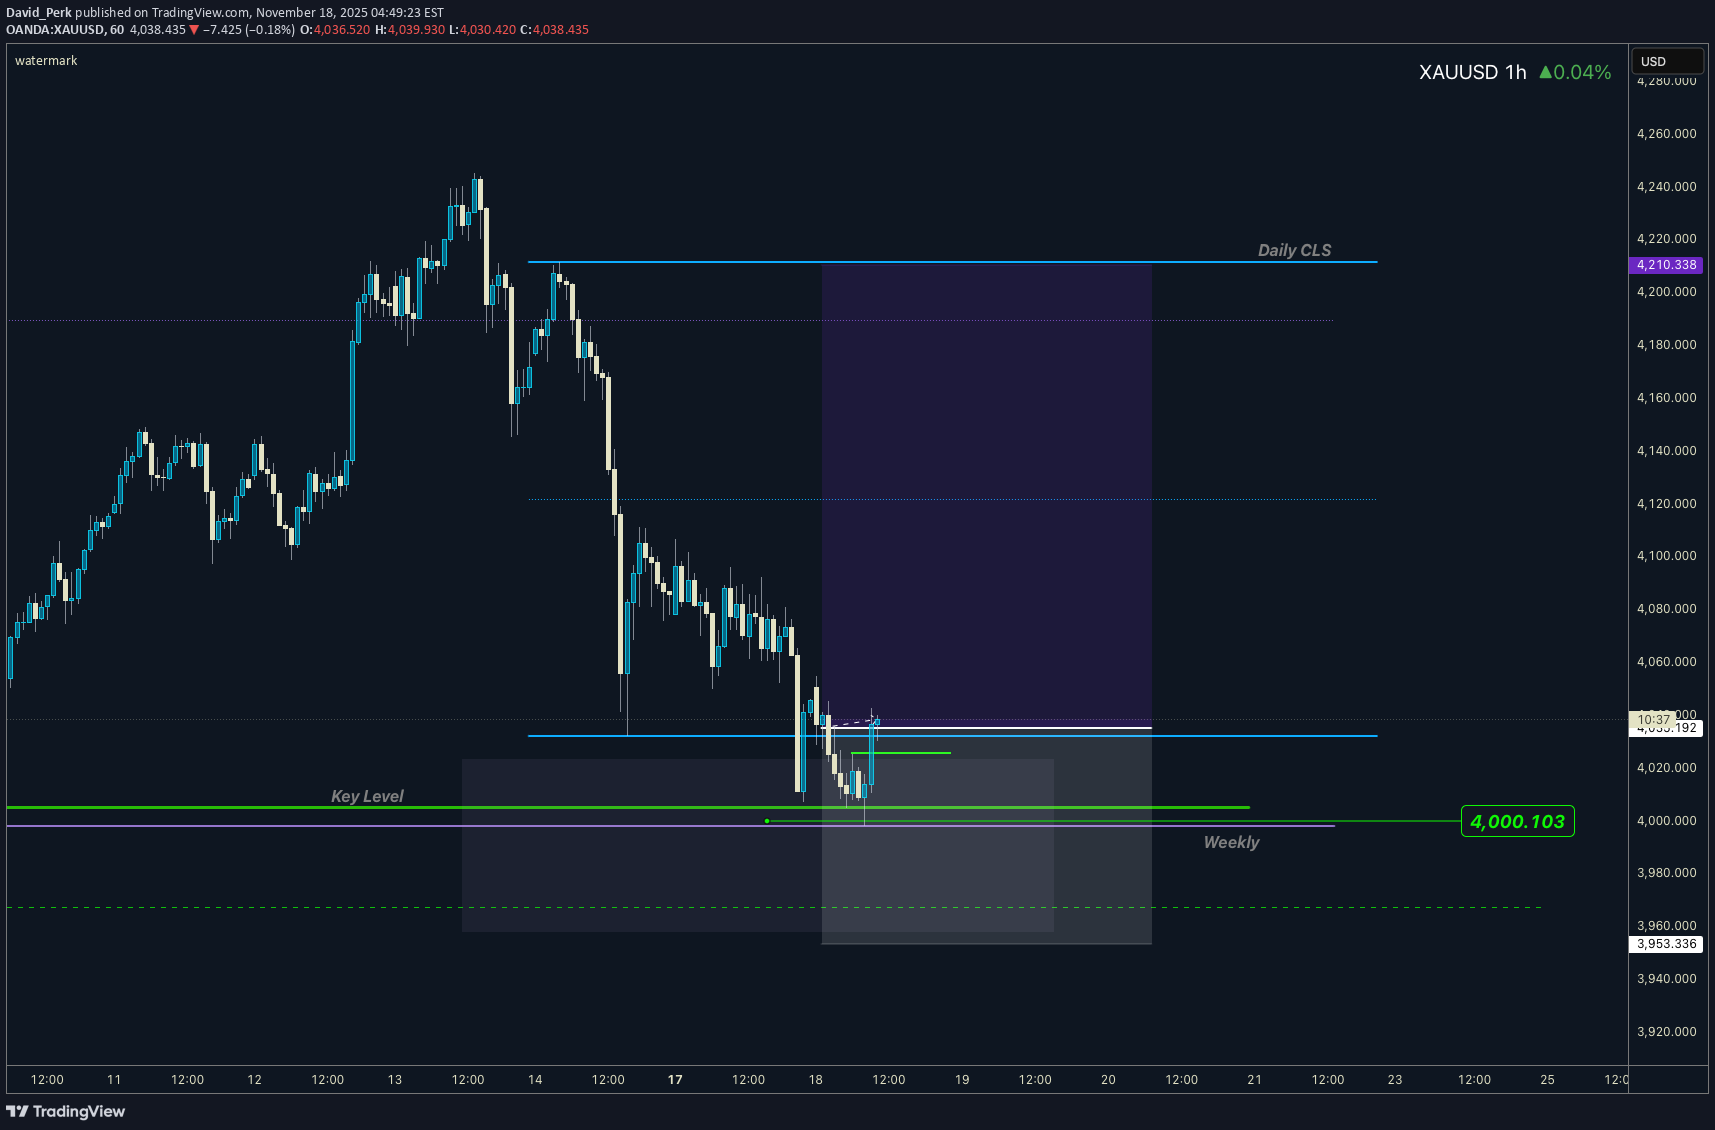
Hi friends, new range created. As always we are looking for the manipulation in to the key level around the range. Don't forget confirmation switch from manipulation phase to the distribution phase to make the setup valid. Stay patient and enter only after change in order flow. If price reaches 50% of the range take partial or full close. 📌 HTF - Higher Timeframe view 🧩 Complete proces and Strategy explained 👇 Click Below 🎯 Why your market approach also should be mechanical ? NO Fixed Mechanical Trading Logic - You are guessing random patterns NO Defined trading plan - Every trade different logic NO Same logic in each trade - Not possible to backtest NO Backtests on at least 300 trades - Not knowing Statistics ➡️ No Statistics ➡️ No Edge ➡️ Mindset ProblemS 🧠 Core of mindset problems If you don't know your statistics on large enough data sample. You don't know your probabilities of win rate once the losing streak happen and it happens to every strategy. You will start doubting, hesitating to take next trade because you don't know statistics of your losses. In the end you will be doubting strategy and then jump to different one. You will be in the endless loop for years, looking for new better strategy. 👊 Your ultimate goal as a trader is not to be a generalist who knows 10 000 patterns. But rather create one system with narrowed criteria of each element of the trade to remove subjective and emotional decisions as much as possible and stick to this system no matter what. Practice it 10 000 times become a MASTER. ✨ Trading Mastery is reflection of your life Have a longterm plan, No Alcohol & Drugs, Ignore others, Focus on your journey , Backtest regularly, Review your weeks, Journal mistakes, Exercise, Sleep well, Read books, Walks in nature (no phone) , Meditate, Reduce social media time, Spend time with family, Live Life. Trading is hard, but not impossible. I believe in you 💪 David Perk aka Dave Fx Hunter
David_Perk
راز کشف پول هوشمند: استراتژی ساده معامله برگشت روند با کندلها
Hey whats up trader, in the last post we determined Daily Bias in the Trending conditions. Now let's have a look to the reversal conditions. We will look at the Daily bias, but as I mentioned this many times in my posts - price is fractal so you can use this at any timeframe. But, If I can give you recommendations look for Higher timeframe bias on Daily and Weekly and H4 / H1 Structure and M15 entries. ⁉️ Where is the liquidity ? Always follow the Daily / Weekly candle close. Before I will show you my reversal pattern lets look first at how price stays in a trend. 📈 Continuation If todays daily candle closed above previous days high and its still not reaching the key level, then liquidity is above todays high. Why ? Because people have intentions to sell highs to early, so and price will most likely go there. So we are bullish. Bullish Close 📈 Reversal If todays candle wicked above previous day high, but closed below , then we can expect liquidity is below Previous days low. Why? Because mostl likely traders entered fake high break out they put SL below days low. It's signs of reversal. Every significant reversal wicked above / below Previous days high/ low and closed inside, if not seen on PDH then its on weekly. 🧩 Liquidity theory Its always good to thing about the markets in terms of what others are doing. Back in 2014 when I worked in broker I had a chance to watch the order book. I have been able to see how traders are entering the markets where they put they stop losses. In the fact many people are chasing the price and they always buy highs and sell lows and most of the time they hide stop losses bellow / above the lows / highs of broken candle. So if that is true, it can look like on the picture below. We can see price moving up. Focus on candles with the wick. It's what we see now. But at specific moment that candle was looking bullish and most likely traders entered with hope for the continuation. And they have put stop loss below the previous days lows. as that candle closed with the wick below the previous days high traders are now trapped in the longs and stop run against them starts now. It's our opportunity its our range - Our new bias. Same it will be for the bullish case, traders sell the break out of the lows and put their stop loss above previous days highs. This behaviors creates a stop loss cluster there - which is liquidity and its high chance market will go there soon. Its our opportunity - our new bias So based on the candle closes we are able to defined a candle which was manipulated and its your range. I always markup range high / low and its 50% because its always a first target or partial profit when trading these ranges. I have explained more about Range trading in this post 🔗Click the picture to learn more 👇 if you have read the linked post above you must understand that candle close are just a pattern. ‼️ We don't want to be just pattern traders, we need to understand the market context to filter out only high probability setups. Every setup must have following 1️⃣Key Level our pattern without a key level is nothing. You dont want to be pattern trader, we need to add market context so every trade must go from a key level. Key levels occurs above / Below the ranges 2️⃣ Liquidity Every range or range manipulation has to go above old highs / lows. Its increase the probability that traders entered break out so we can trade against them 3️⃣ Range definition Skip small ranges. Not only that they will not give you proper risk to reward ratio, but they didnt created fomo or panic. We want see violent big range candles. Again go thru the charts you will see that big volatility always occurs before the reversal. 4️⃣Multiple timeframe ranges for higher probability and biggest risk to reward setups mix HTF range with LTF ranges as for example on the chart below we can see Monthly, Weekly ranges, and even Daily range on the lows. There was H1 entry on the daily. And we closed above previous day = Daily order block on the edge of the Monthly and Weekly range = It will most likely go higher ✍️ Homework its not point to show you how many times these ranges works or not. You can look to my profile and you will see many successful trades and also unsuccessful ones. Yes there is also losses. We are humans and we make mistakes. So forget about holy grail, but if you want to learn something there is no better way to learn than on live examples. Here are charts with current ranges im seeing. With my Bias for the next week. Go to your charts, find them and observe how the price action will develop. Might you find something to your trading arsenal. 🧪 DOLLAR- Monthly CLS range I Weekly CLS Range 🧪 GBPUSD - Monthly CLS range & Weekly CLS range 🧪 EURUSD - Monthly CLS range & Weekly CLS range 🧪 USDCHF - Monthly CLS range & Weekly CLS range Adapt useful, rejects useless ... Thanks for readying. Have a great trading week. David Perk aka Dave FX Hunter
David_Perk
راز معاملهگری موفق: استراتژی مکانیکی، آمار دقیق و غلبه بر ذهنیت!
Hi friends, new range created. As always we are looking for the manipulation in to the key level around the range. Don't forget confirmation switch from manipulation phase to the distribution phase to make the setup valid. Stay patient and enter only after change in order flow. If price reaches 50% of the range take partial or full close. 📌 HTF - Higher Timeframe view 🧩 Complete proces and Strategy explained 👇 Click Below 🎯 Why your market approach also should be mechanical ? NO Fixed Mechanical Trading Logic - You are guessing random patterns NO Defined trading plan - Every trade different logic NO Same logic in each trade - Not possible to backtest NO Backtests on at least 300 trades - Not knowing Statistics ➡️ No Statistics ➡️ No Edge ➡️ Mindset ProblemS 🧠 Core of mindset problems If you don't know your statistics on large enough data sample. You don't know your probabilities of win rate once the losing streak happen and it happens to every strategy. You will start doubting, hesitating to take next trade because you don't know statistics of your losses. In the end you will be doubting strategy and then jump to different one. You will be in the endless loop for years, looking for new better strategy. 👊 Your ultimate goal as a trader is not to be a generalist who knows 10 000 patterns. But rather create one system with narrowed criteria of each element of the trade to remove subjective and emotional decisions as much as possible and stick to this system no matter what. Practice it 10 000 times become a MASTER. ✨ Trading Mastery is reflection of your life Have a longterm plan, No Alcohol & Drugs, Ignore others, Focus on your journey , Backtest regularly, Review your weeks, Journal mistakes, Exercise, Sleep well, Read books, Walks in nature (no phone) , Meditate, Reduce social media time, Spend time with family, Live Life. Trading is hard, but not impossible. I believe in you 💪 David Perk aka Dave Fx Hunter
David_Perk
راز پیشبینی جهت بازار: تعیین بیِیس روزانه فقط با یک نگاه به کندل!
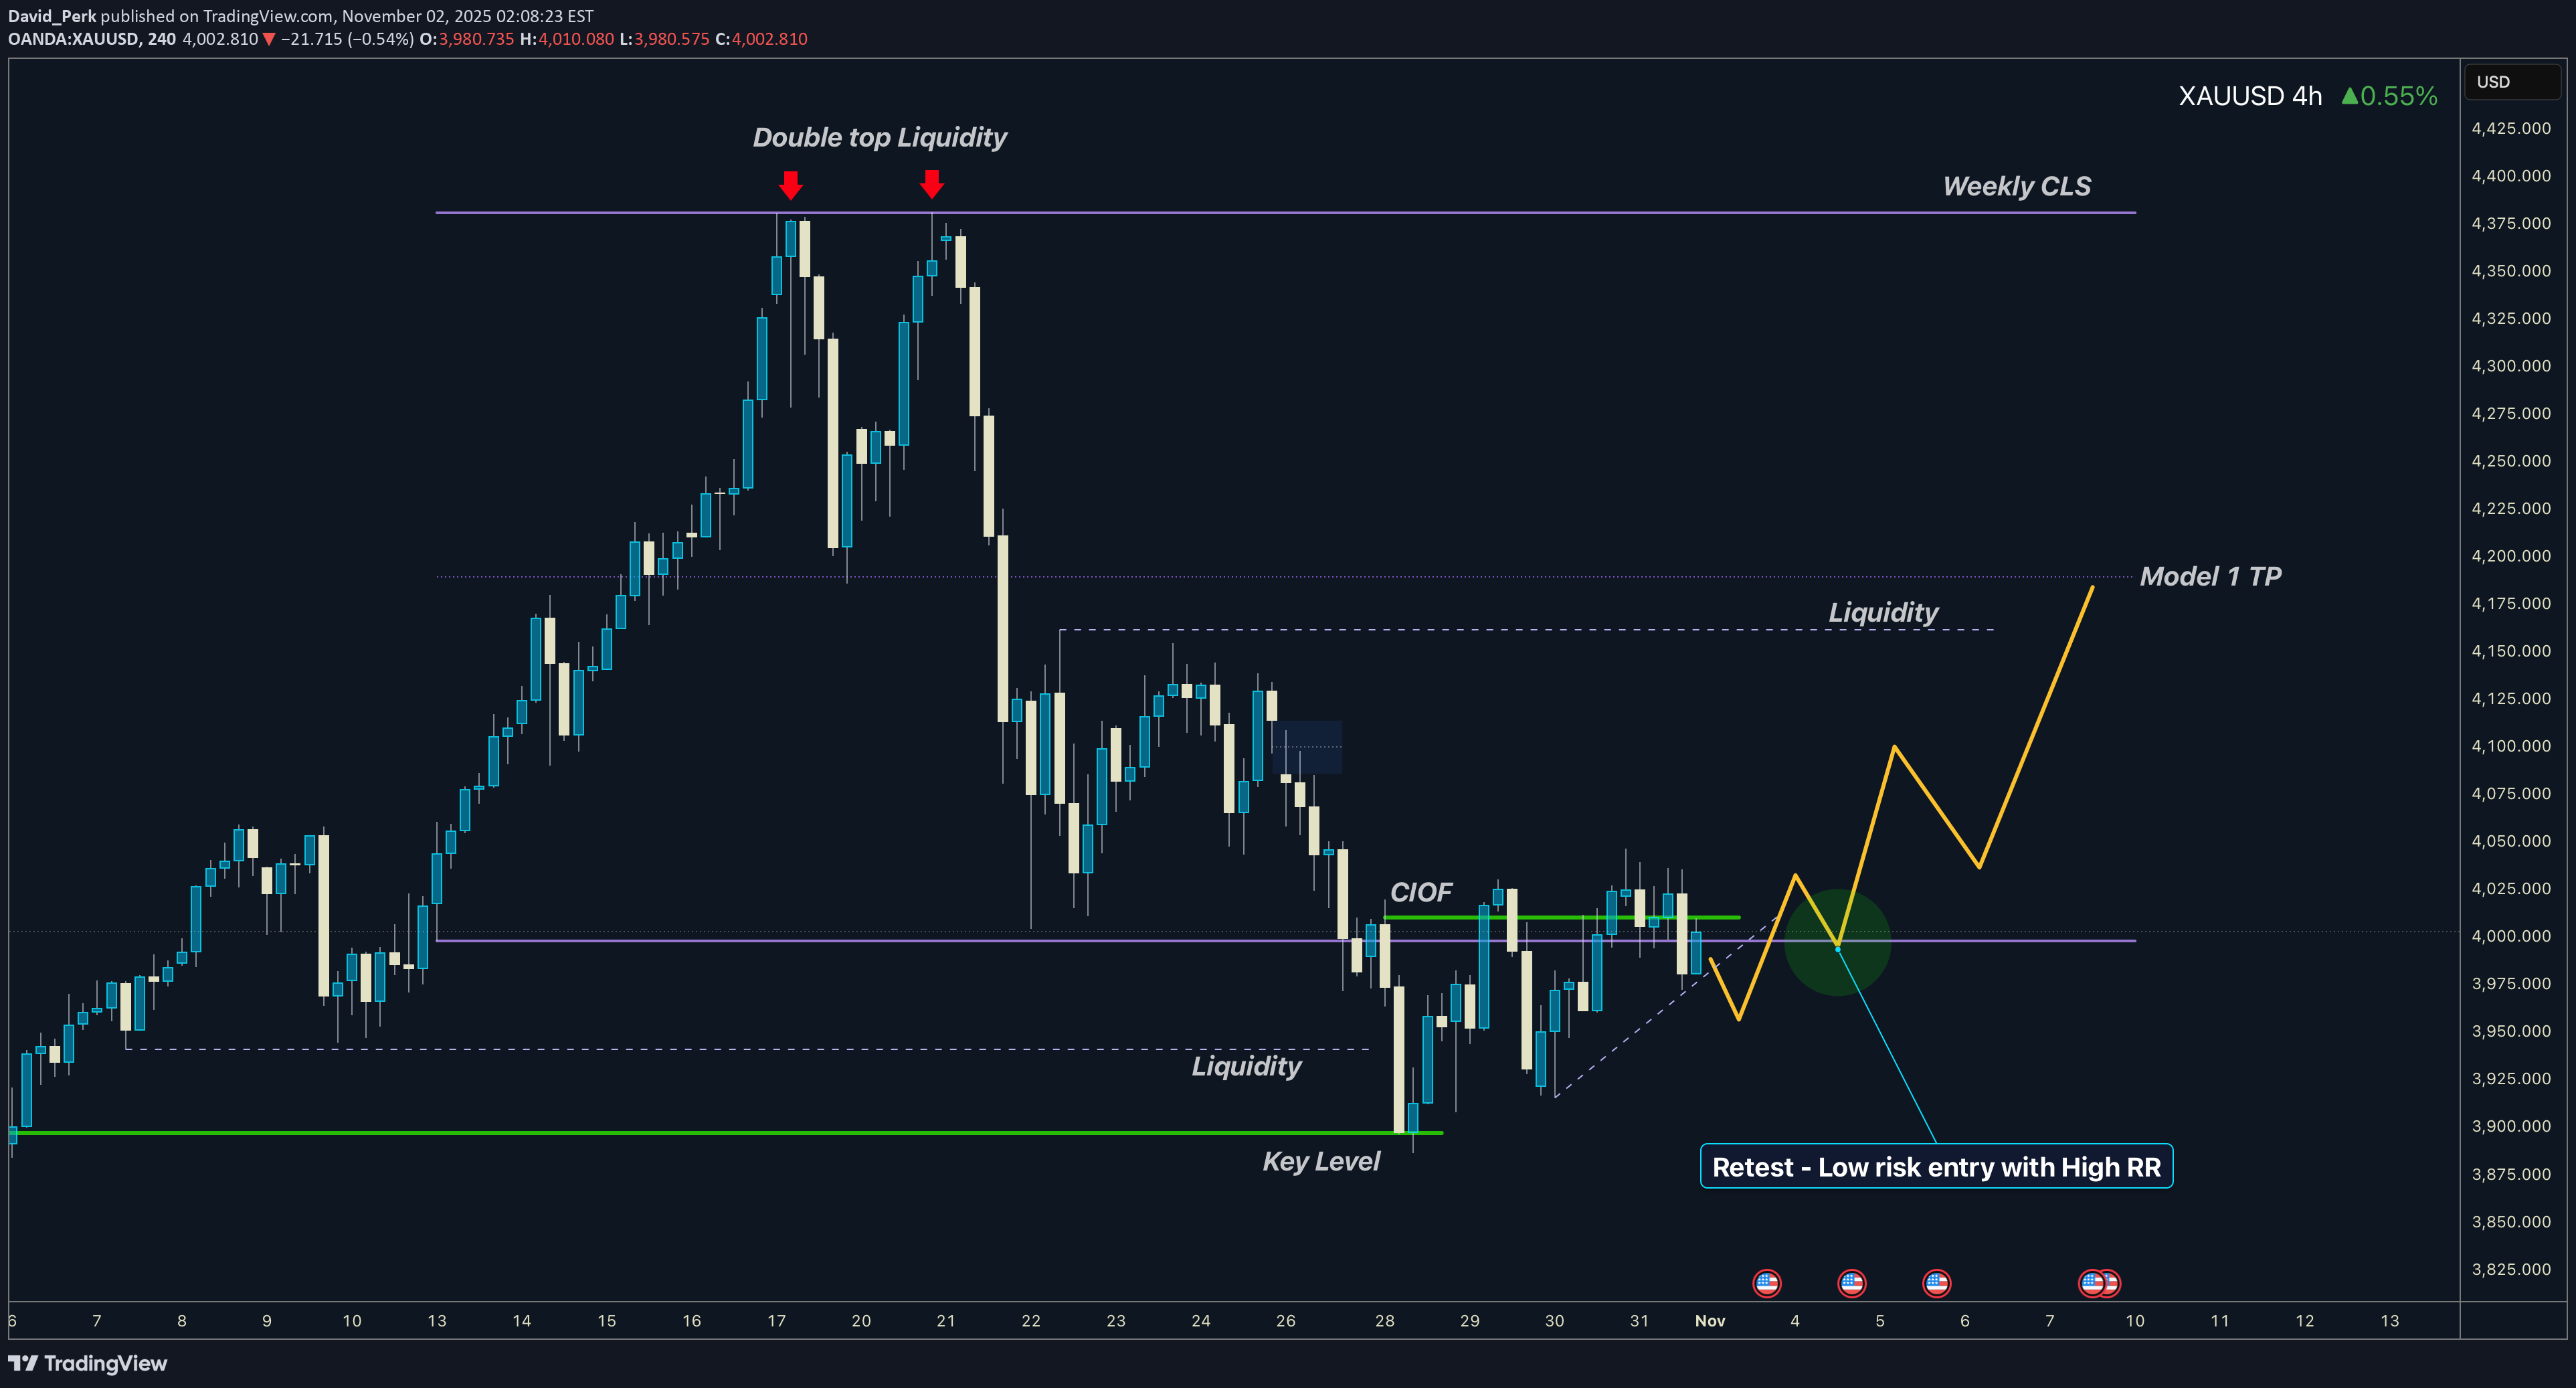
Hey traders today we are going to look in how to determine Daily Bias. Its actually not that complicated how many people thinks. Please forget about higher highs, and higher lows, channels and moving averages. Yes these can be also used, but we will be looking at the market in terms where is the liquidity and we will be determining the bias based on candle closes which tell us where the liquidity is resting. We will look at the Daily bias, but as I mentioned this many times in my posts - price is fractal so you can use this at any timeframe. But, If I can give you recommendations look for Higher timeframe bias on Daily and Weekly and H4 / H1 Structure and M15 entries. This post will be about continuation setups in a trend, I will touch a bit reversal because it's part of setup on LTF in the continuation. Something will be shown on bearish examples something bullish I hope you can use imagination for both sides. ⁉️ Where is the liquidity ? Always follow the Daily / Weekly candle close. 📈 Continuation If todays daily candle closed above previous days high and its still not reaching the key level, then liquidity is above todays high. Why ? Because people have intentions to sell highs to early, so and price will most likely go there. So we are bullish. Bullish Close 📈 Reversal If todays candle wicked above previous day high, but closed below , then we can expect liquidity is below Previous days low. Why? Because mostl likely traders entered fake high break out they put SL below days low. It's signs of reversal. Every significant reversal wicked above PDH and closed inside, if not seen on PDH than its on weekly. ‼️ Yes, Its that simple - this is how I predict my bias for the setups. There is obviously little bit more regarding the market context, because I want to be always selling highs and buying lows. Hence there must but pullback deep enough. I have explained how to buy low and sell highs in this post below. 🔗 Click the picture to learn more 👇 This is not about catching every significant highs and lows, you don't need it to be profitable. We are looking for the high probability trend continuation setups. We can catch highs and lows in the trend. After the stop hunt. 🧪In downtrend you want sell after stop hunt of short term highs 🧪In the uptrend you want be buying after stop hunts of short term lows I have explained more about stop hunts in this post. 🔗 Click the picture to learn more 👇 Now, If we know the bias based on the Daily / Weekly candle close our goal is to position ourself in the right time for the continuation setup which will be during the lower timeframe reversal. 📌 Reversal Setup first lets have a look to the reversal. We want see a candle high being taken and closed below. In that case draw on liquidity is below the daily low. Sign of reversal. So we can position ourselves in a trade as described on the picture, wick above and close inside is not enough for the signifcant HTF reversal. But its enough for our continuation setup, 📌 Continuation setup We want to see bullish candle close above previous days high and not liquidity taken above that wick. Then we can assume that liquidity is still resting above and we want to position ourselves during the LTF reversal in the direction of the HTF liquidity. same case will be for this bearish example where we can see how candles closed below the previous days low and last low was not swept hence we can expect price to visit that low again, we have spotted potential reversal by wicking above the candles high and close below and than we can position ourselves to the short and target daily lows. 📌 Continuation LTF reversal timing same case now you must already see it bullish close above PDH and that high was not swept so liquidity is still above , next day is inside candle once price dips below inside candle low we cans spot reversal setup on LTF and by creation of order block we enter the position during the NY session manipulation 📌 No Stop hunt = No trade if liquidity was not taken don't enter. Yes you can miss a trade it doesnt happen always, but if it doesnt happen it's not your setup so you didnt miss anything. On this example you can see that we had almost same setup. Bullish daily candle close. High was not swept, and than 2 inside candles. 3 candle manipulated lows and another candle was expansion. Now still focus the the picture above 2nd candle that candle is a range you are entering it after that range was manipulated. Look how price reached 50% of that range , retraced and than it went full range. Its Trading model 1 and Model 2. You mostly get 2 chances to trade it. Trading ranges is in my opinion least subjective approach and unlike diagonal drawings or multiple various pattern it has defined rules. I have described this strategy in details in this post below. 🔗 Click the picture to learn more 👇 📌 Final example for today - Schematics Now try it alone - step by step 1) How are candles closing 2) Was the Liquidity on the low taken ? No - price might go there - Im bearish 3) Lets wait for the LTF reversal - bearish this scheme was actually traded and posted here on Tradingview as a Continuation setup Model 1 & 2 🔗 Click picture below to learn how price action developed 👇 💊 Here are few more examples based on this trading logic 1️⃣ GBPUSD Daily range - Continuation setup Model 1 & 2 🔗 Click picture below to learn how price action developed 👇 2️⃣ AUDUSD Daily range - Continuation setup Model 1 & 2 🔗 Click picture below to learn how price action developed 👇 3️⃣ DOGE Daily range - Continuation setup Model 1 & 2 🔗 Click picture below to learn how price action developed 👇 Final words Is this holy grail ? Almost. Why is this approach great ? It's mechanical system for analysis - No subjective guessing. Does it prevent me from losses ? No, I can make and I sometimes I do mistakes in analysis, Im not perfect. Dont trust me , Im just a guy from the internet. Verify it by yourself and see if you take some of it to your trading arsenal. Adapt useful, Reject useless and something specifically your own. David Perk aka Dave Fx Hunter
David_Perk
۳ دشمن پنهان که مانع موفقیت شما در ترید میشوند (و راهحل قطعی آنها)
Hey what’s up guys, today’s post is not going to be technical, and neither some AI-generated piece. But more important than some technical ones. This one is about trading enemies that were holding me back for some time, hope you can learn from my mistakes. Looking for the secrets which will solve my trading and protect me from losses. Jumping from strategy to strategy and still thinking I need to learn more to avoid losses and find confidence. But than I realized its not in the strategy, but about being realistic and backed by statistical data. 🧠 Without a doubt, trading is 80% psychology and 20% trading. I’ll show you 3 main problems and give you solution for the inspiration to move to the next level faster. 1️⃣ False Expectations – Getting Rich Quick First of all avoid 20 years old instagram billionaires with cars, watches and yachts. Its mostly rented and if they cant show 3rd party verified 5 years live track record run aways. Yes, you can get rich from trading, but it’s not gonna be in a month. And most likely not even in a year. Be realistic. A doctor or a lawyer must study at least 4 years, and then practice for a few more years before they earn any money from their professions. They have clean scripts about what to learn, in what order, and how to apply it. In trading, you don’t know what to learn. You don't know yourself yet. You’ll probably waste time finding out what works and what doesn’t. You’ll also waste time trying shortcuts like signals, expert advisors, and mainly jumping from strategy to strategy thinking it's a solution. 💊 Solution: Stop believing someone has a magic secret formula to be 100% right on the markets. Strategy that makes you rich in a week and solve all your financial problems? No one has it. Learning to trade takes time — realistically 1–2 years minimum. It depends on your commitment and how much focused work you put in. Don’t expect to watch 20 hours of YouTube videos and become profitable. Doctor also cant do surgery after just reading scripts. Experienced practice and consistent work is needed. Can some mentor help you ? Yes, but you need to check them before buying any course. Lastly trading is not a solution to a miserable financial situation, if you are broke. Learn trading but don't trade live yet or it will destroy you. ----------------------------------------------------------------- 2️⃣ Trading Random Patterns – Price Action Overfitting If you’re trading random patterns and every trade has different logic, then you don’t have an edge. Random trading logic = random results. ‼️Knowing all these 👇 and fitting them to the chart is not trading edge. Im not saying, these patterns cant work, but you must focus to the one and become a master. Not randomly choosing what fits to the chart today and taking trade on different logic tomorrow. ‼️ If your strategy is trading random patterns you know, You can’t measure strategy performance. ⏩ What you can’t measure — you can’t improve or backtest. ⏩ And that means you’re don't have statistical data - its core of all problems. 💊 Solution: Whatever pattern you like - Head and Shoulders, Triangle, Wedge, Channels, Cup and handle. Whatever but pic one, defined step by step process how you will be trading it. And always use mechanical aprocah how you will be trading it. Narrow criteria for every element of a trade to eliminate subjective decisions. 🛡️ You should have : • Defined your pattern • Method to define key levels • Fixed method how to define a trend • Fixed method how to trade continuation with your pattern • Fixed method how to trade reversal by using your pattern Define one trading pattern ( 1 kick ) Practice it 10 000 times become master 👇 For your inspiration, you can check this strategy, its eliminating subjective decisions. 🔗 Click the picture below to learn more. 👇 Approach information I gave above as Bruce Lee : Adapt useful, Reject useless and something specifically your own. ----------------------------------------------------------------- 3️⃣ Psychological Influence Trading is 20% strategy and 80% psychology. It’s you vs. you. You need to master your emotions. It’s modern to say “fix your mindset,” but how? There’s no way to stop fearing losses, being greedy, or overtrading by just magically “fixing your mindset.” 🧪 Fear – Not executing your setup when it appears because the last two trades were losses. Closing trades early because you fear it will come back to entry or hit SL — which leads to doubting your strategy and jumping to another one. 🧪 Greed – Setting unrealistic targets and not taking profits at the right time. Trading sizes so big that you check your phone every 3 minutes. Gambling. Trying to pass prop firm challenges in a few trades instead of consistent work. 🧪 Revenge Trading – Trying to make your money back quickly in bad trading conditions. Trying to prove to the market that you’re right. Fighting with your ego. 🧪 Overtrading – Forcing trades just for the sake of doing something. Feeling like you need to trade every day — a mindset from normal jobs where we’re paid for effort. 💊 Solution: Mechanical Strategy + Statistical Data = EDGE Sounds like it has nothing to do with psychology, right? You will see step-by-step, following the same process and trading plan, can be backtested on hundreds of examples. If you run at least 300 trade backtests on any trade pattern, this is what happen to you: •No pattern guessing or fitting to price action •No overthinking — you just follow the same setup you know works •Fixed SL and TP, fixed RR — no guesswork •You know your win rate % •You know your risk-reward % •Repetitiveness builds confidence and clarity •Confidence and clarity lead to improvements •Improvements lead to mastery over time ‼️ Again a statistical edge is only possible through a mechanical trading approach and proper backtesting. If you’ve done your backtests and have statistical data on a large sample, let’s say: Win Rate: 65% That means out of 100 trades, you’ll win 75 — but there can still be 25 losses. You never know the distribution of wins and losses, you only know that you’ll win over a series of trades. Average RR: 2.3 That means for every $100 you risk, you’ll win $230 if you’re right, and lose $100 if you’re wrong. The reality is always different than backtest, in reality you will perform worse. Here is what you should at least achieve Having these stats is key — it’s the solution to psychological influence How? 🧠 Final Solutions - Just think about it 🧪 Fear Why would you fear opening the next trade after a loss or closing early, if you know that on average you win 65 out of 100 trades? Distribution is random, but with a positive win rate, you win over time. Why would you close early if you know that your TP was hit in 75 out of 100 ? 🧪 Greed Why would you set unrealistic targets when your statistics already show what RR is most profitable for you? And why would you gamble big lot sizes if you know you can lose 35 trades out of 100? It doesn't make sense to gambler right? 🧪 Revenge Trading Why do it, if you know losses are part of the process and that if you just stick to the plan, you’ll win long-term? Why your statistics says so. You know how your A+ Setup looks like, when stopped out why re-entering again if setup is not valid. 🧪 Overtrading Why trade every day if your A+ setup doesn’t occur every day? If your data says the best setups occur 3 times per week, why force it? Why risk extra trades if you already made profit or if you didn’t perform well this week, why gamble it all on Friday? See ? Having a fixed mechanical solution backed by backtested statistical data is solution to everything? David Perk aka Dave Fx Hunter
David_Perk
راز بزرگ شکست معاملهگران: ۳ اشتباه حیاتی که هرگز نباید تکرار کنید!

Hey what’s up guys, today’s post is not going to be technical, and neither some AI-generated piece. But more important than some technical ones. This one is about trading enemies that were holding me back for some time, hope you can learn from my mistakes. Looking for the secrets which will solve my trading and protect me from losses. Jumping from strategy to strategy and still thinking I need to learn more to avoid losses and find confidence. But than I realized its not in the strategy, but about being realistic and backed by statistical data. [I]🧠Without a doubt, trading is 80% psychology and 20% trading. I’ll show you 3 main problems and give you solution for the inspiration to move to the next level faster. 1️⃣ False Expectations – Getting Rich Quick First of all avoid 20 years old instagram billionaires with cars, watches and yachts. Its mostly rented and if they cant show 3rd party verified 5 years live track record run aways. Yes, you can get rich from trading, but it’s not gonna be in a month. And most likely not even in a year. Be realistic. A doctor or a lawyer must study at least 4 years, and then practice for a few more years before they earn any money from their professions. They have clean scripts about what to learn, in what order, and how to apply it. In trading, you don’t know what to learn. You don't know yourself yet. You’ll probably waste time finding out what works and what doesn’t. You’ll also waste time trying shortcuts like signals, expert advisors, and mainly jumping from strategy to strategy thinking it's a solution. 💊 Solution: Stop believing someone has a magic secret formula to be 100% right on the markets. Strategy that makes you rich in a week and solve all your financial problems? No one has it. Learning to trade takes time — realistically 1–2 years minimum. It depends on your commitment and how much focused work you put in. Don’t expect to watch 20 hours of YouTube videos and become profitable. Doctor also cant do surgery after just reading scripts. Experienced practice and consistent work is needed. Can some mentor help you ? Yes, but you need to check them before buying any course. Lastly trading is not a solution to a miserable financial situation, if you are broke. Learn trading but don't trade live yet or it will destroy you. ----------------------------------------------------------------- 2️⃣ Trading Random Patterns – Price Action Overfitting If you’re trading random patterns and every trade has different logic, then you don’t have an edge. Random trading logic = random results. ‼️Knowing all these 👇 and fitting them to the chart is not trading edge. Im not saying, these patterns cant work, but you must focus to the one and become a master. Not randomly choosing what fits to the chart today and taking trade on different logic tomorrow. ‼️ If your strategy is trading random patterns you know, You can’t measure strategy performance. ⏩ What you can’t measure — you can’t improve or backtest. ⏩ And that means you’re don't have statistical data - its core of all problems. 💊 Solution: Whatever pattern you like - Head and Shoulders, Triangle, Wedge, Channels, Cup and handle. Whatever but pic one, defined step by step process how you will be trading it. And always use mechanical aprocah how you will be trading it. Narrow criteria for every element of a trade to eliminate subjective decisions. 🛡️ You should have : • Defined your pattern • Method to define key levels • Fixed method how to define a trend • Fixed method how to trade continuation with your pattern • Fixed method how to trade reversal by using your pattern Define one trading pattern ( 1 kick ) Practice it 10 000 times become master 👇 For your inspiration, you can check this strategy, its eliminating subjective decisions. 🔗 Click the picture below to learn more. 👇 Approach information I gave above as Bruce Lee : Adapt useful, Reject useless and something specifically your own. ----------------------------------------------------------------- 3️⃣ Psychological Influence Trading is 20% strategy and 80% psychology. It’s you vs. you. You need to master your emotions. It’s modern to say “fix your mindset,” but how? There’s no way to stop fearing losses, being greedy, or overtrading by just magically “fixing your mindset.” 🧪 Fear – Not executing your setup when it appears because the last two trades were losses. Closing trades early because you fear it will come back to entry or hit SL — which leads to doubting your strategy and jumping to another one. 🧪 Greed – Setting unrealistic targets and not taking profits at the right time. Trading sizes so big that you check your phone every 3 minutes. Gambling. Trying to pass prop firm challenges in a few trades instead of consistent work. 🧪 Revenge Trading – Trying to make your money back quickly in bad trading conditions. Trying to prove to the market that you’re right. Fighting with your ego. 🧪 Overtrading – Forcing trades just for the sake of doing something. Feeling like you need to trade every day — a mindset from normal jobs where we’re paid for effort. 💊 Solution: Mechanical Strategy + Statistical Data = EDGE Sounds like it has nothing to do with psychology, right? You will see step-by-step, following the same process and trading plan, can be backtested on hundreds of examples. If you run at least 300 trade backtests on any trade pattern, this is what happen to you: •No pattern guessing or fitting to price action •No overthinking — you just follow the same setup you know works •Fixed SL and TP, fixed RR — no guesswork •You know your win rate % •You know your risk-reward % •Repetitiveness builds confidence and clarity •Confidence and clarity lead to improvements •Improvements lead to mastery over time ‼️ Again a statistical edge is only possible through a mechanical trading approach and proper backtesting. If you’ve done your backtests and have statistical data on a large sample, let’s say: Win Rate: 65% That means out of 100 trades, you’ll win 75 — but there can still be 25 losses. You never know the distribution of wins and losses, you only know that you’ll win over a series of trades. Average RR: 2.3 That means for every $100 you risk, you’ll win $230 if you’re right, and lose $100 if you’re wrong. The reality is always different than backtest, in reality you will perform worse. Here is what you should at least achieve Having these stats is key — it’s the solution to psychological influence How? 🧠 Final Solutions - Just think about it 🧪 Fear Why would you fear opening the next trade after a loss or closing early, if you know that on average you win 65 out of 100 trades? Distribution is random, but with a positive win rate, you win over time. Why would you close early if you know that your TP was hit in 75 out of 100 ? 🧪 Greed Why would you set unrealistic targets when your statistics already show what RR is most profitable for you? And why would you gamble big lot sizes if you know you can lose 35 trades out of 100? It doesn't make sense to gambler right? 🧪 Revenge Trading Why do it, if you know losses are part of the process and that if you just stick to the plan, you’ll win long-term? Why your statistics says so. You know how your A+ Setup looks like, when stopped out why re-entering again if setup is not valid. 🧪 Overtrading Why trade every day if your A+ setup doesn’t occur every day? If your data says the best setups occur 3 times per week, why force it? Why risk extra trades if you already made profit or if you didn’t perform well this week, why gamble it all on Friday? See ? Having a fixed mechanical solution backed by backtested statistical data is solution to everything? David Perk aka Dave Fx Hunter
David_Perk
از شکار استاپ (Stop Hunt) برای کسب سود استفاده کنید: راز نقدینگی بازار!
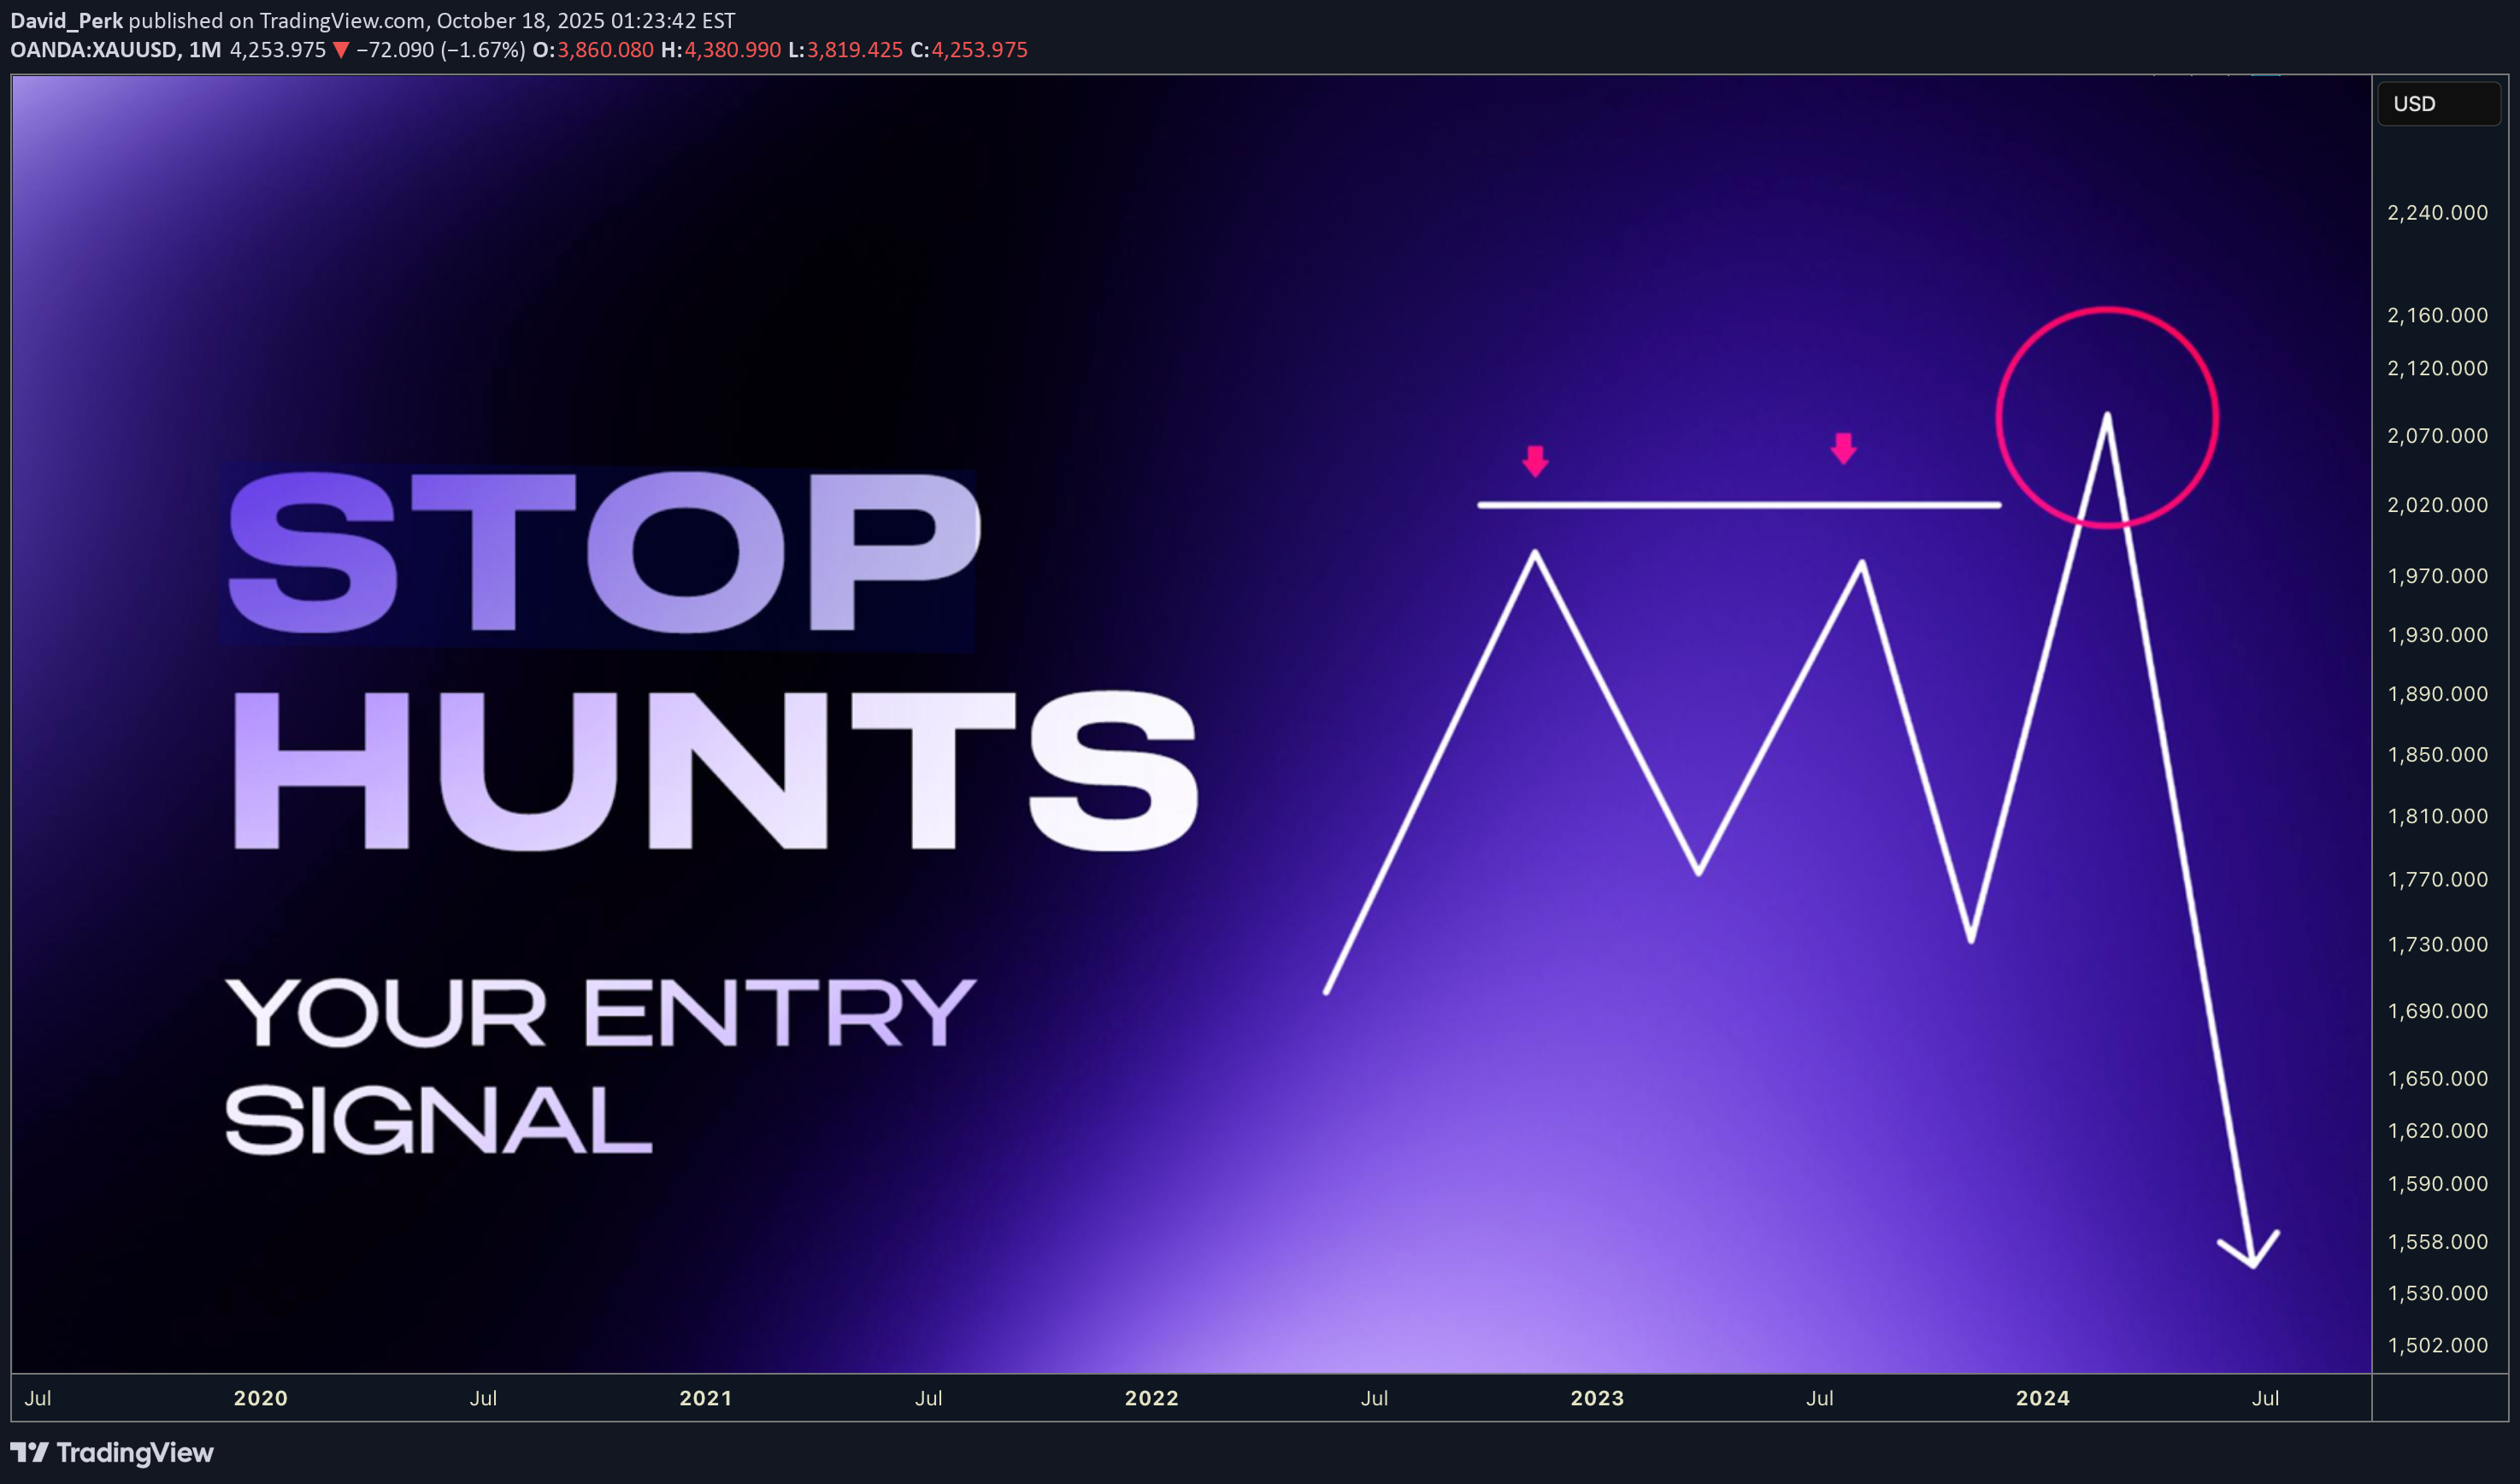
Hey traders In this post, you’ll learn how to the liquidity is engendered and how to avoid being stop hunted and actually use stop hunts to your advantage 📌If you placing your stop loss below the level before it was visited to grab the liquidity, you will become the liquidity. In the fact market makers doesn't care about your or mine stop loss, its too small money. But they come there because they have to in order to move the market. 📌 Every trader has seen it happen: you take a position at the “obvious” level, only to get stopped out by a quick wick — and then the market runs exactly where you expected. That wasn’t bad luck. That was stop hunt in other words liquidity grab ‼️ Don't be a liquidity Price doesn’t move randomly inside ranges. It hunts liquidity at the edges. • Retail trap: Traders pile orders right at the Double top / bottoms and ranges • Smart money: Hunt's double top / bottoms and ranges starting the move. 📌 Double Top / Double bottom sometimes price leave this formation, sometime even triple top / Bottom. It's on purpose and its telling us price will go there again, Im using these as the targets. Traders still think that if price rejected somewhere for few times that its strong level and its safe to put stop loss above or below and thats the problem. As many traders thinks this way its create a huge stop loss cluster = Liquidity zone which is attractive for the market makers. ‼️ If you see a double top / bottom then never enter before price dip in to it. Not even when there is clear trend line break its trap. Wait , you will get much sharper and better risk reward trade. If a pivot level gets tapped multiple times, it's on purpose. Smart money are creating illusion of strong support / Resistance so they cant manipulate price above / bellow where they grab the liquidity and reverse the market. 🧪 Example 1 - Triple top stop hunt, if you enter before you would serve as liqudity 🧪 Example 2 - Triple top stop hunt, even if you are right with the direction, not eating for the stop hunt first will ruin your trade 🧪 Example 3 - Double top stop hunt - he was nice trend line break which attracted more sellers and as you can see they been right with the direction but setting your stop loss just right above double top is not working 🧪 Example 4 - market makers used triple top used to offload positions above this liquidity level. 💊 Les informed traders trades patterns like : Double bottom, Double top and they put the stop losses above the range - This creates a Liquidity cluster which smart money needs to execute their orders. They will come for it before the real move happen. 🧩 How to use this information for your advantage train your eyes and focus on the double tops / bottoms thats where the liquidity mostly will be resting. Always wait for the stop hunt after that is your time enter the market. Im looking for the trades always after the stop hunt in other words range manipulation. Let's check few ideas bellow. 🧪 EURUSD - after double top liquidity manipulated Im targeting opposing double bottom liquidity. 🔗 Click the picture to see price action development 👇 🧪 DOLLAR - Weekly Range Low liquidity was taken - now targeting double top liquidity as easy target. 🔗 Click the picture to see price action development 👇 🧪 USDCHF - Double bottom liquidity taken, targeting opposing side 🔗 Click the picture to see price action development 👇 🧪 DOGE - Liquidity take and targeting opposing range. 🔗 Click the picture to see price action development This is happening over and over again across all assets 👉Once you see it you cant unsee it. Focus on the stop hunts and you will see the market structure differently. Not like higher highs, higher lows and vice versa but rather something like this. 📌 Uptrend Price is in a bullish move and is consistently breaking abovehighs and rejecting below lows. (Sweeping liquidity) - heading to HTF liqudity 📌 Downtrend Price is in a bearish move and is consistently breaking below lows and rejecting above highs.(Sweeping liquidity) - heading to HTF range liquidity whole new world will open for you. You will be entering only after stop hunts. ⭐ I have whole strategy build on that click the picture below for more inspiration and the most powerful thing is that price is fractal what you just learned in the post above is possible to scale down. So for example you analyze Monthly range manipulation and you have opposing target. Its target for the next few weeks until the price reaches the monthly target and if you scale down to Daily then you trade Daily ranges in the Monthly range sequence. 📌 Bullish LTF Range within HTF Range Analyze HTF range and define models, then drop it to your TF and trade your ranges with the HTF range. Always follow the same process only on the LTF - Lower timeframe. 📌BearishLTF Range within HTF Range Analyze HTF range and define models, then drop it to your TF and trade your ranges with the HTF range. Always follow the same process only on the LTF - Lower timeframe. Shift from being the exit liquidity to being the trader who patiently waits, confirms, and executes with precision. 🩸 Spot the Liquidity. 🩸 Wait for stop hunt. 🩸 Trade with intention. Don't trust me and check this on your chart find the true. David Perk aka Dave FX Hunter
David_Perk
راز سادگی در ترید: چگونه با "یک استراتژی" استاد بازار شوید؟
Hey whats up traders. Trading is not easy, but today I want to show you how it can be easier. First we need to ask questions. What is the goal of the trader ? You probably answered - to make money. Yes I get it. But money is the result of something which is much more important - Discipline , Following the system, Trading plan, Your routines , Risk management etc.. 📌 I would lay it down this way: The goal of the trader is to create a system with narrowed criteria for the each element of the trade and following it no matter what. Then money comes and trading is easier. 📌 Trading System When you approach you chart differently every time, then you cant have consistent system but just overfitting what you see on chart to the patterns, that just fits in to it right now - Butterfly, Head&Shoulders, Crab, Triangle, Wedge, Channel, Cup&Handle. Im not saying you cant make profits by trading these pattens. But how can traders who are has different pattern on each chart have consistent results and be consistently improving over time ? Im also not saying that one of mentioned patterns is bad. None of the strategy is superior to other. Who makes it powerful is trader himself by mastering it. 📌 I would refer to the master Bruce Lee - 1 Kick - 10 000 times. Whatever is your trading pattern stick to the one and become master. Know it upside down in every market conditions and learn market context and key levels. Know its weakness and when it is powerful. 👊One Kick 10 000 times will help you will make you confident master/b] 👇 - No more subjective decisions - Not pattern guessing and fitting to price action - Not overthinking - Still doing same setup, you ,know it works - Fixed SL and TP, RR - No guesswork - Can be practiced - Backtested - Become Confident - Knowing your Win rate - Eliminate - Fear, Greed, Over Trading - Repetitiveness builds - Confidence and Clarity - Confidence and Clarity leads to Improvements - Improvements leads to the Mastery 🧠 I came to trading for the money. But it gave me presence, spirituality, discipline, resilience and peace in the chaos. Everything changed for me when I stopped looking for better strategy, but started to focus on my self and my daily routines and process to make everything more mechanical. And mainly journaled and described every process step by step. Strategy is 20% of success 80% is your mind. 🧪If you don't have you strategy or want inspiration here I described my mechanical Trading approach. 🔗 Click the picture below to learn more. 👇 Adapt what you find useful and reject useless what works for me is might not for you. ‼️ Pattern is trade setup. Not a strategy. You need to define the following. - Market context - When and Where your pattern occurs - Key Level - On what key levels you will be trying your pattern - Trade Setup - Thats your pattern - H&S, Pinbar, Range, Butterfly ... - Trade Plan - Describe the process, when and how - Daily Routine - Describe how you will work day by day - Risk Management Rules - What is your targets, Max loss - Trading Journal - What data sets you will be collecting about trades 🧩 Market Context you pattern can occur in a different market phases but only some will be profitable, you need to filter out the low probability conditions. So Im never looking for the setup if there is no pullback at least 50% from high of the swing. Because this can happen hence trade setup entry must always occur from a key level after the 50% pullback. How to do it I describde in the post previous trying view post. 🔗 Click the picture below to learn more. 👇 🧩 Key Level as I described it higher , if not trading reversal. Im never buying without a 50% pullback hence Im looking for my key levels placed after a 50% pullbacksIm never buying in the premium prices. Always want a pullback to the discount. For me works best Order block. In other words SD zone. Strong areas of the institutional activity that created imbalances. Here are the key points for high probability order block key level as you see on the picture above order block must occur in the liquidity zone. I have described it in the this post. 🔗 Click the picture below to learn more. 👇 🧩Trade Setup now this is the pattern. Whatever is your pattern it can be consistency working only if you have defined Market context and Key Levels. There you want have your pattern to occur, for me its range manipulation and then Im following these two entry methods. 📌 Bullish continuation setups Model 1 - Entry after manipulation - 50% target Model 2 - Entry on pullback on level between 61.8 - 80% pullback 📌 Bearish Continuation setups Model 1 - Entry after manipulation - 50% target Model 2 - Entry on pullback on level between 61.8 - 80% pullback 🧩 Trade Plan in a trade plan you should describe your process how you gonna do step by step approach of the market context , key level trade setup and how you make it all working. Also knowing when not to trade is might most important. And column for your recent mistakes is vital, because by reminding your mistakes every day is a first step to eliminate them next time. Im reading it every time before going to trade and constantly improve it. 🧩 Daily Routine as a trader you want to trade systematically and you want to eliminate all possible distraction that comes from the online world and mainly you want to specify your times when you gonna trade and when you close charts and go back to the live. This is important otherwise trading obsession and sitting by charts 12 hours a day will destroy not only your account, but also your live. Here is my simple list: - Don't open any social media, and turn off all notifications that could distract your focus, - Check economic calendar for high-impact news - Update charts, Levels, Ranges and market context as a first thing on Tradingview - Go thru your pairs, identify HTF order flow and Liquidity and ranges - Mark out valid higher time frame Order blocks - Mark out valid ranges , Setup alarms - Wait for the range manipulation and execute - If Price action is not clear don't force a trade, skipping a trading session without hesitation is a level of maturity As a day trader you should focus only to one trading session. London or New York. Here I described how to approach London session Click the picture below to learn more. 👇 🧩 Risk Management Rules now Im not talking about a risk per trade, but knowing your targets. And not having that you must reach them every month. But having them as your stop and prevention from overtrading. There is nothing more frustrating than having a great week and destroy all work at Friday. Hence: - Daily Target - 3R - 0.5% risk = 1% // 1% = 2% - Weekly Target - 6R - 0.5% risk = 2% // 1% = 4% - Monthly Target - 20R - 0.5% risk = 8% // 1% = 16% - Stop trading for the day when >3R is locked, Stop trading for the week when >6R is locked don't stop analyzing, but take only A+ setup, backtest, and journal... 6R is amazing profit in a week you dont need more, if you not making the living with 6R weekly gain, you need more capital - use prop firms. 🧩 Journal is key to the consistent grown as a trader decide what data sets about your strategy you will be collecting in order to improve it. Always do screenshot when entering and add all information it will also keep you from overtrading and clicking to often. Make sure you have in your journal formula to measure your average win rate, profitability for days of the week. Also monitor your emotions and try to describe them so you know where you are whats need to be eliminated. So to summarize trading is not easy and if thumbnail with easy way to trade catches your attention I hope you are not disappointed, because it's not about a strategy but about you. How organized and prepared you are then you can be disciplined and successful. Hope you get some inspiration - Adapt useful , Reject useless, become master of 1 kick. David Perk aka Dave Fx Hunter
David_Perk
بهترین استراتژیهای پرایم ترید در سشن لندن (با ۲ سناریوی قطعی)
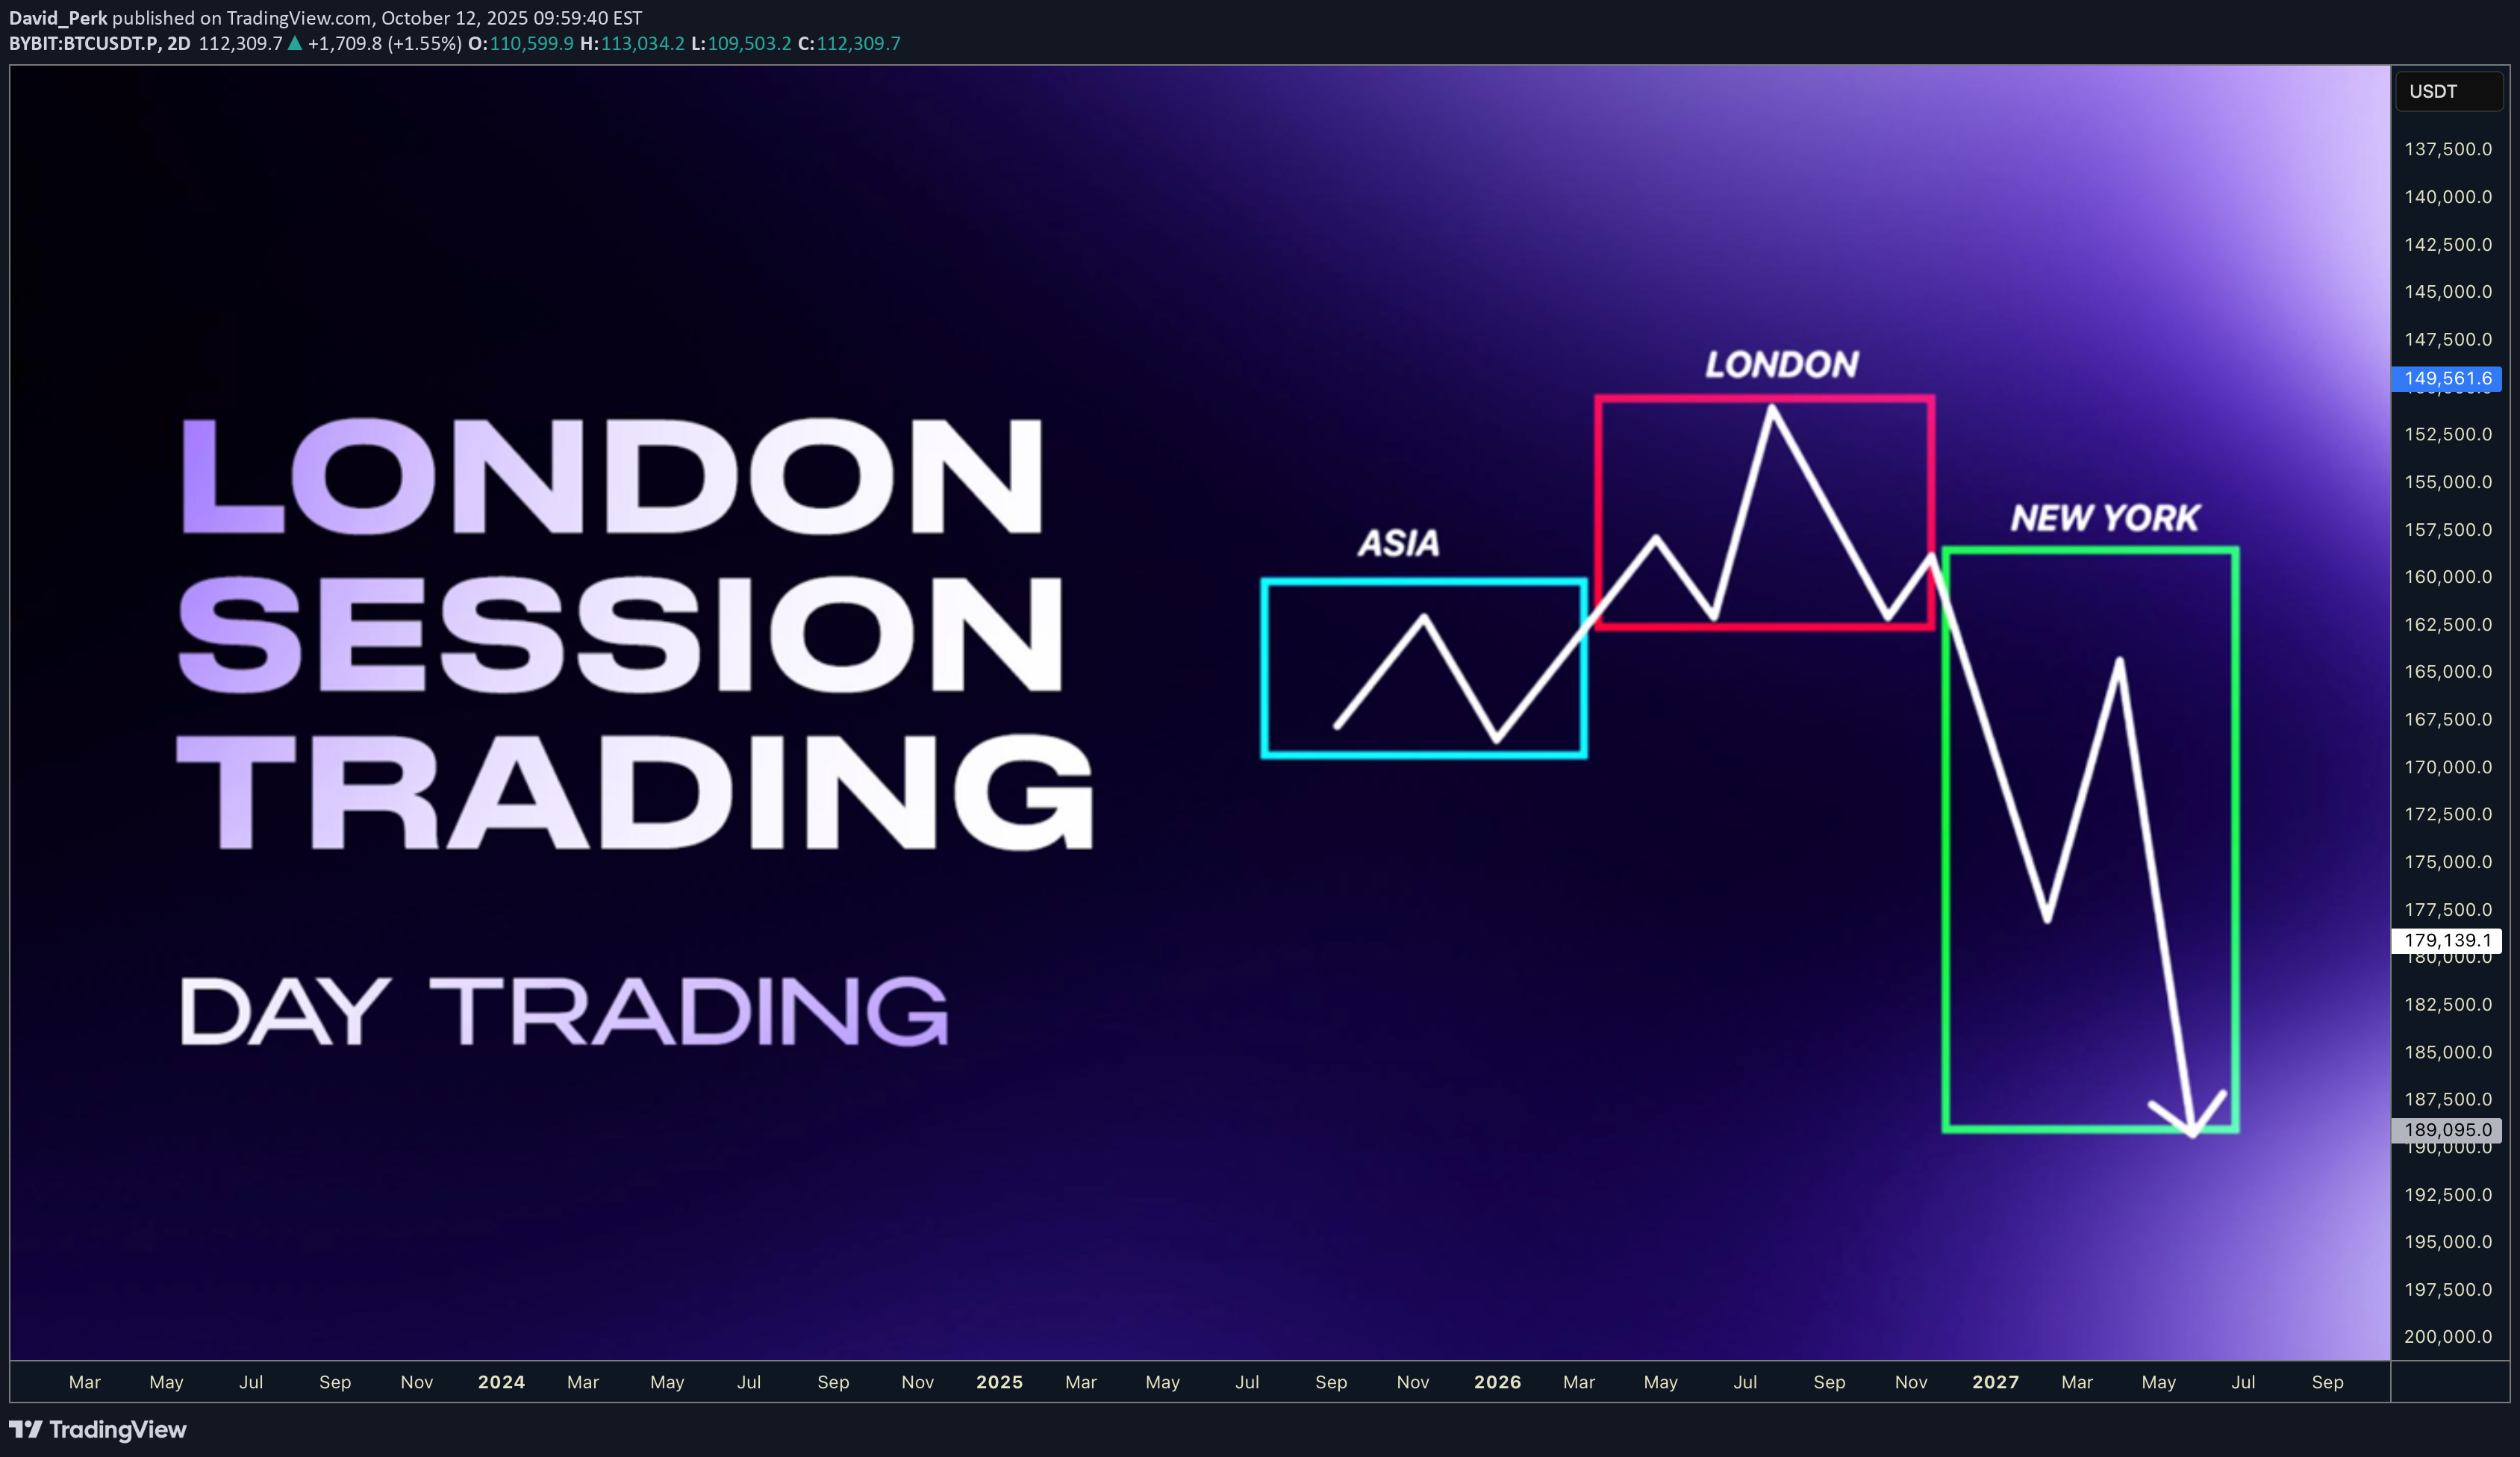
Hey traders, let's break down the London session trading . In my opinion key session for the forex trading mainly for the EUR, GBP and CHF. I ll show you two high probability setups and its conditions to trade and when not to trade. Make notes and backtests so you got statistics and you can improve yourself over time. You will find out, that if you focus only on these 2 setups on 3 mentioned currencies. You will have 3-5 high probability opportunities per week. Which is enough to make 6R gains in a week. Which is 3% on prop account with risk 0.5% per trade. And it's enough to make trading your main income. 📌 Asian Session Low volatility & accumulation phase — the market usually consolidates inside a tight range after the previous New York close. If the Asia session is trending, London will be continuation setup. 📌 London Session The highest-probability setups often occur during this session. If Asia was tight range, London usually manipulates the Asian range sweeping stops above or below then reverses and starts the true daily move. London will be Reversal setup. Often sets the daily high or low of the day 📌 New York Session Brings in the highest volume and often continuation or reversal of the London move. Based what has happen in London and on relationship with key levels and market phases. We can build market narrative for our trades. 🧪 London Continuation Bearish setup •Narrative: Asia did the manipulation → London does the continuation. • Asia session already made a manipulation into a key level • Price displaced away from that level • CIOD / OB on M15 or H1 before London open • H1: Asia runs above the stops above H1 high into a key level • It gets rejected and followed by order block and displacement • At London open, price retraces into M15 premium key level and continues in the same direction ❌Invalidation: the manipulation high/low from Asia session 🧪 London Continuation Bullish setup • Narrative: Asia did the manipulation → London does the continuation. • Asia session already made a manipulation into a key level • Price displaced away from that level • CIOD / OB on M15 or H1 before London open • H1: Asia runs bellow the stops above H1 high into a key level • It gets rejected and followed by order block and displacement • At London open, price retraces into M15 discount key level and continues in the same direction ❌Invalidation: the manipulation high/low from Asia session 🧪 London Reversal Bearish setup • Narrative: London performs the manipulation → price reverses. • Asia session consolidates near a higher timeframe key level • London open initiates the manipulation into the key level • Price reject at the key level and created M15 order block • H1: Asia consolidates Bellow Key Level • London opens, price runs Asia high into that Key Level • M15 breaks down → Change in order flow → clean short setup • Target: higher timeframe draw on liquidity (e.g., previous day low) ❌Invalidation: the London session high (manipulation point) 🧪 London Reversal Bullish setup • Narrative: London performs the manipulation → price reverses. • Asia session consolidates near a higher timeframe key level • London open initiates the manipulation into the key level • Price reject at the key level and created M15 order block • H1: Asia consolidates above the Key Level • London opens, price runs Asia high into that Key Level • M15 breaks up → Change in order flow → clean short setup • Target: higher timeframe draw on liquidity (e.g., previous day low) ❌Invalidation: the London session low (manipulation point) 🧩 to trade this method successfully you need to understand Order Blocks 🔗 Click the picture below to learn more 👇 🕐 Timing is important 1️⃣Continuation setup can occur in first part of the London session. during the start of the settlement 2️⃣ Reversal setup needs a bit more time. I suggest don't enter before the 10 CET wait for clear change in order flow after the manipulation 🧩 Day Trading doesn't mean trading every day. For highest probability setups trade only within the higher timeframes H4/D1/W1 trends. 📌 Down Trend - Trade Stop hunts above the highs Trade London continuation or Reversal if the H4 Downtrend has run above the highs (stop hunt) It will give you chance to catch big expansion moves 📌 Up Trend - Trade Stop Hunt below the lows Trade London continuation or Reversal if the H4 Downtrend has run below the lows (stop hunt) It will give you chance to catch big expansion moves. 🧩 In other words you want be buying loses and Selling highs. 🔗 Click the picture below to learn more 👇 I have explained how to do it in this post bellow Trend is your friend so H4 is minimum trend requirement for the London session traders. But if you want to take it to next level and enter on the sniper entries during the London session, you should also know daily and weekly trends within the monthly range. This opens a whole new world where you can catch London session model with HTF range move and it can be +10RR trades if you patient enough. 📈 Bullish LTF Ranges within HTF Range Analyze HTF range (monthly) and define daily ranges, and wait for the London setups on the lows of the previous days within HTF trend. Always follow the same process in the London session on LTF. Asia either make manipulation - go with continuation setup or Asia consolidates and wait for the manipulation during the London session - go with London Reversal setup. 📉 Bearish LTF Ranges within HTF Range Analyze HTF range (monthly) and define daily ranges, and wait for the London setups on the highs of the previous days within HTF trend. Always follow the same process in the London session on LTF. Asia either make manipulation - go with continuation setup or Asia consolidates and wait for the manipulation during the London session - go with London Reversal setup. ‼️ In trading, you make most money by making precisely best decisions and controlling your risk. Hence understanding the different probabilistic scenarios we can start focusing on quality over quantity by avoiding lower probability conditions. The aim is to improve our decision making process by knowing when it's better to trade and when not. ❌ Low Probability London Session Conditions • After a series of 3 consecutive bullish daily candles - Avoid Longs. • After a series of 3 consecutive bearish daily candles - Avoid Shorts. • After FOMC event that produces an extreme range. • Ahead of NFP and CPI data release • Multiple high and medium impact news events. • The Asian Range is has been trending and is larger than 40 pips. • If the Asian Range is not visually consolidating. • Absence of a candle range ✅ High Probability London Session Conditions • The market has recently reacted off of Daily /H4 key level • The Asian Range is visually a consolidating and smaller than 40 pips. • Presence of a clean visual candle range • Presence of a higher timeframe key level. • Clean higher timeframe draw on liquidity. ✅ High Probability Intraday Setups The highest importance is placed on the H TF Daily or 4h direction: • Clean orderflow. [Rejecting highs, breaking lows or Rejecting lows, breaking highs] • Clean higher timeframe draw on liquidity and directional bias. • Strong price based narrative. • Strong time based narrative. • 4h candle range • 4h Key level. • Key time Adopt this simple concept and master it. You will not need to pay any signals group and other nonsense anymore. Just sacrifice 6 months to one strategy in one time window and find repetitiveness. Build confidence based on statistical data. Become independent. ✨ Trading Mastery is reflection of your life Have a longterm plan, No Alcohol & Drugs, Ignore others, Focus on your journey , Backtest regularly, Review your weeks, Journal mistakes, Exercise, Sleep well, Read books, Walks in nature (no phone) , Meditate, Reduce social media time, Spend time with family, Live Life. Trading is hard, but not impossible. I believe in you 💪 David Perk aka Dave Fx Hunter
David_Perk
تحلیل از بالا به پایین: استراتژی نهایی برای انتخاب تایم فریم معاملاتی و مقیاسبندی موفق
Hey whats up traders, lets have a look to the Timeframe alignment's, its a key point to clarity in the setups. Price is fractal and what is happening on one timeframe we can find on lower timeframe also. 📌 Why it's important to use correct timeframes? - We should use timeframes based on what type of traders we are, not just random. - We cant trade M5 reversal from Monthly etc. There must be structured approach. 🧪 Know yourself Based on your lifestyle, patience. Decide how much time you want to give to trading. But remember - Trading is not employment. You are paid for best decisions & being in the right position, not for your time and effort. More trades are not equal more profits. Full time trading and day trading doesn't mean trading every and sit whole day behind PC. 🧪 What type of trader you are ? • Position Trader - Trade the monthly range. • Swing Trader - Trade the weekly range. • Short Term Trader - Trade the daily range. • Day Trader or Intraday Trader - Trade the daily candle's range. • Scalper - Trade the hourly range. 🧩 Im mentioning ranges, because it's core of mechanical strategy, which I explained in the post below. 🔗Click to the picture below to learn more 👇 ‼️ When analyzing the market don't start, just with the range. It's just one element of the trade. We need to understand whole market context. Always go step by step , rule based analysis of trade elements with correct timeframe sequences. 🧪 Timeframes of trade elements • Trend / Bias - Higher Timeframe • Ranges - Higher Timeframe • Key Levels - Higher Timeframe • Structure - Intermediate Timeframe • Profiling AMD - Lower Timeframe • Order Flow / Entry - Lower Timeframe 📌 Bullish Scenario 📌 Bearish Scenario 🧪 Whats your timeframes? Position Trader - Monthly Key Level + Range- Daily Structure - H4 Profiling + Entries Swing trader - Weekly Key Level + Range- H4 Structure - H1 Profiling + Entries Short term Trader - Daily/H4 Key Level + Range- H1 Structure - M15 Profiling + Entries Day Trader / Scalper - H1 Key Level + Range- M5 Structure - M1 Profiling + Entries Im most confident in Swing Trading and Short term trading, hence I trade Weekly and Daily ranges. I use monthly ranges for HTF bias, but I will explain this later. 🧩If you apply these timeframes correctly, you will be easily buying lows and selling highs. I have explained this in this post below. 🔗Click to the picture to open lean more 👇 This framework by itself is good enough to be successful in the trading. I suggest you to create your own trade checklist and do always step by step analysis. Remember nothing comes easy to master anything takes time you need to give it at least 6 months, without jumping from strategy to strategy. Use Trading journal to collect information, without it you will not improve and will repeat the mistakes. To fasten the process run backtests at least 300 examples. 🧩Dont forget that whole concept is based on the liquidity, you must understand it also. I have explained in this post. 🔗Click to the picture to open lean more 👇 🧪 Power of scaling If we look to the 1 minute chart and Monthly chart we will not recognize what chart it is. Patterns are playin on all timeframes. That is why is 100% mechanical approach based on liqudity and candles - Open , High, Low, Close powerful. What Im going to show you now you cant be achieved with diagonal drawings or random patterns. 📍First lets start with our basic knowledge If the range is manipulated the CLS sequence is suggesting that opposing side of the range will be reached. It can be by just quick move - Model 1, or we can get Model 2 opportunity. 📍 Bullish continuation setups Model 1 - Entry after manipulation - 50% target Model 2 - Entry on pullback on level between 61.8 - 80% pullback 📍 Bearish Continuation setups Model 1 - Entry after manipulation - 50% target Model 2 - Entry on pullback on level between 61.8 - 80% pullback 🧩Dont forget that best enties comes in trend on the right pullbacks.I have explained in this post. 🔗Click to the picture to open lean more 👇 🧪 Now lets use this knowledge as a fractal I have clarified our Range timeframes for each type of trader, but you definitely should not skip bigger timeframes even if it's not your timeframe. Knowing the sequence from HTF give us a bias perspective so we can trade LTF ranges within HTF Range Models. 📍 Bullish LTF Range within HTF Range Analyze HTF range and define models, then drop it to your TF and trade your ranges with the HTF range. Always follow the same process only on the LTF - Lower timeframe. 📍 BearishLTF Range within HTF Range Analyze HTF range and define models, then drop it to your TF and trade your ranges with the HTF range. Always follow the same process only on the LTF - Lower timeframe. Now, practice that, you have one trading framework which you can apply to all timeframes and scale it down, means you are looking at the markets with always same approach and this receptiveness give you confidence and clarity = MASTERY ✨Trading Mastery is reflection of your life Have a longterm plan, No Alcohol & Drugs, Ignore others, Focus on your journey , Backtest regularly, Review your weeks, Journal mistakes, Exercise, Sleep well, Read books, Walks in nature (no phone) , Meditate, Reduce social media time, Spend time with family, Live Life. Trading is hard, but not impossible. I believe in you 💪 David Perk aka Dave Fx Hunter
Disclaimer
Any content and materials included in Sahmeto's website and official communication channels are a compilation of personal opinions and analyses and are not binding. They do not constitute any recommendation for buying, selling, entering or exiting the stock market and cryptocurrency market. Also, all news and analyses included in the website and channels are merely republished information from official and unofficial domestic and foreign sources, and it is obvious that users of the said content are responsible for following up and ensuring the authenticity and accuracy of the materials. Therefore, while disclaiming responsibility, it is declared that the responsibility for any decision-making, action, and potential profit and loss in the capital market and cryptocurrency market lies with the trader.