
Crypto_Mercy
@t_Crypto_Mercy

What symbols does the trader recommend buying?
Purchase History
پیام های تریدر
Filter
EGLD inside a Wave 2, Y wave.

Hi everyone! The EGLD price has breached the 61.8% Fibonacci level. It has just reached the entry point of the M neckline (green zone), which serves as a support area. In my opinion, at some point, EGLD is likely to attempt reaching the minimal retracement target of a wave 2, which corresponds to the 0.382 Fibonacci level at $48.35. However, it's also quite plausible that the price might briefly spike to $46.40, reaching the 100% Fibonacci level of our Y wave in blue, and exiting through the neckline. Top buying zones (supports).. 48,35$ - 46,39$ 41,70$ - 41,16$ 35,96$ to 33,63$ 29,94$ 26,73$ No financial advise.
SPX Market Crash (upcoming) - 35% why?
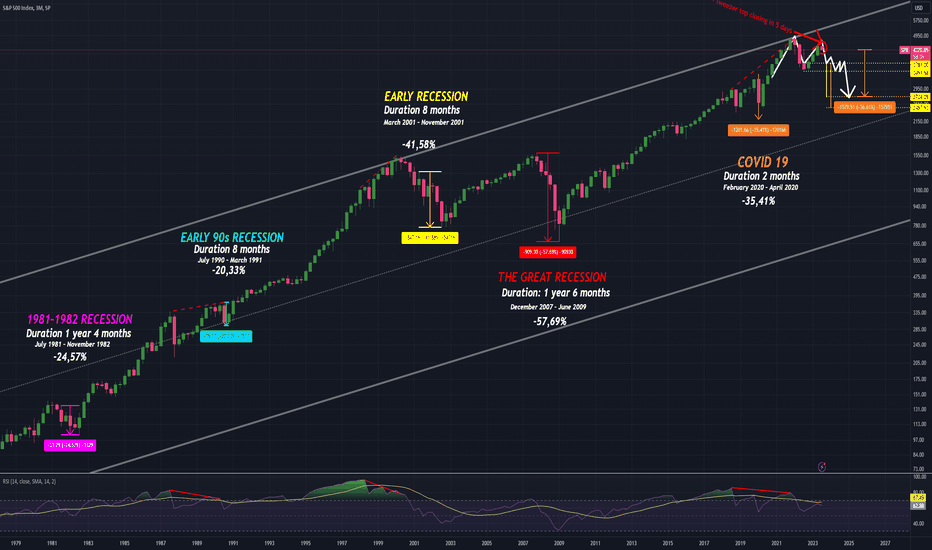
Hi Everyone, A summary of the last 5 recessions since 1981... These recessions triggered declines of at least 20%. The Great Recession from December 2007 to June 2009 was the one that most affected the market with a decrease of about 57%. Regarding macroeconomics, the Americans are currently implementing a monetary tightening policies and have announced a final interest rate hike before the end of the year, so in my opinion, a recession is now inevitable. The SPX is currently forming a tweezer top on the 3-month timeframe... In my opinion, a 35% decline is possible to test the M Neckline (entry gate).
EGLD MultiversX top buying zones

Hi everyone, here's a scenario for EGLD that, let's say, takes a hefty beating. Unfortunately, EGLD has opened a door to one. Sadly, this scenario could pave the way for a downward impulse in this Main Zone Z (in blue). Essentially, the Z's can do anything. The strongest structural supports are found at $24.66, $21.12, $19.70, $10.36, $9.18, and $7.33. The pole of the LARGE M Pattern formed points to $7.83. We also have the fibs that position the Z around $20, $10.87, $7.52, or $4.03. I really like the potential zone ranging between $10.36 and $6.30 if the 19.70$ doesn't hold. Liquidity is currently "manageable," but stagnant. Interest rates are high, and inflation is fluctuating. This could impact risk assets in the coming months. The consumer price index continues to rise, with an increase of 22% over the last five years. The Fed's reverse repo facility is a good indicator to monitor the Fed's monetary policy. It is currently declining, affecting liquidity in the financial system.
SPX ready for Y to 3219
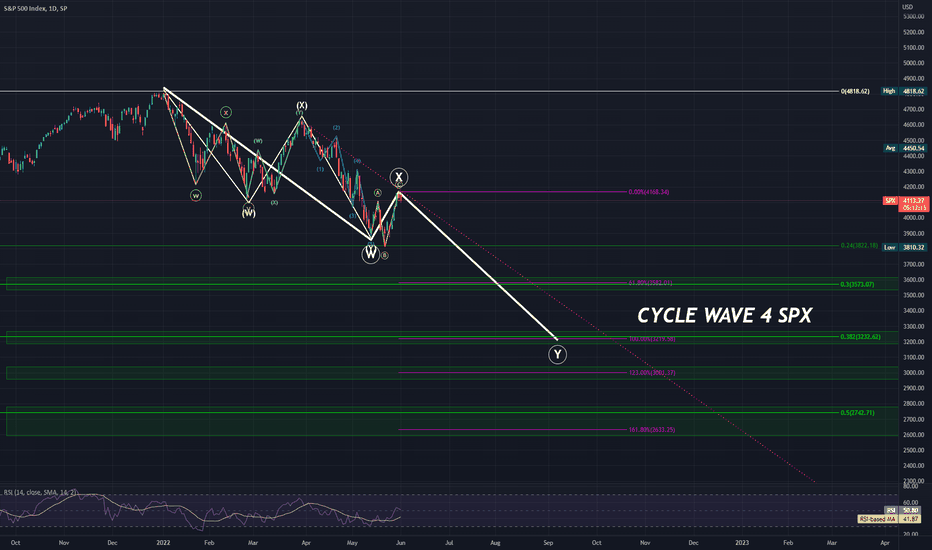
Im tracking SPX Elliott Waves and SPX is about to close a Flat ABC (yellow). Next targets are 3582, 3220, 3002 and even 2633 is possible. Also Fed should announce new Rates hikes... everything is sync to present new oopportunies lower. Cycle Wave 4 top entry fibs are in between 0.3 - 3573 and 0.5 2743
Elrond bear market bottom to 36.50$ or 20$

Hey everyone, E wave inside ABCDE in yellow was a FLAT ABC trap. Egold only have 2 MA's, 3 Months MA9 at 112.70$ and 5 months MA 7 at 108.65$. Losing this can easily bring the eGOLD on next strong support which is 85$. I see Elrond is this Grand WXY in Blue. 2 top bear market log fibs are 0.382 which is 36-37$ for Elrond, and logo 0.30 at 65.50$ but weakest altcoins sometimes drop to log 0.5, its around 16$ -18$ for the eGOLD. Its a possibililty but less probable than36$ in my opinion. Best to you !
GOLD to 4391$ Supercycle Wave 3 before jan 2025

Non log Circle had predicted perfectly our last run to 1920$. GOLD had completed a Cup & Handle pattern (Cycle Wave 4) that started at the end of 2011. Logarithmic Fibonnacci Circle 361.8% (from SuperCycle Wave 1 to Wave 2) had predicted that SuperCycle Wave 3 can go up to 4391$. A breakout of 1920.94$ resistance can push gold for more upside before 2025. On the 3M Chart GOLD took the MA14 which should provide more energy. Also GOLD is currently obtaining Monthly MA's support for a continuation. 7 key reasons why GOLD can continue this wave Cycle wave 5 higher... 1-Inflation 2-Russia mainly sold U.S. Treasury bonds to buy the bullion. 3-American Debt keep growing. 4-Monetary tightening 5-Domestic political gridlock 6-Possible World War 3 7-Rising tensions with China 8-Bad Fed Policies since 2 yearsMy Eliott Wave Chart for #GOLDShort term GOLD price rising quickly but the RSI is not following, we are probably inside a Wave 5
SPX Zig Zag ABC for Cycle Wave 4
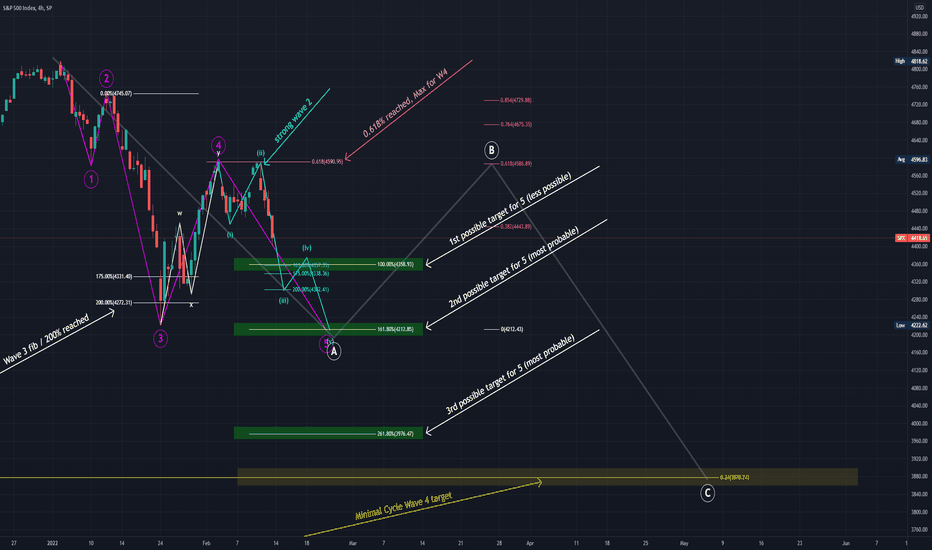
Hi everyone, SPX is currently playing Impulse Intermediate wave 5 of a Main A Wave. Most probable targets for this Wave 5 are 4212 and 3976. Because last Wave 2 (in blue) was very strong, im expected at least a troncated wave 5 at 4212. 4358 (100% of fobonnacci) is the 1st possible Wave 5 target but i would be very surprised if the market makers are not bringing the market down to 4212 because a double bottom would provide us a better bounce back for the next B wave and can at the same time create a bullish divergence on lower timeframes like the 4 hours or 1 day chart. We should not forget that the last january 04rt SPX began a Cycle wave 4 retracement. Here are the most probable targets for this full Cycle Wave 4 Retracement : 0.24% = 3878.24 0.30% = 3643.26 0.382% = 3322.12 0.50% = 2860 0.618% = Golden fib at 2398 We must keep in mind Cycle Wave 2 of SPX was pretty strong in March 200, which make this Cycle Wave 4 more chance to be light. Usually most probable target for a W4 is in between 0.3% and 0.5%. With inflation currently slowly stablizing a little , 3643.26 or even 3878.24 are on the table and pretty realistic. For now im projecting the next B Wave in between 4443.89 and 4729.88.
SPX is about to reverse, wave 5 of C is almost completed.
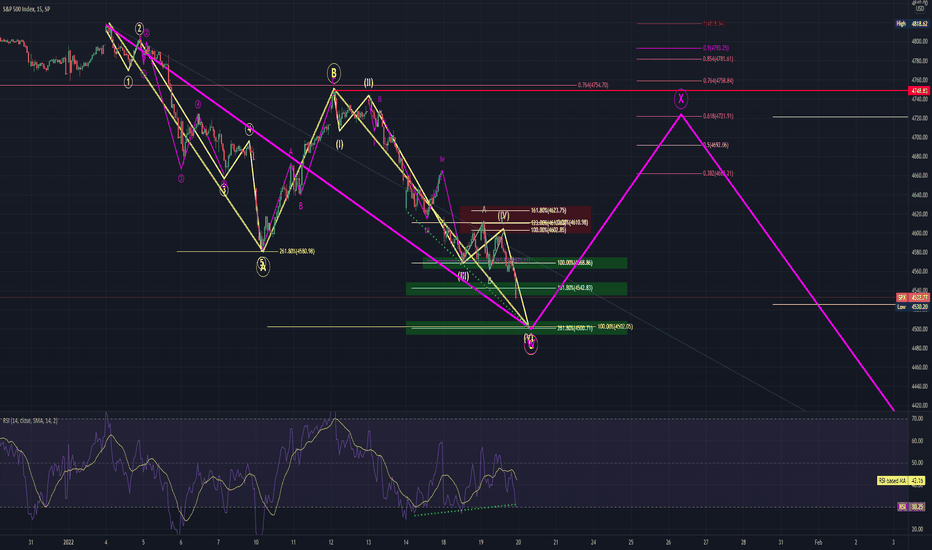
Hi everyone, SPX is about to complet the C wave inside this Zig Zag ABC. Max wave 5 target (the 261.8%) fib is at 4500. It's a very clean pattern, impulse down in A, ABC in B and impulse down in C on the 100% fib. SPX is already diverging (bullish Divergence Class A on the RSI). The big question is what's next...? It can be 2 things now, a new higher high or the beginning of a WXY in what i think can be a Cycle Wave 4 retracement. Where this Wave 4 can go ? At least to 3935 in the 0.24 fib from our last wave 2 we made in March 2009. But in between 0.3 and 0.5 more common (probable). Best to you !! Thanks for your comments !it turned out to be an impulse down !With the FED announcement, little fakeout and
Elrond retracement almost over

Hi everyone, My count is presenting a very complex retracement for Elrond but almost over. 3 possible targets i see for now 254.90$, 241.31$ and 218.38$. Golden fib support is at 248.57$. Z wave show a max retracement at 200$... can be a wick, but i personnaly think the Golden Fib will hold. Pattern we are currently inside is a falling wedge which is a bullish pattern Best to you !
Bitcoin lowest target is 42765$

Hi everyone, In my count, #Bitcoin is in a WXY (double correction). Y can be an impulse down, WXY, ABC or ABCDE. #bitcoin actual pattern look like a barrier triangle W4 (descending triangle), which should bring more downside. This scenario show a max target of 42765$. Another possible target would be 45842$ is 161.8%. If this turn out to be a WXY inside Y 35k would be a possible target, but this is not what i see for now. Best to you.
Disclaimer
Any content and materials included in Sahmeto's website and official communication channels are a compilation of personal opinions and analyses and are not binding. They do not constitute any recommendation for buying, selling, entering or exiting the stock market and cryptocurrency market. Also, all news and analyses included in the website and channels are merely republished information from official and unofficial domestic and foreign sources, and it is obvious that users of the said content are responsible for following up and ensuring the authenticity and accuracy of the materials. Therefore, while disclaiming responsibility, it is declared that the responsibility for any decision-making, action, and potential profit and loss in the capital market and cryptocurrency market lies with the trader.