Cross10XSignals
@t_Cross10XSignals
What symbols does the trader recommend buying?
Purchase History
پیام های تریدر
Filter

Cross10XSignals
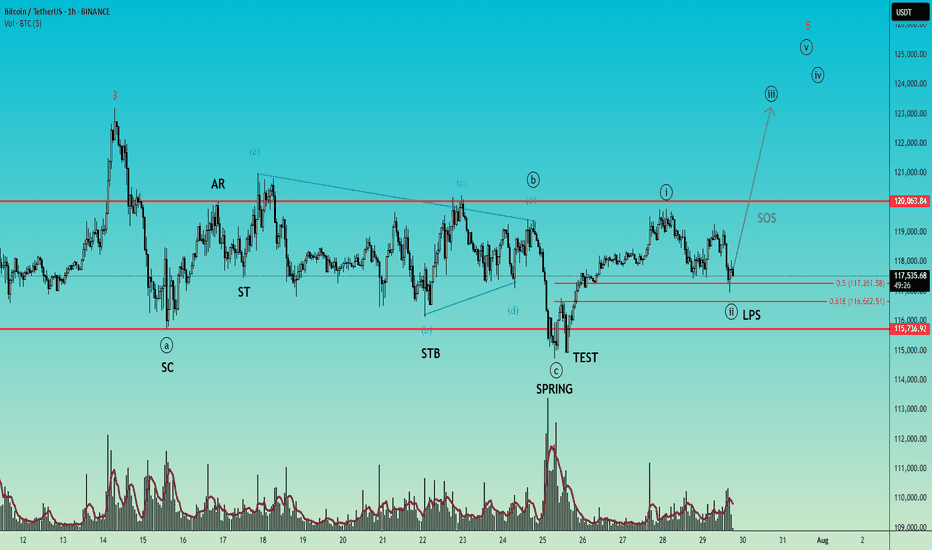
BTCUSD – Wyckoff Accumulation + Elliott Wave Synergy

Timeframe: 1H Title: "A textbook Wyckoff Accumulation with Elliott Wave Confirmation – Sign of Strength Next?" This chart presents a textbook Wyckoff Accumulation structure seamlessly combined with Elliott Wave Theory, highlighting how the two methodologies can complement each other in timing and structural validation. 🔍 Wyckoff Accumulation Phases: SC (Selling Climax) and AR (Automatic Rally) define the range. ST (Secondary Test) and STB (Secondary Test in Phase B) confirm horizontal support. A classic Spring and Test pattern occurs in Phase C, marked by a sharp downward probe below support (Spring), followed by a successful retest with no new low (Test). The LPS (Last Point of Support) is forming above the Spring low and near the 61.8% Fibonacci retracement level, showing bullish absorption of supply. The recent rally and pullback suggest we're entering Phase D, with the Sign of Strength (SOS) expected next. 🌀 Elliott Wave Alignment: The Spring aligns with the end of wave (iv) of a larger impulse, and the structure unfolding from the Spring appears to be the start of wave (v). The move from Spring to SOS shows impulsive qualities, labeled as wave (i), with the corrective pullback forming wave (ii), ending near the golden Fibonacci ratio (61.8%). This alignment of wave (ii) with the LPS further validates the accumulation and sets the stage for a strong wave (iii) within wave (v), likely to coincide with a Sign of Strength breakout. 💡 Key Takeaways: This is a classic Wyckoff Accumulation with all major phases visible: A to D. Elliott Wave counts confirm the internal structure and suggest bullish continuation. Watch for the SOS rally above resistance at ~120k to confirm the transition into Phase D/E and a potential trending move. 🔔 Conclusion: Combining Wyckoff and Elliott Wave provides a high-probability setup. A successful break above resistance will signal the start of a trend phase. LPS offers a favorable risk-reward area, especially with wave (ii) possibly completing soon with a test of Fibonacci ratio (61.8%).

Cross10XSignals
TONUSD - Elliott wave count

Above 4.430 we are looking to the upside for wave (v).

Cross10XSignals
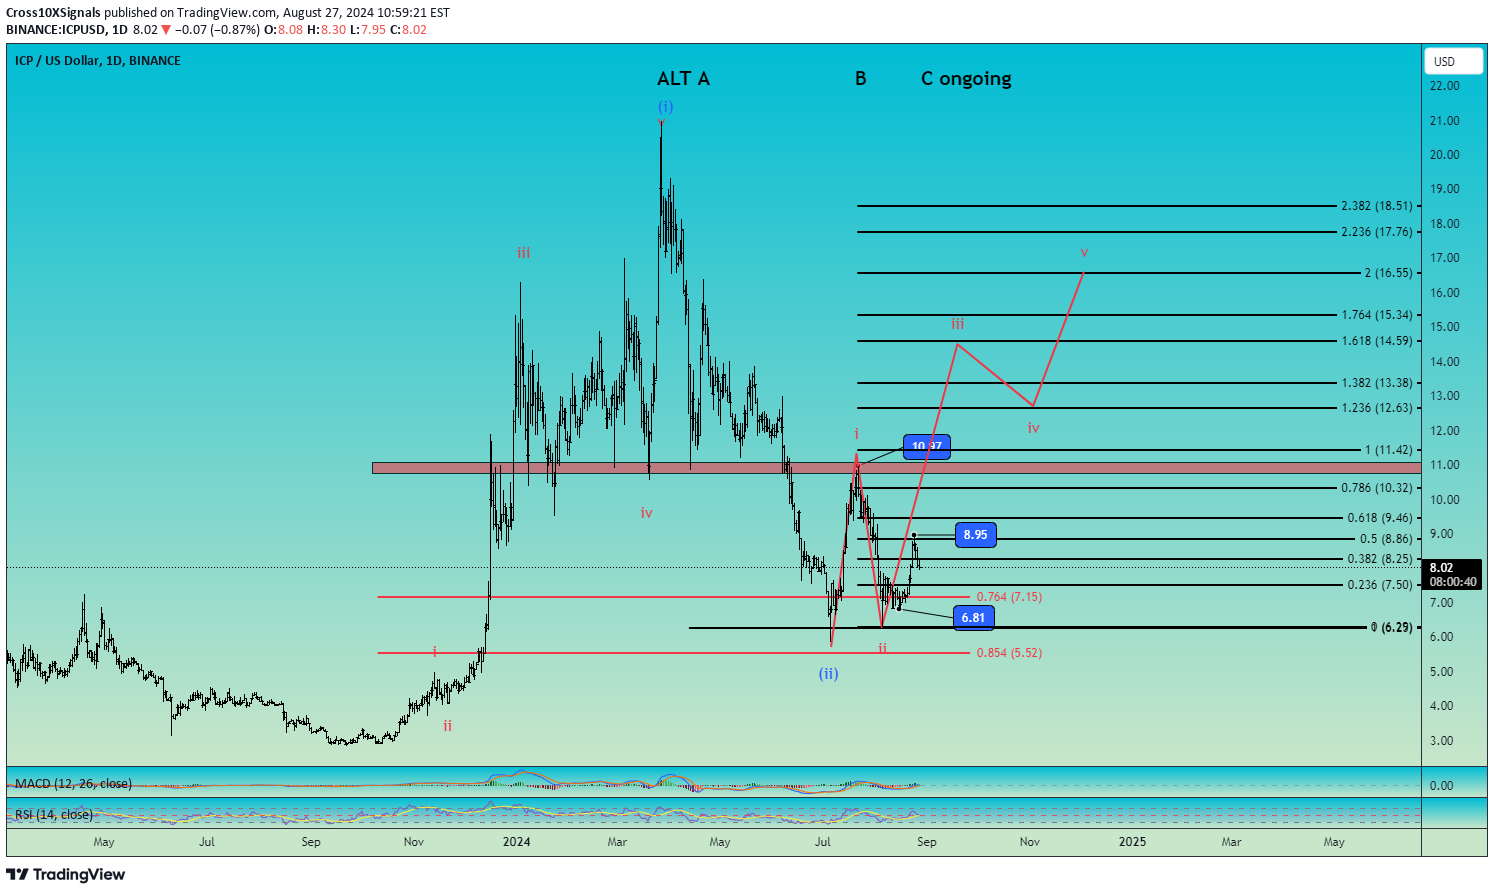
ICPUSD Elliott wave count

Above 6.81 and clearing 8.95 we are looking to the upside for wave iii targeting 1.618 fin projection, above 14 USD

Cross10XSignals
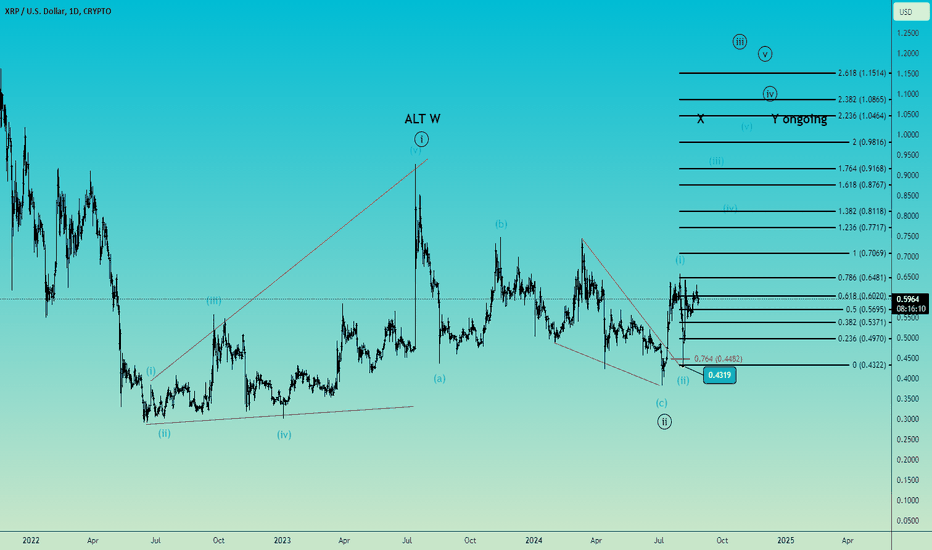
XRPUSD Elliott wave count

Above 0.4319 we are looking to the upside for wave (iii) targeting 1.618 fib projection of wave (i), above 0.87 USD.

Cross10XSignals
LINKUSD Elliott wave count

A complex correction ended at 7.864, wave ((ii)) into 0.618 fib retracement of wave ((i)) and wave (y) 123,6 % of wave (w). Above 9.934 we are looking to the upside for wave (i) of wave ((iii)). Possible target 19-20 USD. Watch my related idea.

Cross10XSignals
BTCUSD Elliott wave count

Updated the count with wave ((iii)) ended at 73805.27 and wave ((iv)) a flat correction. Wave (c) an expanding leading diagonal. Holding 53542.23 and clearing 63750.62 we are looking to the upside for wave ((v)). Intraday updates soon!We are looking for a possible leading diagonal wave i of (i) of ((v))Below 66100 we allow wave (4) of wave iii to unfold with key support levels 0.382-0.500 fib retracement of wave (3). Invalidation below 59780Wave (5) of 3 unfolding with possible target 68500-70000 USD

Cross10XSignals
LTCUSDT Elliott wave count

Litecoin bullish sequence in 5 waves, wave ((i)) started from 40.29 low to 115.05 high favors more upside. Wave ((ii)) pullback ended 55.00 low. Leading diagonal started from 55.00 low to 113.00 high for wave (i) of ((iii)) followed by a pullback started from 113.00 high to 67.28 low, a complex correction for wave (ii). Above 67.28 we are looking to the upside for wave (iii) of higher degree wave ((iii)). Clearing 89.67 will add more confidence that wave (iii) is unfolding. Possible target for wave (iii)) 200 - 215.

Cross10XSignals
ADAUSDT Elliott wave count

Cardano may find support into 0.618 fib retracement of wave ((1)) ending a complex correction started from 0.8104. Price must clear 0.49 level before we may declare an end of the correction at 0.3575. Also oscillators are showing bullish divergence that may signal a potential shift of the trend.

Cross10XSignals
ARBUSDT Elliott wave count

Arbitrum sitting on 0.618 fib retracement of wave ((i)) or ((a)) and support of previous low from 0.7390. Wave ((ii)) or ((b)) an expanded flat correction with wave (c) a 5 waves decline from 2.4250 to 0.7333 that broke below previous low 0.7390. At this level we are watching for evidences for a possible shift to the upside as oscillators are showing bullish divergence and trend to the downside is showing weakness. Price must clear 0.9984 and 1.2754 in 5 waves for a wave (i) of ((iii)) or ((c))). We will post updates soon with an intraday count. Hit the like button if you like my analysis and follow me for future updates and intraday count! Good luck!

Cross10XSignals
TONUSD

Oscillators divergence may signal wave ((3)) ended 8.2899 right into the 1.618 fib extension of wave i. Below 8.2899 we allow wave iv to unfold with possible support 0.382 fib retracement of wave iii. We are expecting the price to remain into the previous wave ((4)) span.Breaking above 8.2899 we are looking to the upside for wave v (the alternate count)
Disclaimer
Any content and materials included in Sahmeto's website and official communication channels are a compilation of personal opinions and analyses and are not binding. They do not constitute any recommendation for buying, selling, entering or exiting the stock market and cryptocurrency market. Also, all news and analyses included in the website and channels are merely republished information from official and unofficial domestic and foreign sources, and it is obvious that users of the said content are responsible for following up and ensuring the authenticity and accuracy of the materials. Therefore, while disclaiming responsibility, it is declared that the responsibility for any decision-making, action, and potential profit and loss in the capital market and cryptocurrency market lies with the trader.