
CharliMaxwell
@t_CharliMaxwell

What symbols does the trader recommend buying?
Purchase History
پیام های تریدر
Filter
Signal Type
CharliMaxwell
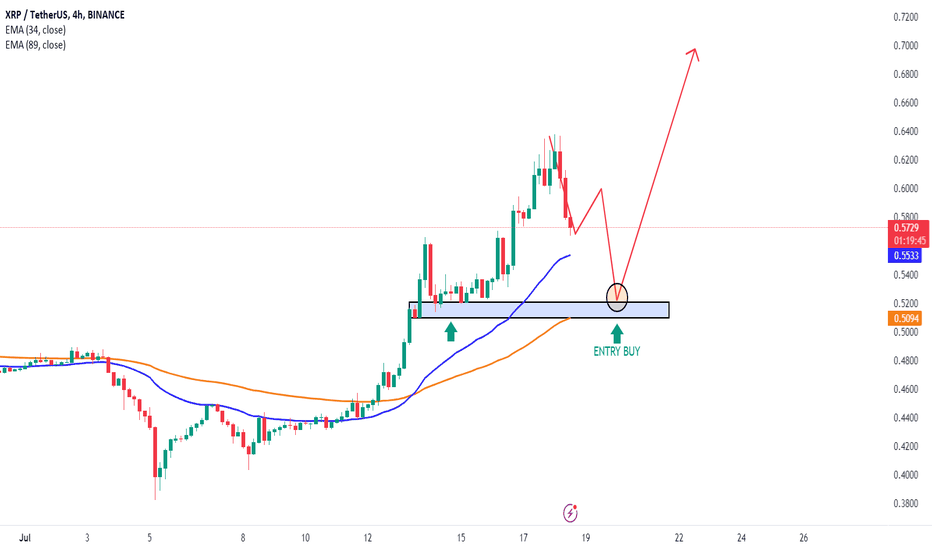
Let's discuss and strategize today! Main trends: The chart shows a strong uptrend, the price has crossed both the EMA 34 (blue) and EMA 89 (orange), indicating current bullish momentum. EMA lines: The EMA 34 (0.5532) is above the EMA 89 (0.5094), which confirms the long-term price uptrend. The current price line (0.5714) is also above both EMA lines, further reinforcing the bullish signal. Support area: There is an important support zone at around 0.5450-0.5500, marked with a blue rectangle. This is the area where the price may return to test before continuing the uptrend. Price model: It is forecasted that the price may fall to the support area of 0.5450-0.5500 before rebounding. A bullish pattern with a red arrow has been drawn, showing the expectation of a strong increase in price after touching the support zone. Trading recommendations: Buy: When the price turns back and tests the support zone of 0.5450-0.5500, this is a good entry point. Stop Loss: Set the stop loss below the support zone, around 0.5400 to avoid risk. Take Profit: The take profit target could be the 0.6200-0.6500 price range, based on previous resistance levels.
CharliMaxwell
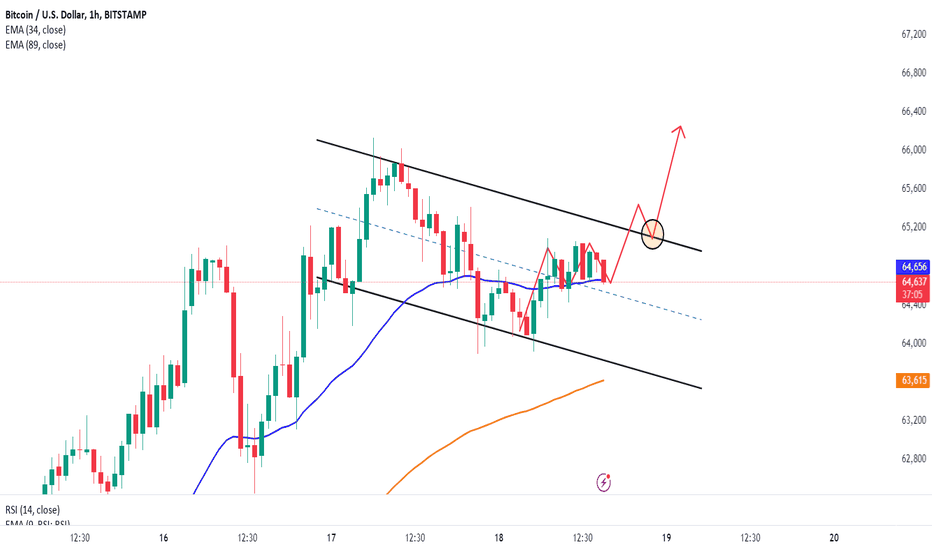
Hello dear traders! Let's synthesize and conclude today's strategy! Analyze trends and price channels Current trend: BTCUSD is moving in a bearish price channel (between the two black channel lines). This is a sign that prices are trending down in the short term. But! There are signs that a falling wedge pattern is forming. Theoretically if the price breaks above the resistance line, it is a strong bullish signal. Support and resistance levels Support: The price is currently near the support level at EMA 34 (64,660) and EMA 89 (63,617). These levels could keep prices from falling further. Resistance: The upper price channel (black channel line above) and the price level around 65,000 are important resistance levels. Trend prediction Bullish potential: If BTCUSD can break the falling price channel and overcome the resistance at 65,000, the price is likely to continue moving higher. This is illustrated by the red arrow pointing up. In short, the main strategy here is to wait for a breakout above the resistance line of the wedge pattern. This breakout usually signals a strong uptrend.Trade active
CharliMaxwell
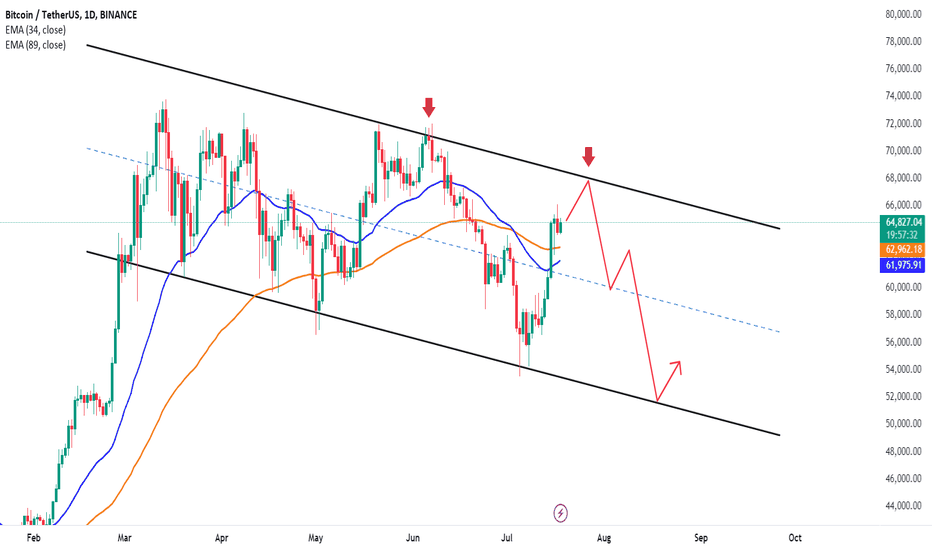
BTCUSDT: The downward momentum has not stopped yet 1. Price range and trend lines: The chart shows that BTCUSDT is in a falling price channel, defined by two parallel trend lines The red arrows indicate the points where the price touched the upper trendline and turned down. 2. Moving average (EMA): Currently, the price is above both EMAs, showing a short-term uptrend. 3. Analyze patterns and signals: The price is gradually approaching the upper trend line of the down channel and is likely to encounter strong resistance here. Forecast: If the price continues to encounter resistance at the upper trendline and cannot overcome it, it is likely that the price will fall again and continue to move within the falling price channel.Trade active
Disclaimer
Any content and materials included in Sahmeto's website and official communication channels are a compilation of personal opinions and analyses and are not binding. They do not constitute any recommendation for buying, selling, entering or exiting the stock market and cryptocurrency market. Also, all news and analyses included in the website and channels are merely republished information from official and unofficial domestic and foreign sources, and it is obvious that users of the said content are responsible for following up and ensuring the authenticity and accuracy of the materials. Therefore, while disclaiming responsibility, it is declared that the responsibility for any decision-making, action, and potential profit and loss in the capital market and cryptocurrency market lies with the trader.