
Bybitkiller
@t_Bybitkiller

What symbols does the trader recommend buying?
Purchase History
پیام های تریدر
Filter
INJ

We stood for the second time at 2990₽ and we can’t go higher. The patterns of the golden cross and triangles have already been fully worked out, the moving averages are tightening up, there is a local maximum zone again, what next? On the short-term chart, the asset has almost completely completed the symmetrical triangle pattern, approaching the local resistance level (previous highs), and the rollback from this level is also within normal limits. I expect a rollback to 2800~2850₽, then go through the local maximum and resistance zone 3 times (I see it at the level of 3017.5₽). By the end of the year there is a great chance to reach 3100 rubles, and the prospect of growth up to 3300 rubles
TRB

We stood for the second time at 2990₽ and we can’t go higher. The patterns of the golden cross and triangles have already been fully worked out, the moving averages are tightening up, there is a local maximum zone again, what next? On the short-term chart, the asset has almost completely completed the symmetrical triangle pattern, approaching the local resistance level (previous highs), and the rollback from this level is also within normal limits. I expect a rollback to 2800~2850₽, then go through the local maximum and resistance zone 3 times (I see it at the level of 3017.5₽). By the end of the year there is a great chance to reach 3100 rubles, and the prospect of growth up to 3300 rubles
rif

We stood for the second time at 2990₽ and we can’t go higher. The patterns of the golden cross and triangles have already been fully worked out, the moving averages are tightening up, there is a local maximum zone again, what next? On the short-term chart, the asset has almost completely completed the symmetrical triangle pattern, approaching the local resistance level (previous highs), and the rollback from this level is also within normal limits. I expect a rollback to 2800~2850₽, then go through the local maximum and resistance zone 3 times (I see it at the level of 3017.5₽). By the end of the year there is a great chance to reach 3100 rubles, and the prospect of growth up to 3300 rubles
CTSI
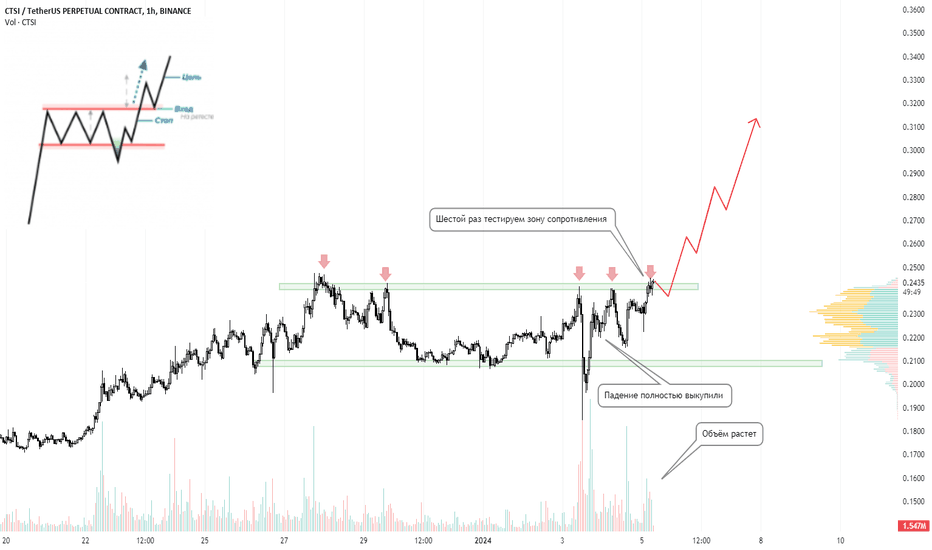
We stood for the second time at 2990₽ and we can’t go higher. The patterns of the golden cross and triangles have already been fully worked out, the moving averages are tightening up, there is a local maximum zone again, what next? On the short-term chart, the asset has almost completely completed the symmetrical triangle pattern, approaching the local resistance level (previous highs), and the rollback from this level is also within normal limits. I expect a rollback to 2800~2850₽, then go through the local maximum and resistance zone 3 times (I see it at the level of 3017.5₽). By the end of the year there is a great chance to reach 3100 rubles, and the prospect of growth up to 3300 rubles
Iota
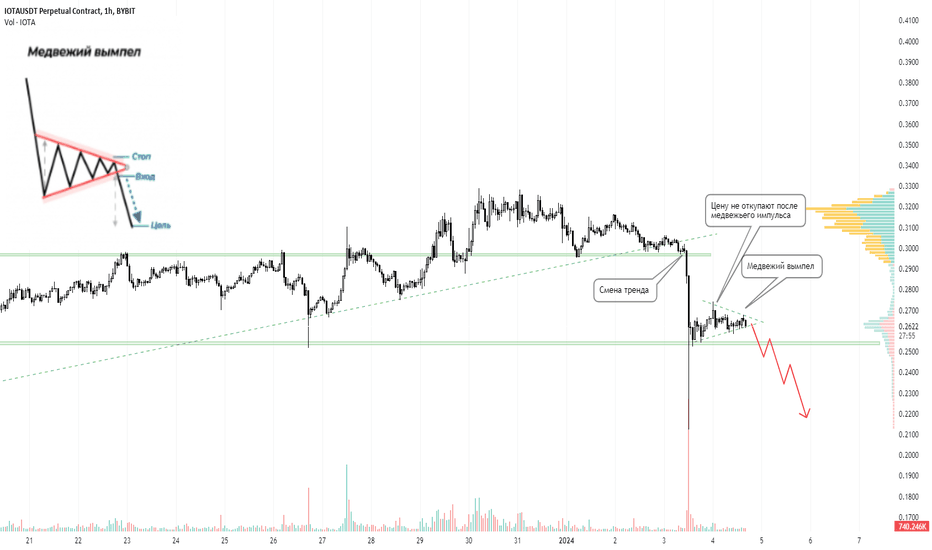
We stood for the second time at 2990₽ and we can’t go higher. The patterns of the golden cross and triangles have already been fully worked out, the moving averages are tightening up, there is a local maximum zone again, what next? On the short-term chart, the asset has almost completely completed the symmetrical triangle pattern, approaching the local resistance level (previous highs), and the rollback from this level is also within normal limits. I expect a rollback to 2800~2850₽, then go through the local maximum and resistance zone 3 times (I see it at the level of 3017.5₽). By the end of the year there is a great chance to reach 3100 rubles, and the prospect of growth up to 3300 rubles
ETHUSDT

With today's squeeze, we collected a huge number of stops from the longs, so there should be enough strength to overcome. It makes sense to try to open longs from the current ones, but always with a stop. You can send it below $2,200. Takes in the range of $2,400-2,600 Don't forget the ETF is coming
BOND

The asset was under strong pressure from short participants and reached a value of $0.49255, where buyers began to show their activity, and the price gradually started to rise. Subsequently, the coin began to form the 'Cup and Handle' chart pattern, indicating the presence of strong buyers. The final confirmation of this pattern occurs when the asset breaks through the resistance level from which its formation began, as we can observe on the chart.
TRB

Entry price: 0.4450 (2% of the deposit) + 0.4700 (3% of the deposit) LIMITED! TP: 0.3800 SL: I don’t put it yet, I’ll let you know
RIFI

"Active has shown a significant decrease, reaching a strong support level at $0.4946, which has been unsuccessfully tested multiple times. Subsequently, a 'Triple Bottom' pattern has formed on the chart, indicating a reversal, as observed in the chart. After reaching the minimum price for the third time, there was a rebound followed by a steady price increase.
ORBS

"Active has shown a significant decrease, reaching a strong support level at $0.4946, which has been unsuccessfully tested multiple times. Subsequently, a 'Triple Bottom' pattern has formed on the chart, indicating a reversal, as observed in the chart. After reaching the minimum price for the third time, there was a rebound followed by a steady price increase.
Disclaimer
Any content and materials included in Sahmeto's website and official communication channels are a compilation of personal opinions and analyses and are not binding. They do not constitute any recommendation for buying, selling, entering or exiting the stock market and cryptocurrency market. Also, all news and analyses included in the website and channels are merely republished information from official and unofficial domestic and foreign sources, and it is obvious that users of the said content are responsible for following up and ensuring the authenticity and accuracy of the materials. Therefore, while disclaiming responsibility, it is declared that the responsibility for any decision-making, action, and potential profit and loss in the capital market and cryptocurrency market lies with the trader.