
Bixley
@t_Bixley

What symbols does the trader recommend buying?
Purchase History
پیام های تریدر
Filter
Bixley

Bixley
AAPL - Bearish Idea
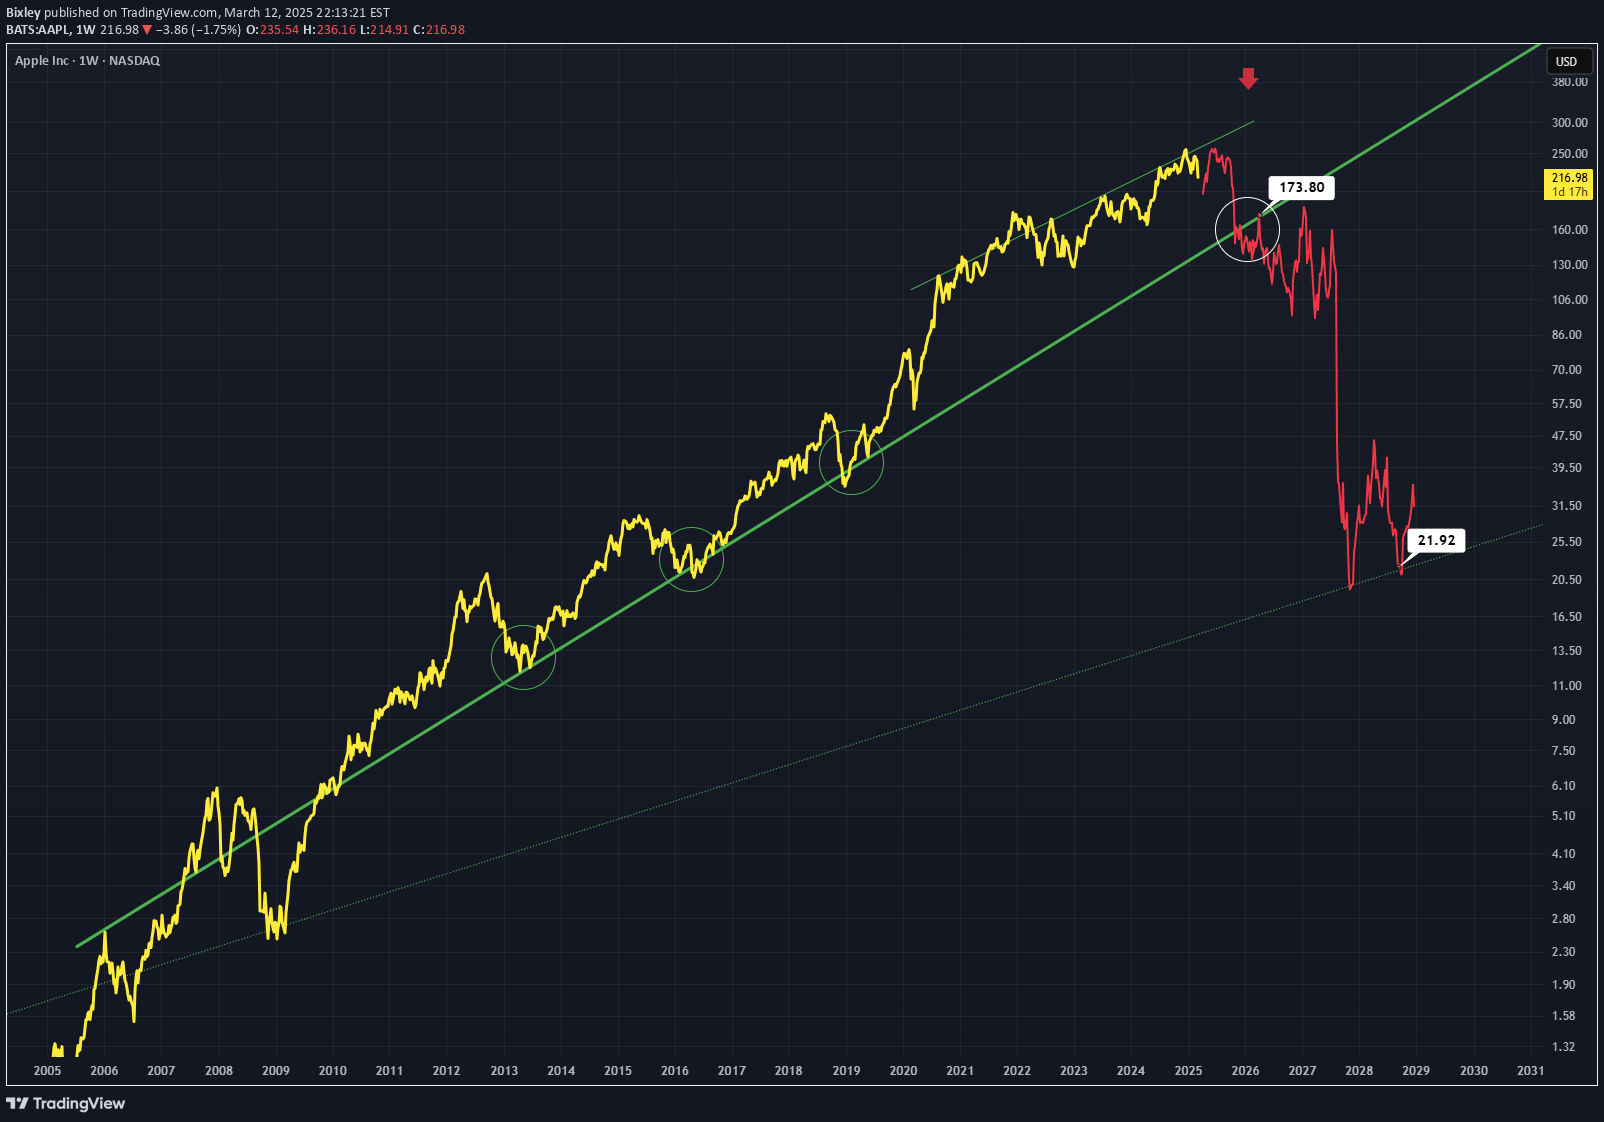
AAPL has been moving consistently up the green solid line, finding support over and over again Will this continue? (white circle) If not will we see a break down to a lower trend line (dotted line) This dotted trend line extends further back on the Monthly timeframe which I can't really show on this Weekly timeframe I am bearish
Bixley
NVDA - Bearish Idea
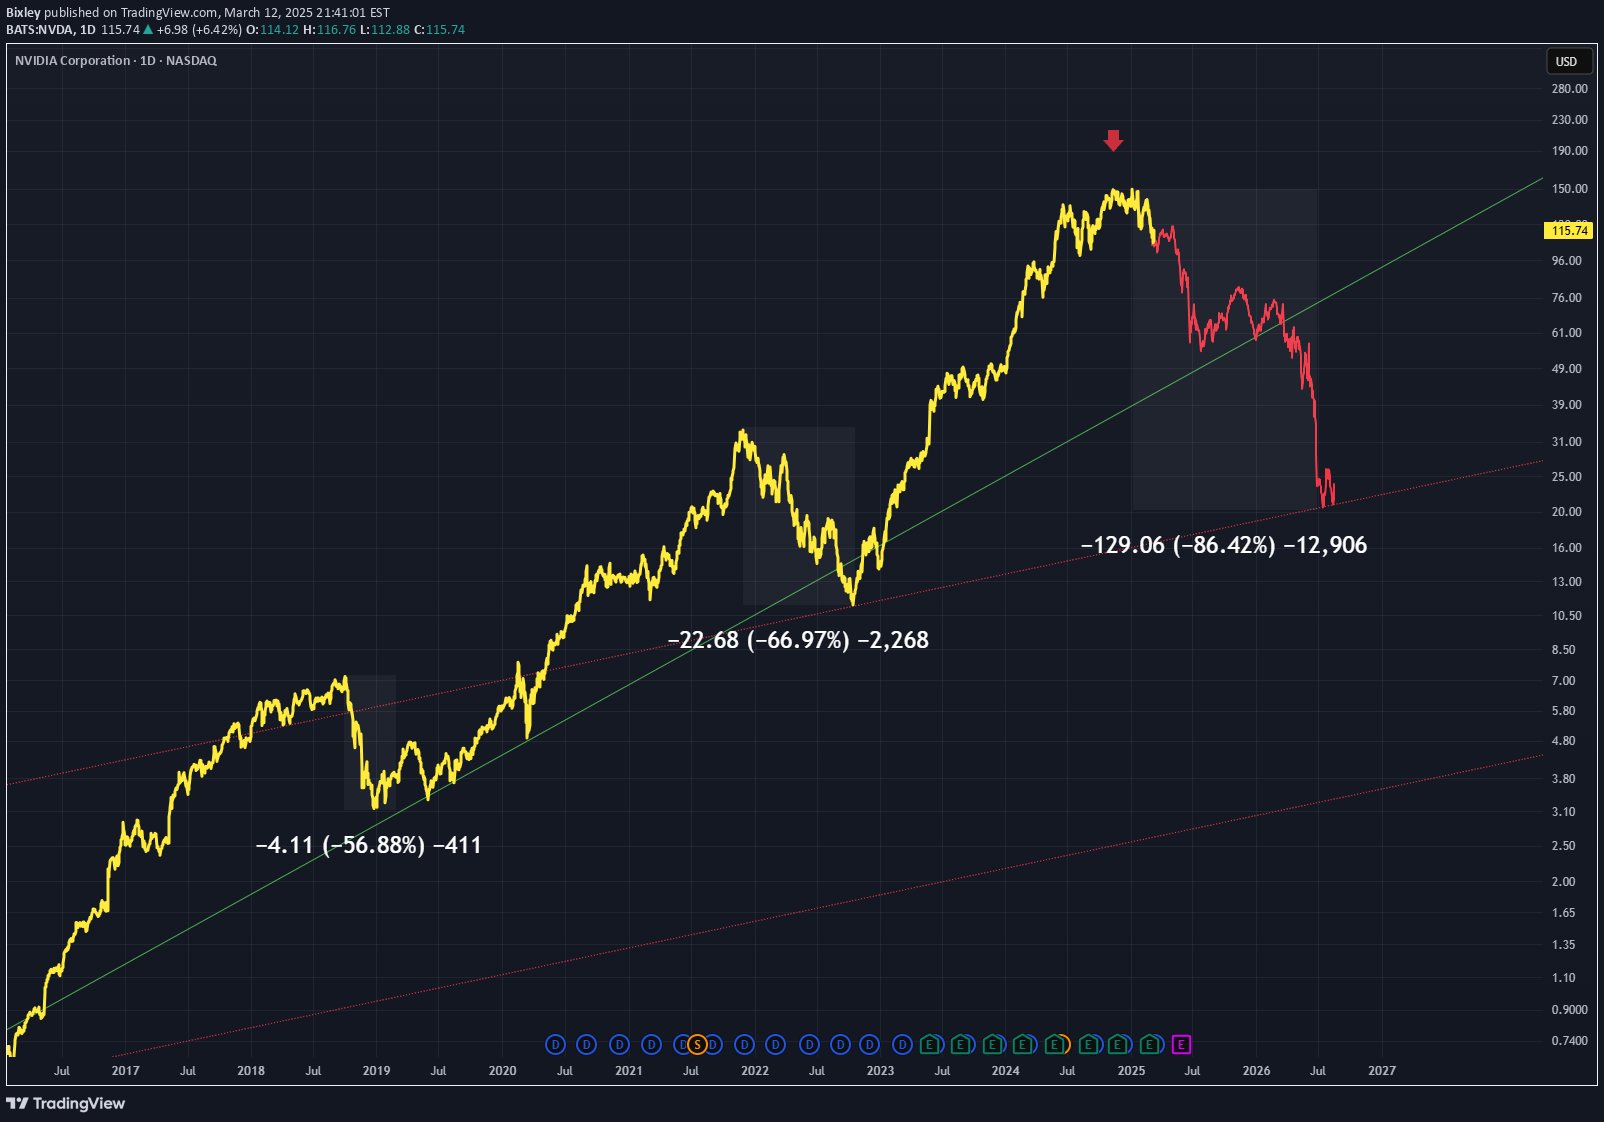
A Three downward move situation with the last dip being the largest pushing price down to a lower trend line in red (dotted line) Bars pattern tool in red shows my thoughts of the bearish movement I think price will continue down below the green line that has previously been seen as support Daily chart
Bixley
BTCUSD - If it is a Similar Situation to 2017

If we are experiencing a similar run to 2017 we would be 847days into the bull runI have shown the bars pattern for where price could go with the rest of the time left, which shows a 3500% gain this bull market. This is compared to the 2017 run which was a 9000% gain to the top.We have some bull time left is the take away if the runs are comparable.Weekly chart.
Bixley
BGBUSD - Bull Breakdown

BGBUSD has seen some incredible up movement so i expect this curved up trend to break down which i have shown with the green bars tool.I have two support targets shown with the price label tool along the dashed red horizontalsDaily timeframe
Bixley
SHIBUSD - Wild Triangle Idea

Drawing a massive triangle between the previous peak of SHIBFrom that peak price has mainly moved horizontally with not many breakoutsPerhaps we will see movement out of this triangle like what was seen in the early bull run for SHIBSpeculative ideaWeekly timeframe
Bixley
SOLUSDT - Move Down to Stronger Trend Line

Trend Line in green is a good position for price to reverse in the bulls favor This aligns well with the 0.786 fib lineAs you can see it has broken down out of a small channel shown in the green dotted sectionWeekly timeframe
Bixley
Ethereum - Bottom Test

Ethereum is attempting to find a bottom before attempting its next leg of the bull runThis touch is shown along the yellow dotted line which I have shown in the green circlesBulls will have there day when this line is testedThis also aligns with the 0.618 fibWeekly timeframe
Bixley
XRPUSD - Not Done Yet

XRPUSD has poised itself above this line that is now supportPreviously it was resistance in the last bull runA support here allows for further movement upwardXRP is not doneVery bullish daily chart
Bixley

Waiting for this down channel that has appeared on this hourly chart to break and the next bull move to ensue on ENSUSDMany attempts have been made but it should eventuate soonThe curved arrow is how I expect price to act as it breaks out1Hr chart
Disclaimer
Any content and materials included in Sahmeto's website and official communication channels are a compilation of personal opinions and analyses and are not binding. They do not constitute any recommendation for buying, selling, entering or exiting the stock market and cryptocurrency market. Also, all news and analyses included in the website and channels are merely republished information from official and unofficial domestic and foreign sources, and it is obvious that users of the said content are responsible for following up and ensuring the authenticity and accuracy of the materials. Therefore, while disclaiming responsibility, it is declared that the responsibility for any decision-making, action, and potential profit and loss in the capital market and cryptocurrency market lies with the trader.