Bimbi92GOLD
@t_Bimbi92GOLD
What symbols does the trader recommend buying?
Purchase History
پیام های تریدر
Filter
Signal Type
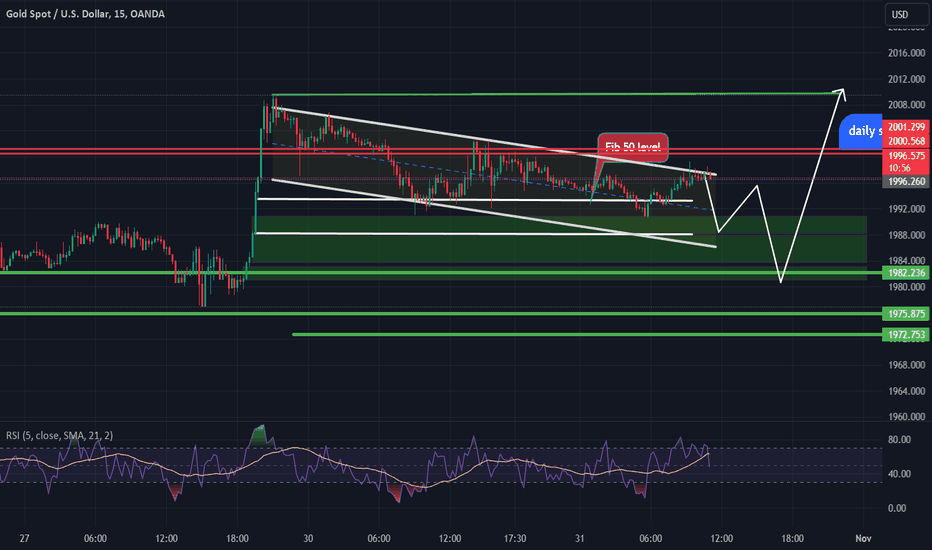
My idea is market will retest the 1989 price level and then again price will up for 2004 level.
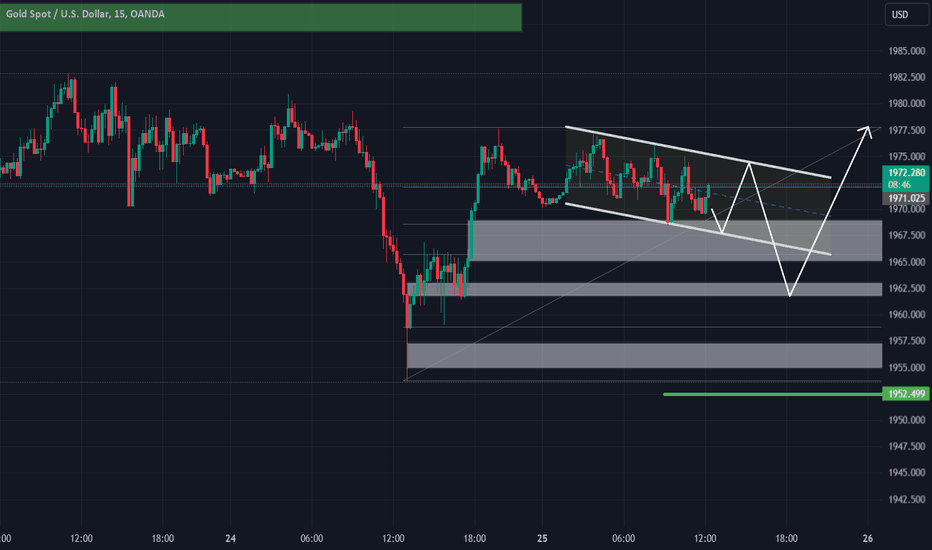
Considering the market structure, According to my analysis the market is in a weak bearish pattern. I expect a little bearish movement toward the 1961 price level and a bullish move towards the 1977 price level.
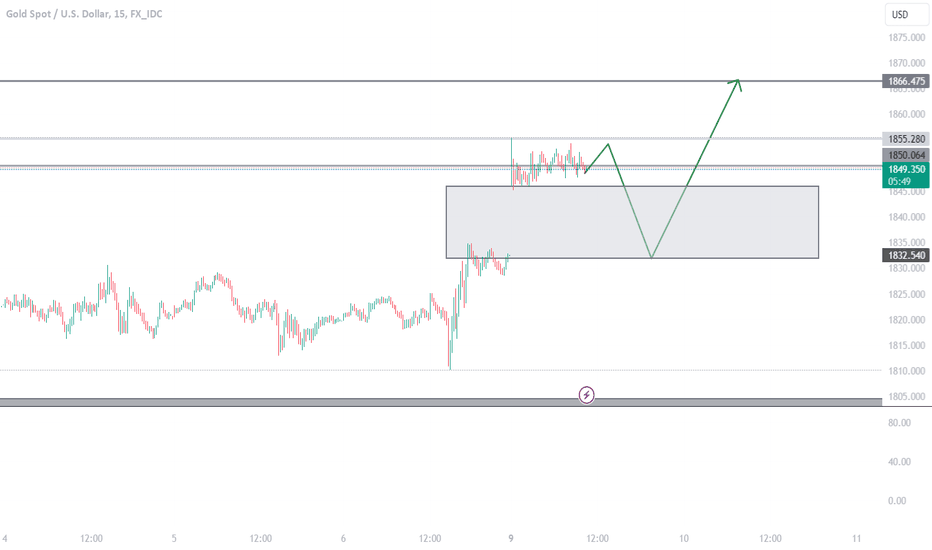
As I expected in long time frame, the market has clearly fulfilled my idea. But according to the chart we can see an imbalance between the 1832-1845 area. Therefore, my personal idea is market will retest for 1932 area and then again will increase to 1866 level. As a newbie to the trading world I am just sharing my idea and if anyone have different idea or wants to make any corrections of my idea feel free to share your thoughts in comments box.
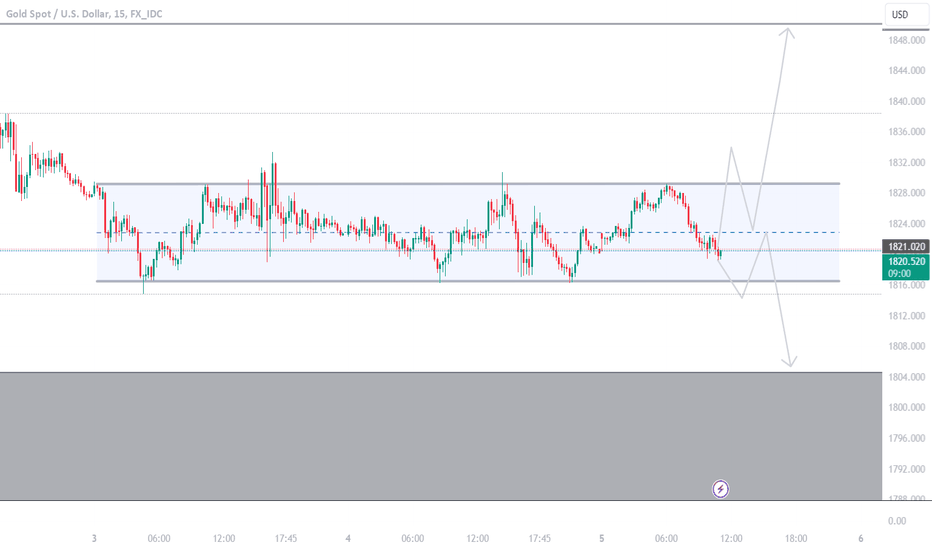
Examining the gold chart, the market did not able to break the range to have impulsive moment. So according to my analysis if the market breaks the range above the 1830 level, the market will retest the price of 1920 and then continue to the expected price level of 1948. If the market breaks the range below the 1815 level, then we can expect again a retest of 1920 level and a continuation towards the level between 1806-1787.still price falling in the rage and wait for the breaks from 1930 level for a uptrend
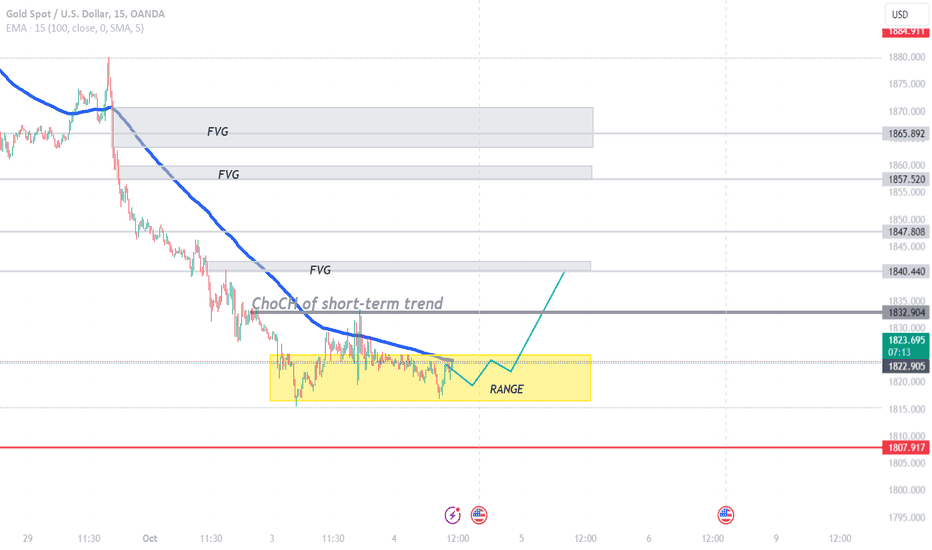
Considering the gold chart, now the market is in a range between 1816 to 1825. According to the 15-minute time frame I am expecting the market will reach 1840. And in a higher time, frame such as 4hrs chart I am expecting to price will gradually reach for 1847,1857 and 1865. However, to reach these levels we must wait till at least 1hr. candle closing over the 1830 price.
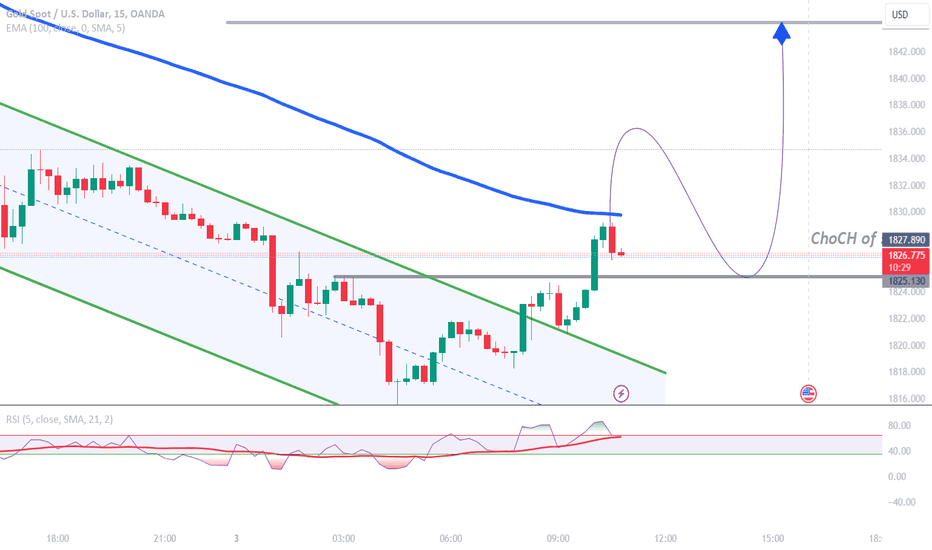
According to the gold chart, as we expected, it almost covered the FVG which was up to 1824 area. So now we can see the price is running in the predicted demand area. So as per the daily chart we can expect the price will reach gradually to 1838, 1841 and 1844 area. Today we can see some important news such as JOLTs Job opening which is highly impact to the market and FOMC member will speak which can give medium impact. So according to my analysis will see whether we can get support from fundamental analysis.
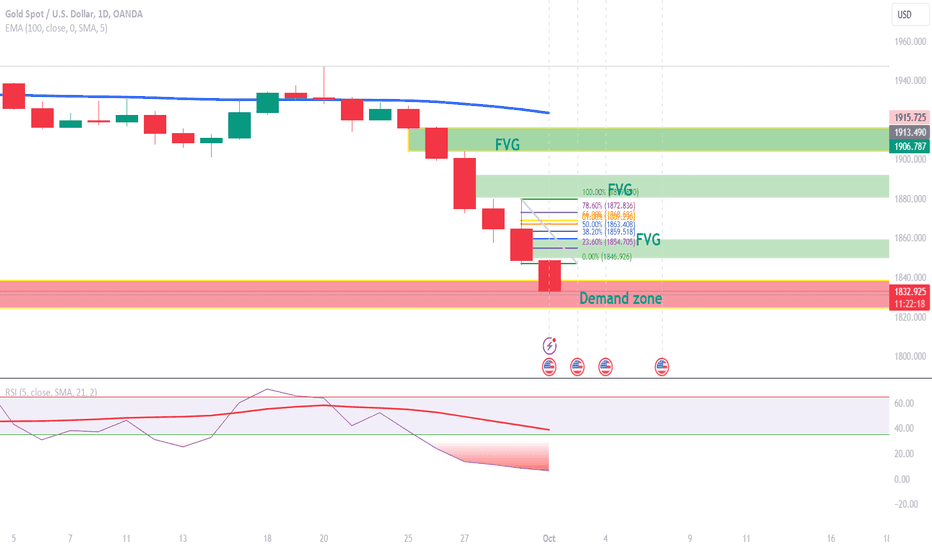
As per the daily chart, the gold market has closed in previous day as a bearish candle. According to my analysis gold will show a bullish movement if the market needs to make a correction. In this case we can monitor 1859, 1863 167 and 1868 levels to see the continuation of bearish market. And the targeted support area is the 1835-1824 zone.
Disclaimer
Any content and materials included in Sahmeto's website and official communication channels are a compilation of personal opinions and analyses and are not binding. They do not constitute any recommendation for buying, selling, entering or exiting the stock market and cryptocurrency market. Also, all news and analyses included in the website and channels are merely republished information from official and unofficial domestic and foreign sources, and it is obvious that users of the said content are responsible for following up and ensuring the authenticity and accuracy of the materials. Therefore, while disclaiming responsibility, it is declared that the responsibility for any decision-making, action, and potential profit and loss in the capital market and cryptocurrency market lies with the trader.