
BgAjie
@t_BgAjie

What symbols does the trader recommend buying?
Purchase History
پیام های تریدر
Filter
BgAjie
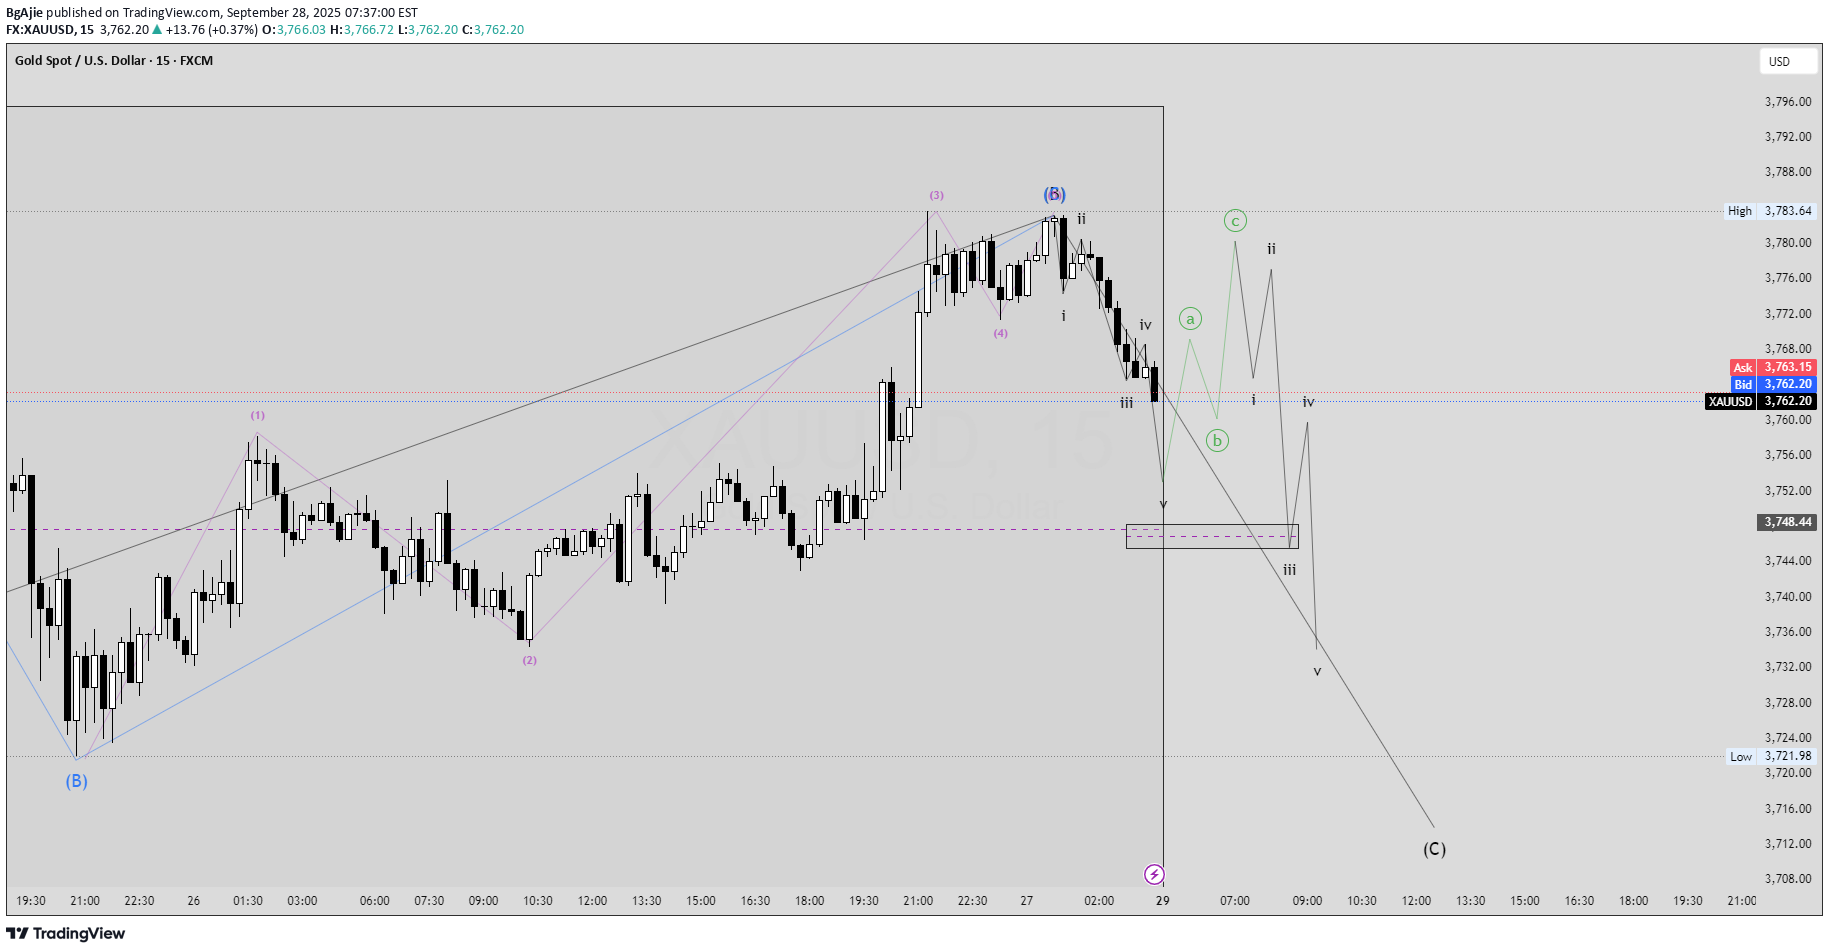
The chart shows XAU/USD (Gold vs. US Dollar) on the 5-minute timeframe with an Elliott Wave structure applied. 1. Wave Count The recent upward move completed with wave (3) at the top, followed by a corrective wave (4). After that, the structure moved into a wave (5) decline, which subdivides into smaller impulsive waves i–v. The current price action is around the end of the minor wave v, suggesting that the downward movement may be close to finishing. 2. Support Zone There is a highlighted rectangular support area around 3748–3750, where wave v is projected to end. This zone will be crucial for a potential rebound. 3. Possible Scenarios Bullish Case: If price holds above the support box, an ABC corrective bounce (green a–b–c) is expected, pushing price back toward the 3770–3780 zone. Bearish Continuation: If the bounce is weak and fails to break resistance, another impulsive move lower is projected, targeting 3735–3720, completing a larger five-wave decline. 4. Key Levels to Watch Resistance: 3770–3780 (where corrective wave c could terminate). Support: 3748–3750 (potential end of current downtrend). Further downside target: 3720 if bearish momentum continues.
BgAjie
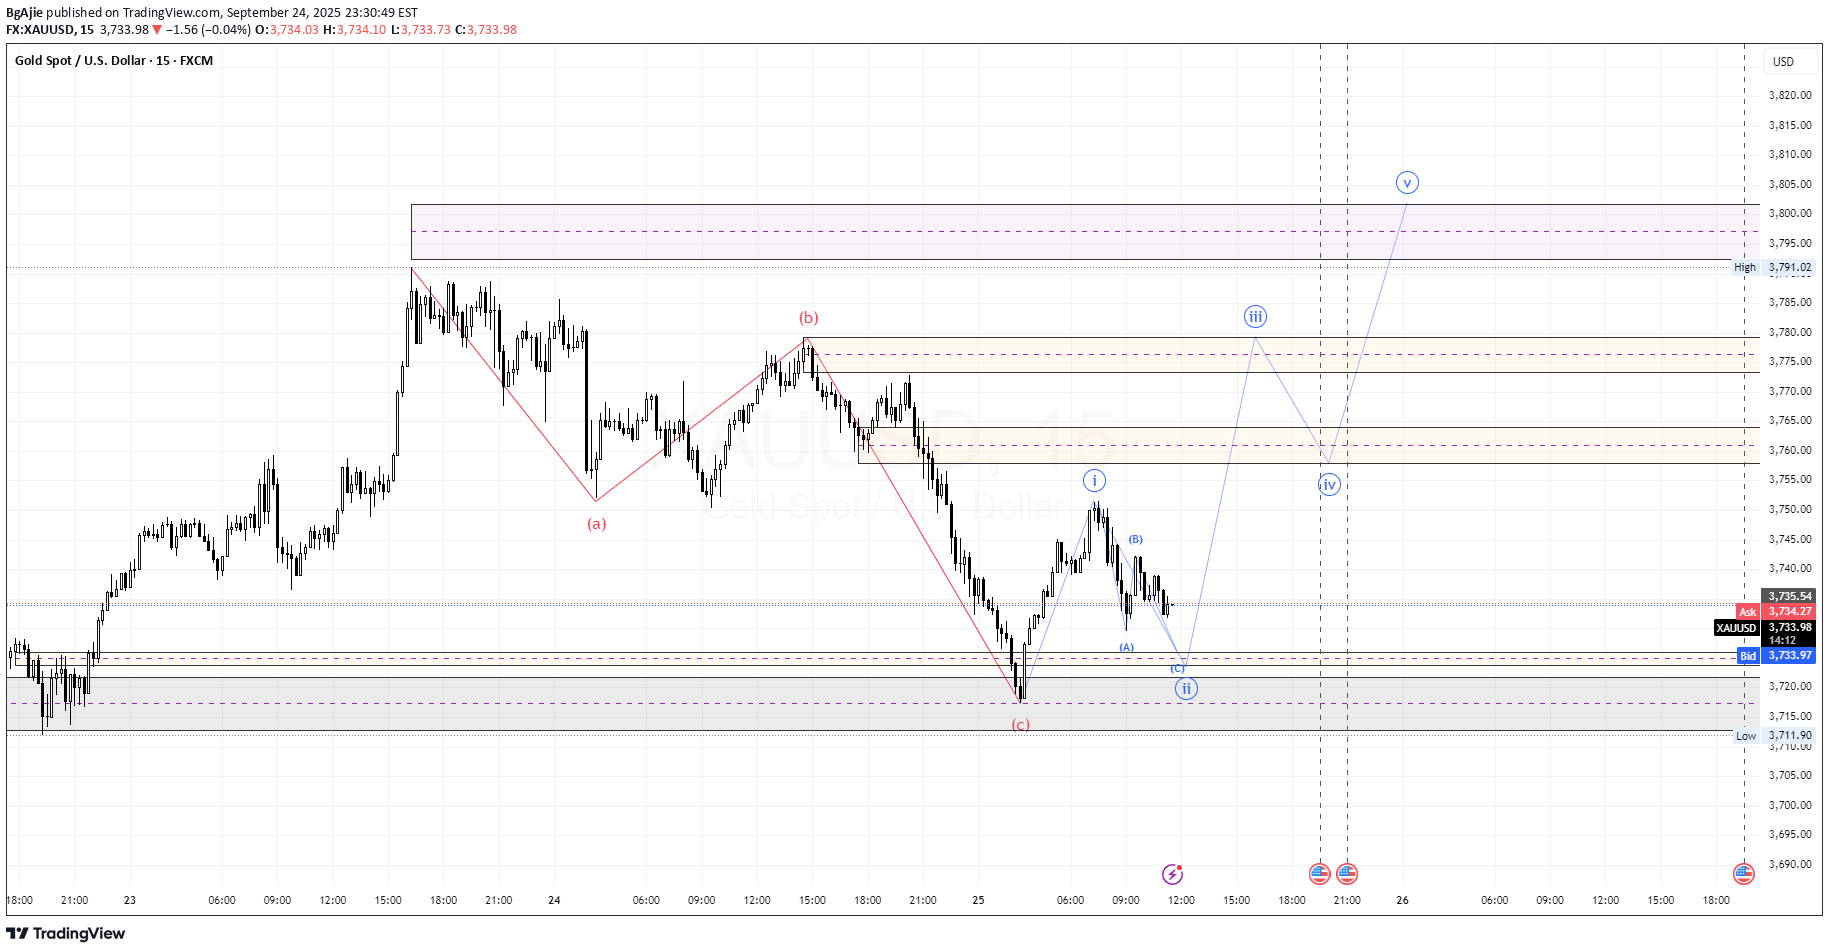
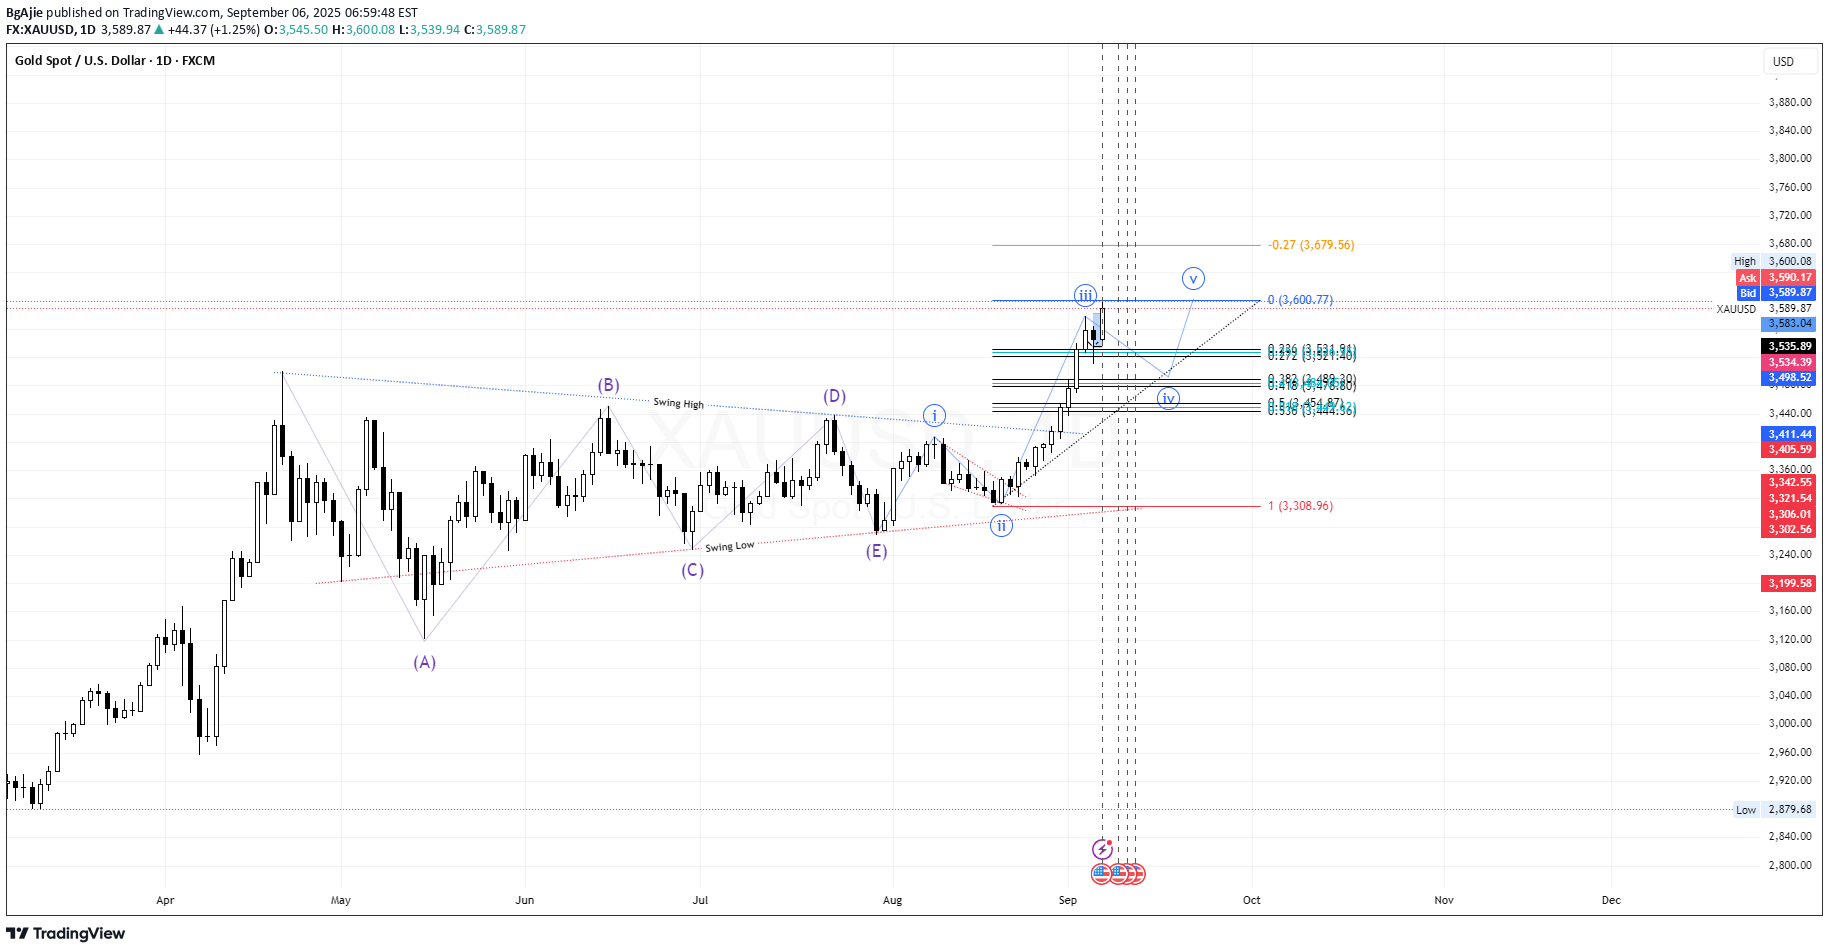
Analysis Conclusion: Wave Structure The red ABC correction (a–b–c) looks completed, signaling the end of a downward corrective phase. Price is currently building an impulsive structure upward (blue i–ii–iii–iv–v). Wave (i) has formed, and price is now in the wave (ii) correction (small ABC in blue). Key Support Area Major support is around 3710 – 3720 (gray box zone). As long as this level holds, the bullish reversal scenario remains valid. Resistance / Upside Targets First target zone: 3755 – 3765 (expected wave iii area). Higher target: 3790 – 3800 (completion of wave v, near supply zone). Price Scenarios Main Bullish Scenario: Holding above 3710–3720 could trigger wave (iii) towards 3760+, followed by 3790–3800. Alternative Bearish Scenario: If price breaks below 3710, the bullish count is invalidated, and price may extend lower toward 3695 or further. 📌 Summary: Short-term trend: Bullish potential (impulse up in progress). Key support: 3710–3720. Upside targets: 3760, then 3790–3800. Invalidation: Break below 3710.
BgAjie
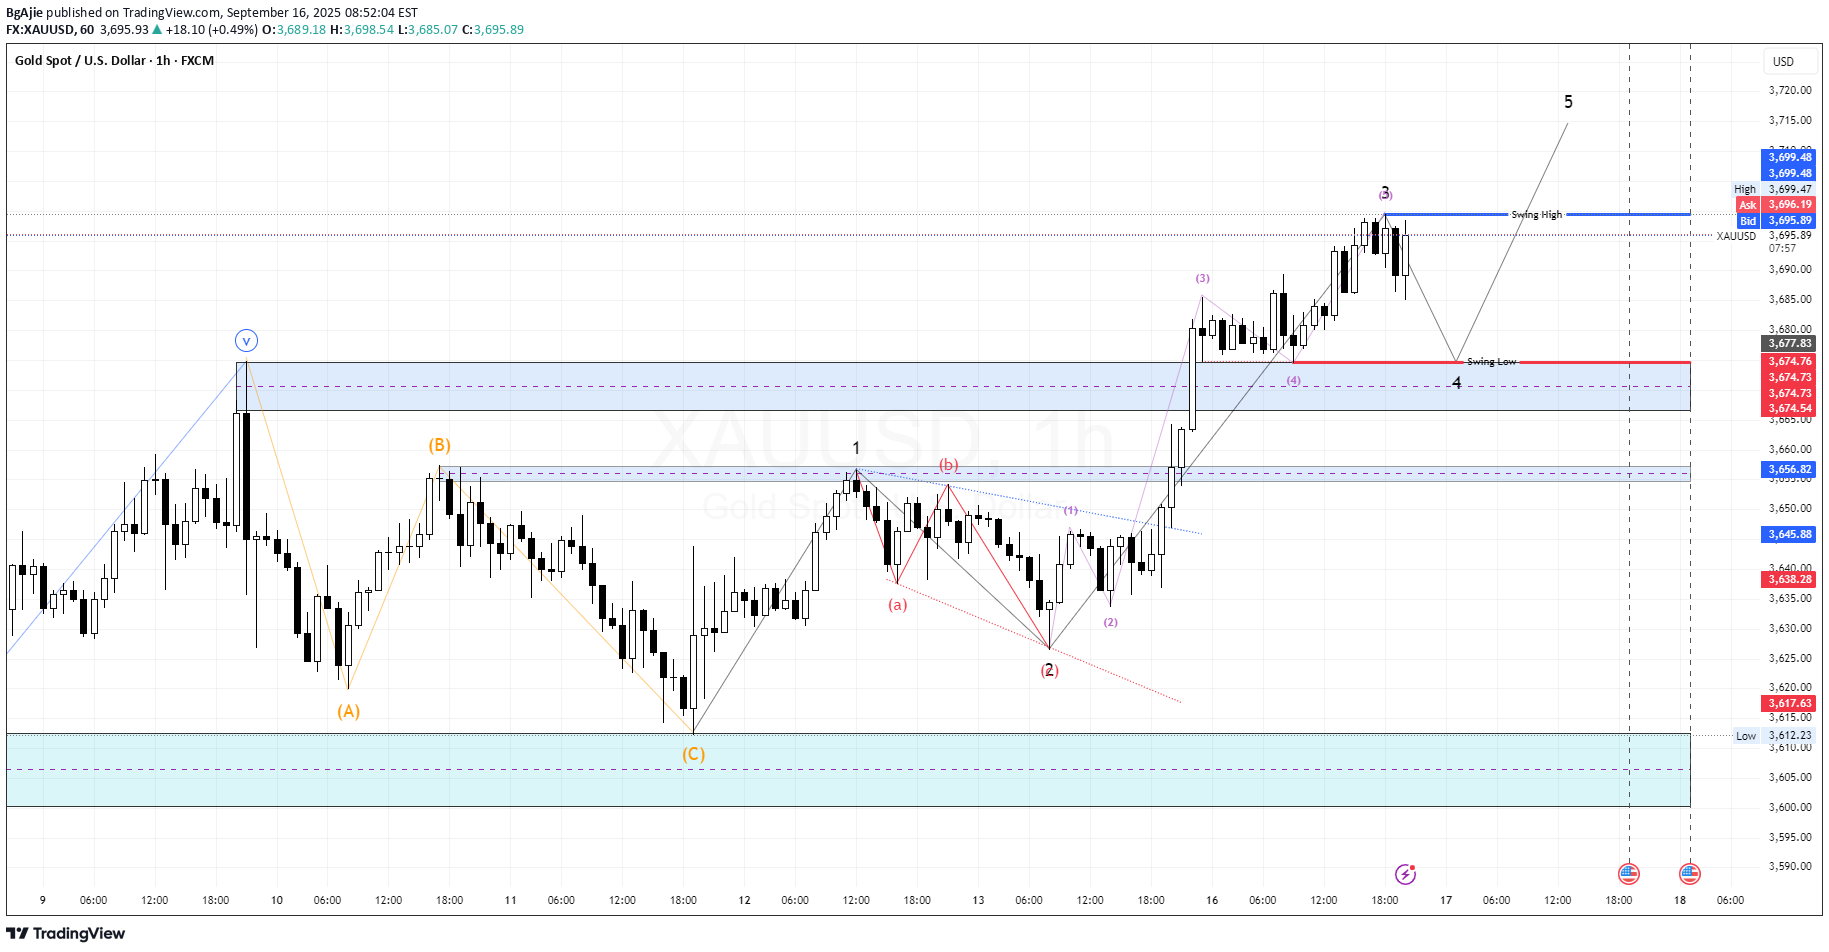
Chart Analysis (XAUUSD – Gold vs USD, 1H) Timeframe: 1 Hour (H1). Elliott Wave Structure: The previous correction is labeled (A)–(B)–(C). After that, the market started an impulsive wave: (1) → (2) → (3) → now likely in (4) and preparing for (5). Key Levels: Swing High (Resistance): around 3699.48. Swing Low (Support): around 3677.83 – 3674.54 → potential area for wave (4). Next support if broken: 3656.82 – 3645.88. Main Scenario (Bullish): Price is currently in a wave (4) correction. If it holds above 3677 – 3674, then wave (5) upside continuation is expected. Target wave (5): 3710 – 3720 (above the swing high). Alternative Scenario (Bearish): If the price breaks and closes below 3674, the correction could extend toward 3656 – 3645. This would delay the wave (5) formation. 📝 Trading Plan: Buy on Dip: wait for a pullback to 3677 – 3674 area, look for confirmation (rejection candle / bullish engulfing). 🎯 Target: 3710 – 3720 🛑 Stop Loss: below 3670 Sell Short: if price breaks and closes strongly below 3674, 🎯 Target: 3656 – 3645 🛑 Stop Loss: above 3685
BgAjie
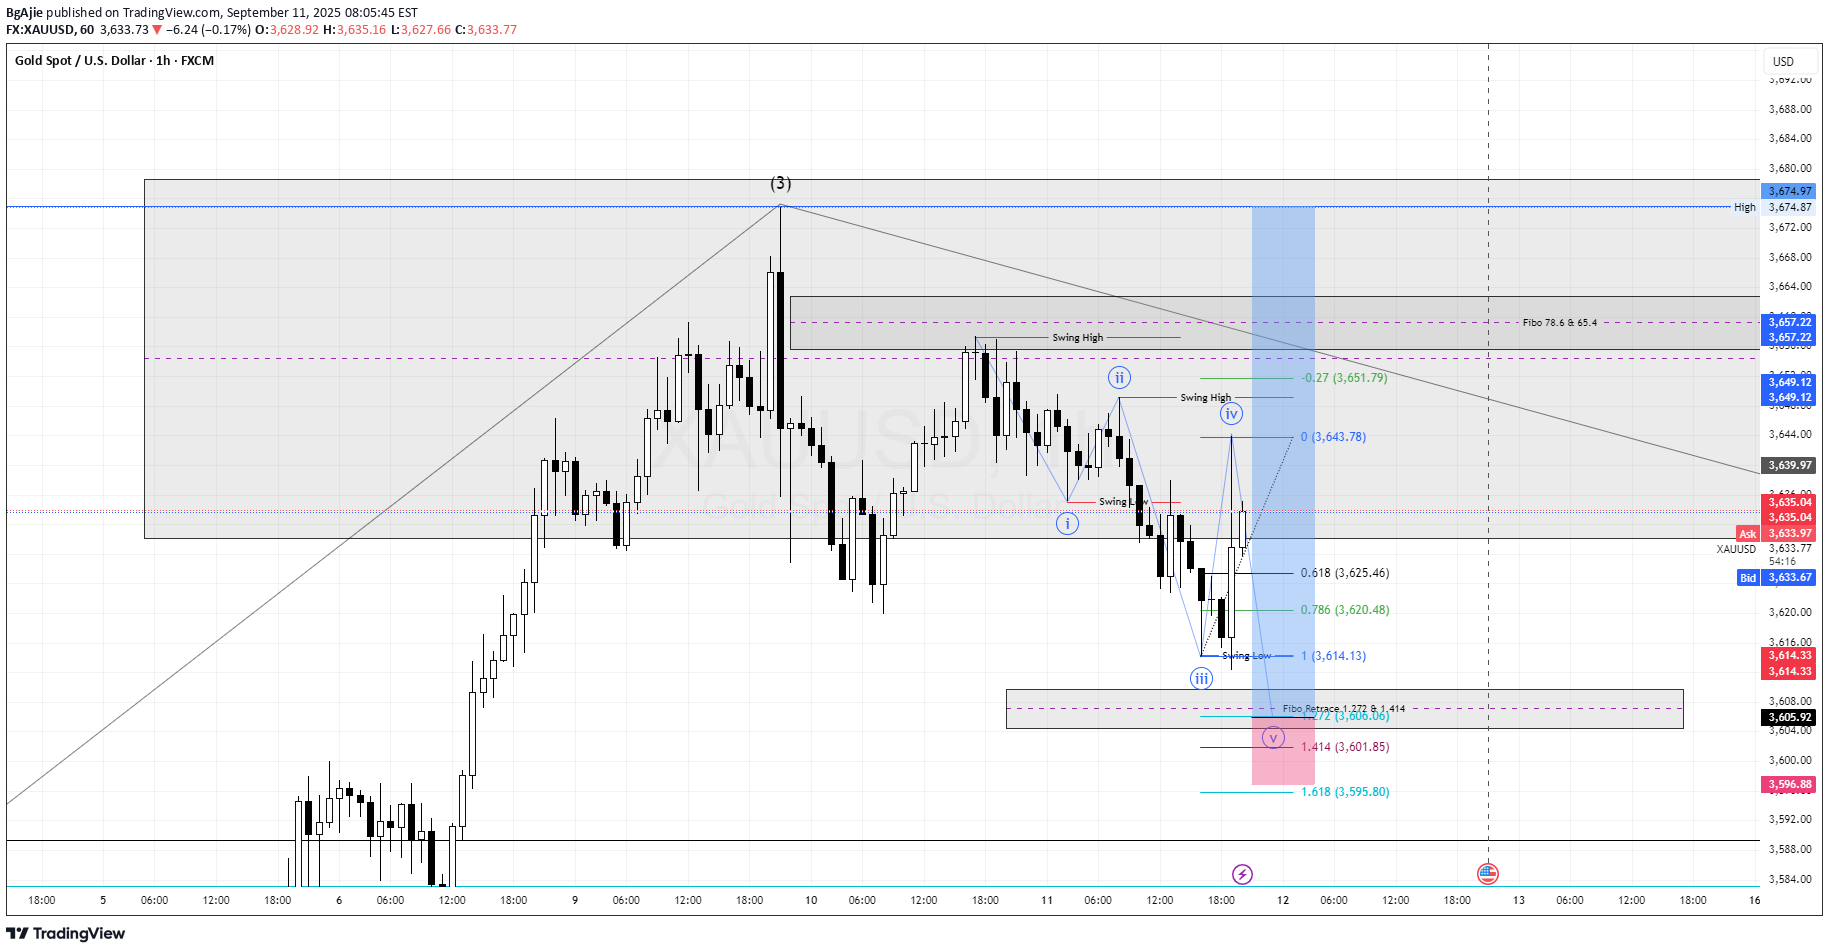
1. Market Structure (Elliott Wave) The chart shows Elliott Wave labeling: Wave (i), (ii), (iii), currently in corrective wave (iv). Next expectation: continuation down into wave (v). 2. Key Fibonacci Levels Wave (iv) retracement already tested the 0.618 – 0.786 Fibo retrace zone (3625 – 3620). Potential wave (v) downside targets: 1.272 Fibo extension → 3606 1.414 Fibo extension → 3601 1.618 Fibo extension → 3595 3. Trade Confirmation Current price: 3631. Already showing rejection around wave (iv). Confirmation needed: Bearish candle close below 3625 (0.618 Fibo) → signals start of wave (v). 👉 Possible trade setup: Sell Entry: 3628–3635 (retracement zone of wave iv). Stop Loss: Above swing high wave (iv) = ~3643. Take Profit targets: TP1 = 3614 (Fibo 1.0) TP2 = 3606 (Fibo 1.272) TP3 = 3595 (Fibo 1.618) 4. Alternative Scenario (Invalidation) If price breaks & closes above 3643, wave (iv) is invalidated. Market could aim higher retracement levels (3657 – 3674). 📌 Trading Plan Summary Status: Wait for bearish confirmation candle close below 3625. If confirmed → Open Sell with SL 3643, TP range 3614 → 3595. If price breaks 3643 → cancel sell setup, reassess structure.
BgAjie
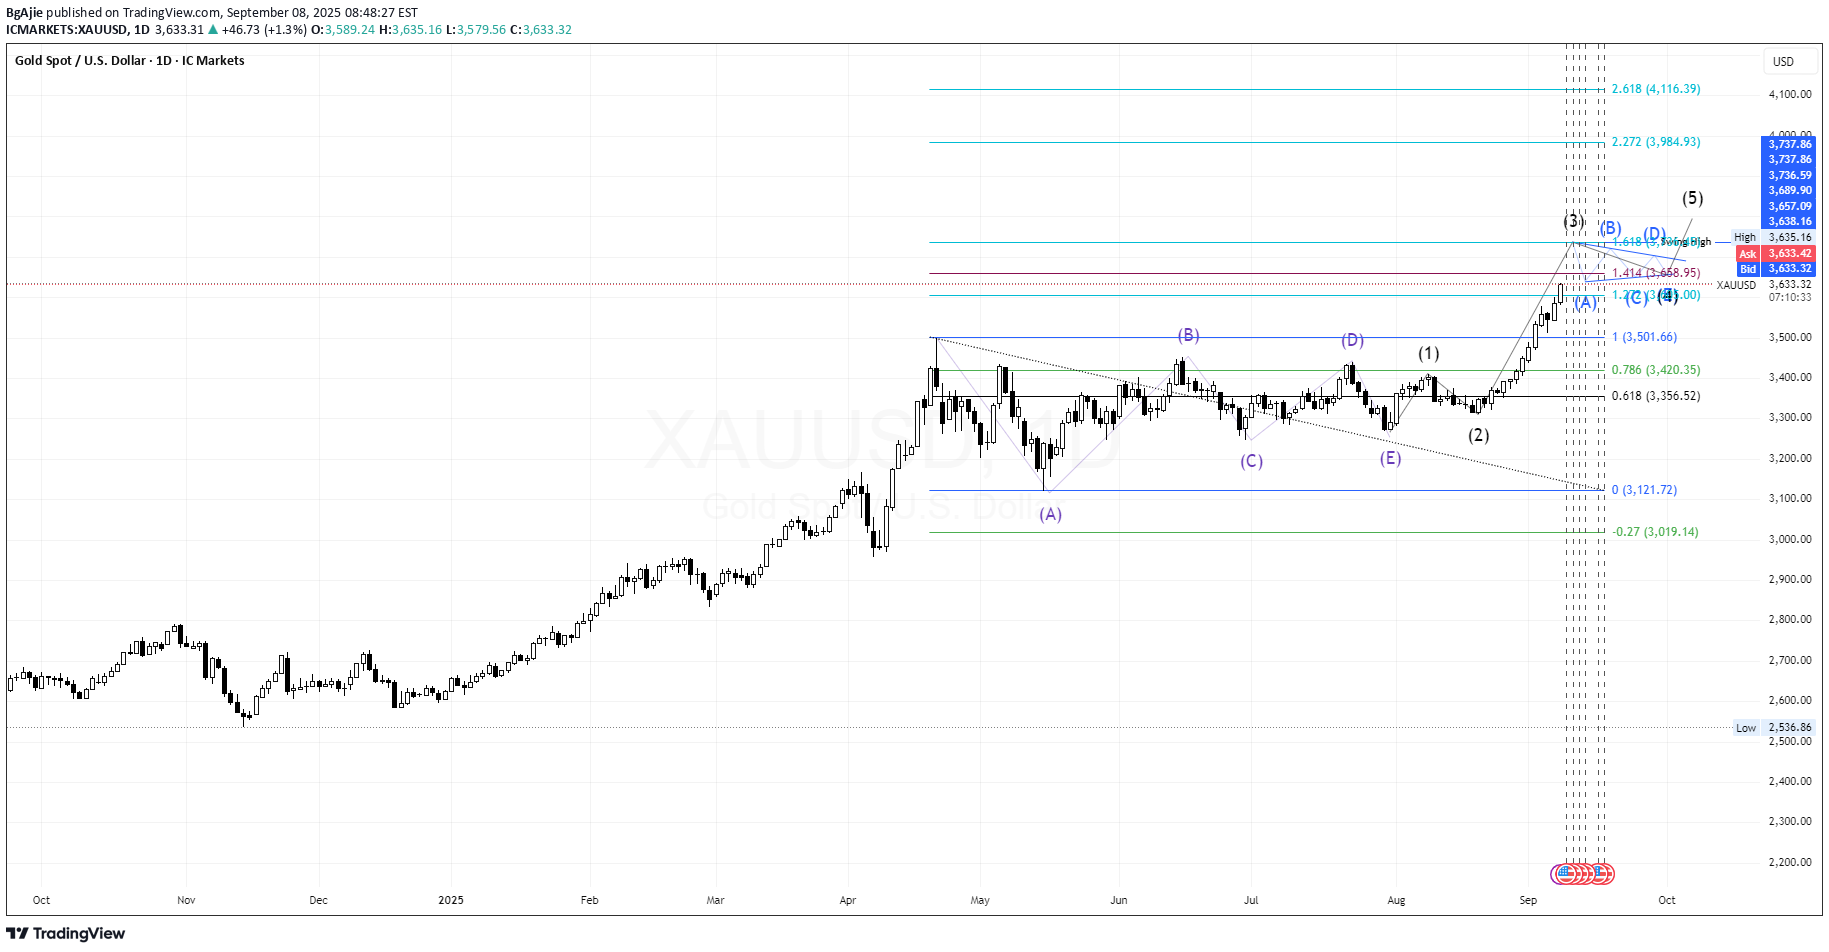
Elliott Wave Structure The market is currently forming an impulsive pattern labeled (1)–(5). Wave (3) has already completed around 3634–3637. Price is now likely entering a Wave (4) correction before heading into the final Wave (5) upward move. Wave (4) Correction Zones: First support: 3501–3520 Next support: 3420–3435 (Fibonacci 0.786 & strong support zone) Deeper correction: 3120–3020 (extreme scenario). Wave (5) Potential: Initial target: 3775–3780 Extended targets: 3985 (Fibo 2.272) and 4116 (Fibo 2.618) Conclusion: As long as price holds above 3420, the bullish trend remains intact. The best strategy is Buy on Dip at support areas, aiming for 3775–3780, with extended potential toward 3985–4116.
BgAjie
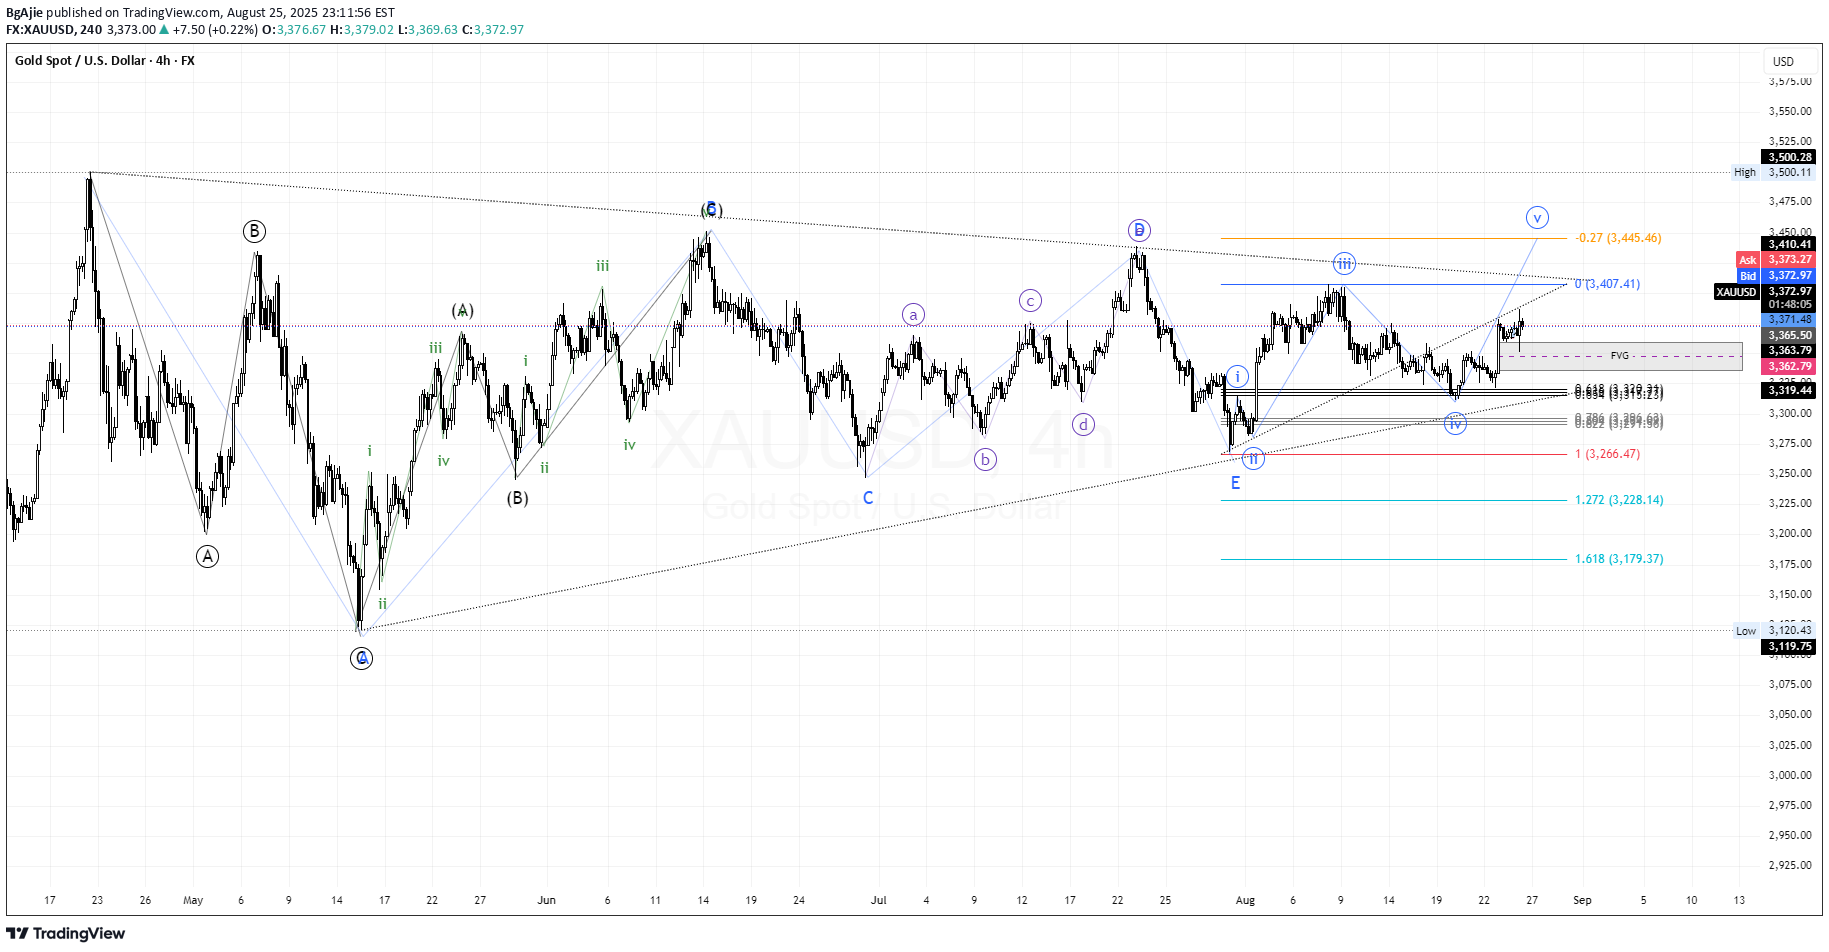
Elliott Wave Structure The chart shows a completed corrective structure (A)-(B)-(C)-(D)-(E) in a triangle pattern. From there, price began a bullish impulsive sequence labeled Wave (i), (ii), (iii), (iv), (v). Currently, price is in the Wave (iii) peak zone around 3600 and is expected to retrace into Wave (iv) before continuing towards Wave (v). Key Fibonacci Levels Retracement zones for Wave (iv) are marked: 0.236 = 3547 – 3554 0.382 = 3511 – 3519 0.5 = 3488 – 3495 0.618 = 3464 – 3473 These zones act as support areas for a potential bullish continuation. Projection / Target The Fibonacci extension -0.27 at 3679 becomes a possible Wave (v) target. If support holds at one of the retracement levels, price may push higher towards this target zone. Market Sentiment Short-term: Expect a pullback (correction) into the 3545–3470 zone. Medium-term: Potential bullish continuation towards 3670–3680 if structure remains valid. Risk: If price breaks below 3440–3460, bullish momentum weakens, and deeper correction could form.
BgAjie
1. Elliott Wave Structure From the chart, several patterns have already been mapped: A larger A-B-C pattern on the left side. Then it developed into an ABCDE (triangle) structure. After that, it started forming an impulsive wave (i–v). Currently, price action appears to be in Wave V of the upward impulse. 2. Key Levels (Fibonacci & Targets) Wave V Targets: Fibo -0.27 around 3445–3450 as the main resistance. Fibo 1.0 extension (Wave III → IV) also points to the 3407–3410 zone. Nearest Support: 3363–3368 (FVG + minor support). If this level breaks, price may head toward 3266 (100% retrace from the previous structure). Major Supports: 3228 (1.272) and 3179 (1.618). 3. Scenarios 📈 Bullish Case (primary) As long as price holds above 3360–3365, there is a strong chance to extend higher toward 3407 and potentially 3445–3450. This would likely complete Wave V before a possible deeper correction. 📉 Bearish Case (alternative) If 3360 breaks and a strong candle closes below it → price could drop to 3266, then to 3228, and even 3180. This would suggest Wave V has failed (truncated) and a larger correction has begun. 4. Trading Plan Buy-on-dip area: 3365–3370 (with SL below 3355). Main targets: 3407 → 3445. If support breaks (close below 3360), cut loss → wait to buy in the 3266–3228 zone.
BgAjie
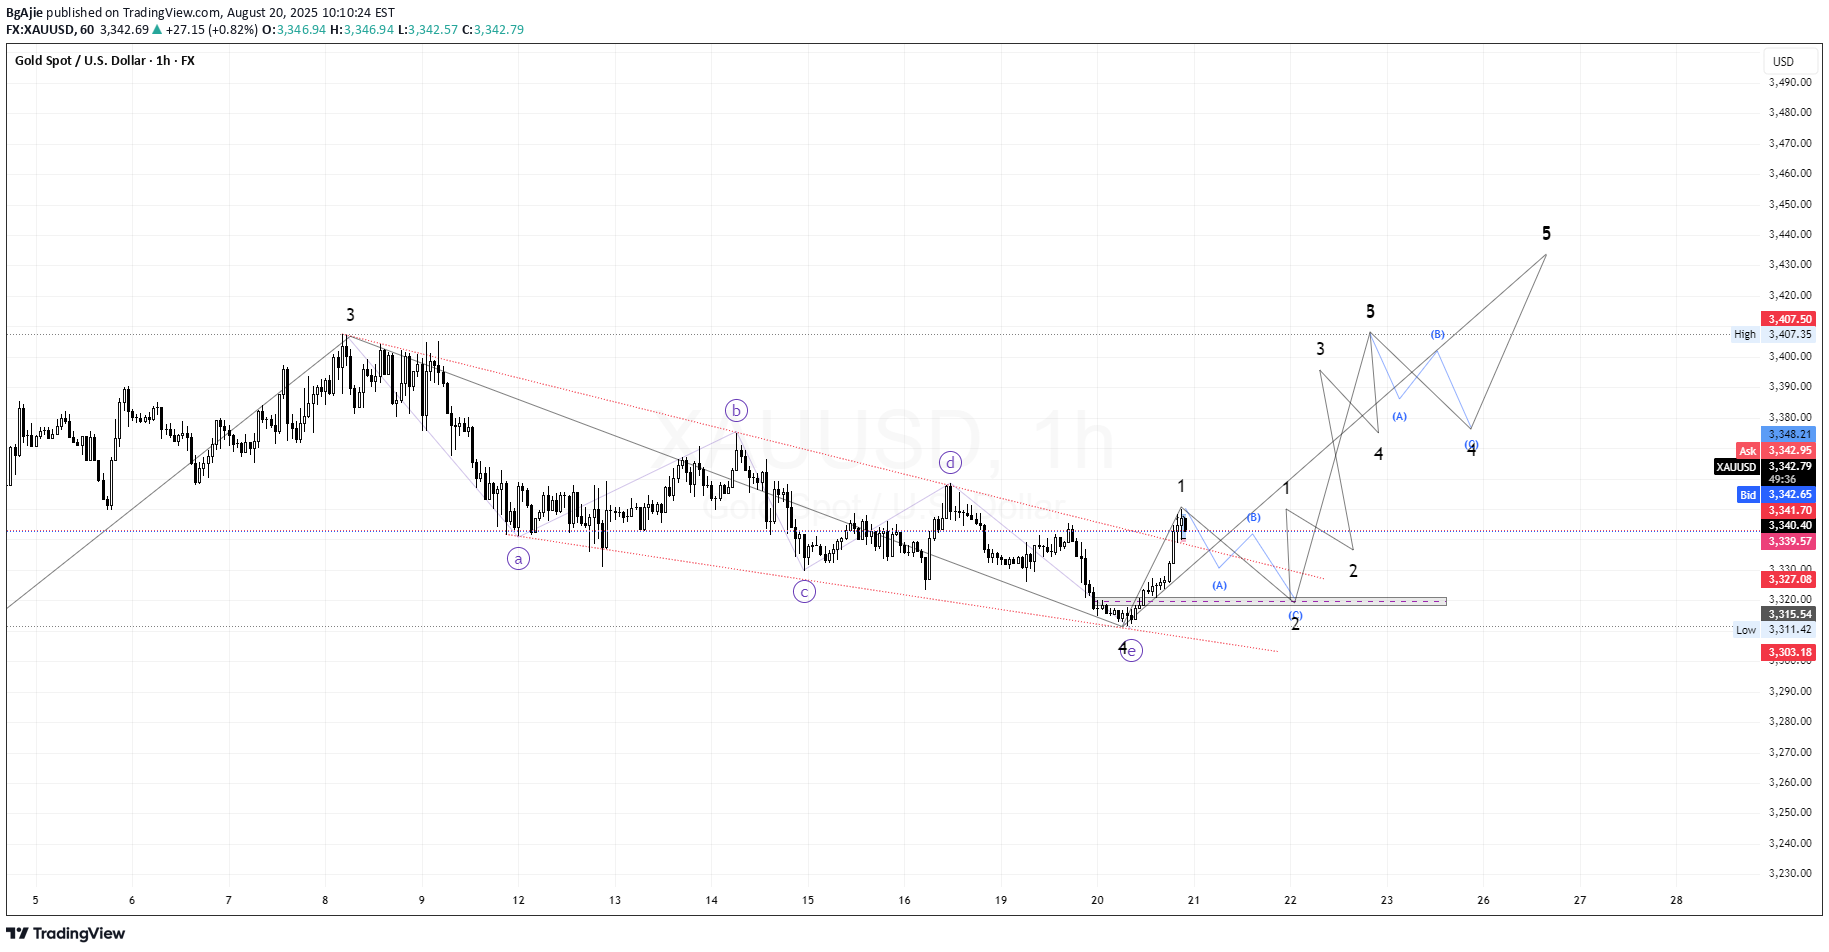
1. Visible Pattern The chart shows a completed complex corrective pattern (ABCDE) inside a descending channel. After the E wave finished, price started moving up, forming an initial impulse (wave 1). Currently, the market is projected to build a 5-wave impulsive structure (Elliott Impulse): Wave 1 is completed. Wave 2 (pullback/retrace) is in progress. Next target is a strong Wave 3, followed by Wave 4 correction, then Wave 5 final impulse up. 2. Key Levels Key support (wave 2 area): around 3327 – 3315 (must hold for the bullish scenario to remain valid). Nearby resistances: 3340 → minor resistance. 3380 → target for wave 3 start. 3407 → previous high & strong bullish confirmation. Wave 5 target: could reach 3430 – 3450 if the full impulse develops. 3. Scenarios 📌 Bullish (main scenario) As long as price holds above 3315, strong potential to continue upward. After wave 2 completes, wave 3 is usually extended and aggressive → best buy opportunities after retrace ends. 📌 Bearish (alternative / invalidation) If price breaks below 3315 – 3303 (previous low), the bullish impulsive scenario becomes invalid → price could continue deeper down. 4. Strategy Buy the dip around support zone (3327 – 3315). Short-term targets: 3380 – 3407. Mid-term target (wave 5): 3430 – 3450. Stop loss: below 3303. 👉 Conclusion: XAUUSD has just completed wave 1 and is now heading into wave 2 (pullback). As long as support holds, the bullish scenario towards wave 3–5 remains valid with targets at 3380–3450.
BgAjie
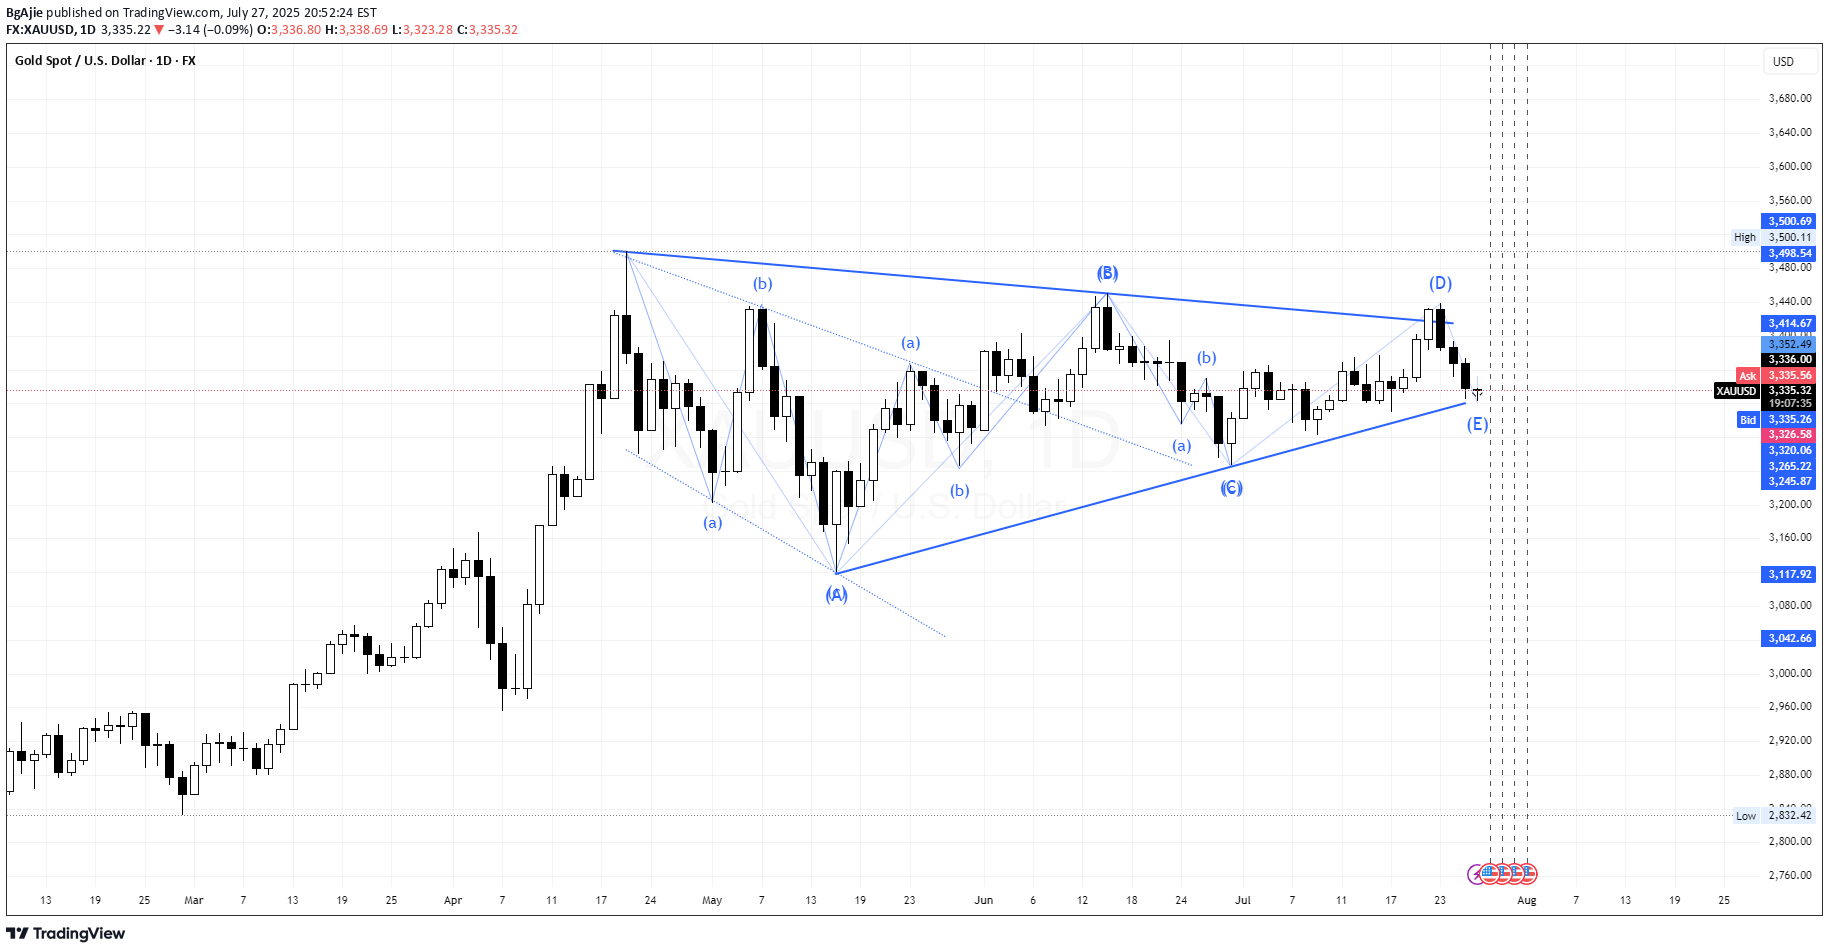
📊 Technical Analysis – XAUUSD (July 28, 2025) Elliott Wave Structure – Triangle (ABCDE): The chart clearly shows a contracting triangle pattern (ABCDE), which commonly appears during corrective waves (usually Wave 4 or Wave B in a larger degree). Currently, price seems to have just completed Wave E, and it's showing early signs of a bounce from the triangle's lower support. If this wave count is valid, we could expect a bullish breakout soon, continuing the previous trend (most likely upward if this is part of Wave (5)). 🧭 Key Support and Resistance Levels: Triangle Support (Wave E area): Around $3,325 – $3,336 (price is currently testing this zone) Potential Bullish Targets (if breakout occurs): 🎯 $3,374 🎯 $3,414 🎯 $3,498 – $3,500 (major resistance zone / Wave 5 target) 🧠 Fundamental Outlook Supporting Gold (Forward-Looking) ✅ Bullish Drivers: Fed Rate Cut Expectations (Late 2025): Slowing inflation → Rate cuts expected → Positive for gold. Weaker US Dollar: A weaker dollar makes gold cheaper for international buyers → Bullish. Global Geopolitical Tensions: Rising uncertainty supports gold as a safe haven asset. ⚠️ Bearish Risks: Strong US economic data (e.g., NFP beats or rising inflation) could lead to the Fed staying hawkish → Negative for gold. If price breaks below triangle support ($3,325), the triangle structure would be invalidated and a larger correction could unfold. 📝 Summary & Trading Strategy: DirectionEntry AreaStop LossTP 1TP 2TP 3 ✅ Buy (preferred)$3,330 – $3,336Below $3,310$3,374$3,414$3,498–$3,500 ❌ Sell (if breakdown)Below $3,320Above $3,340$3,265$3,245$3,118
BgAjie
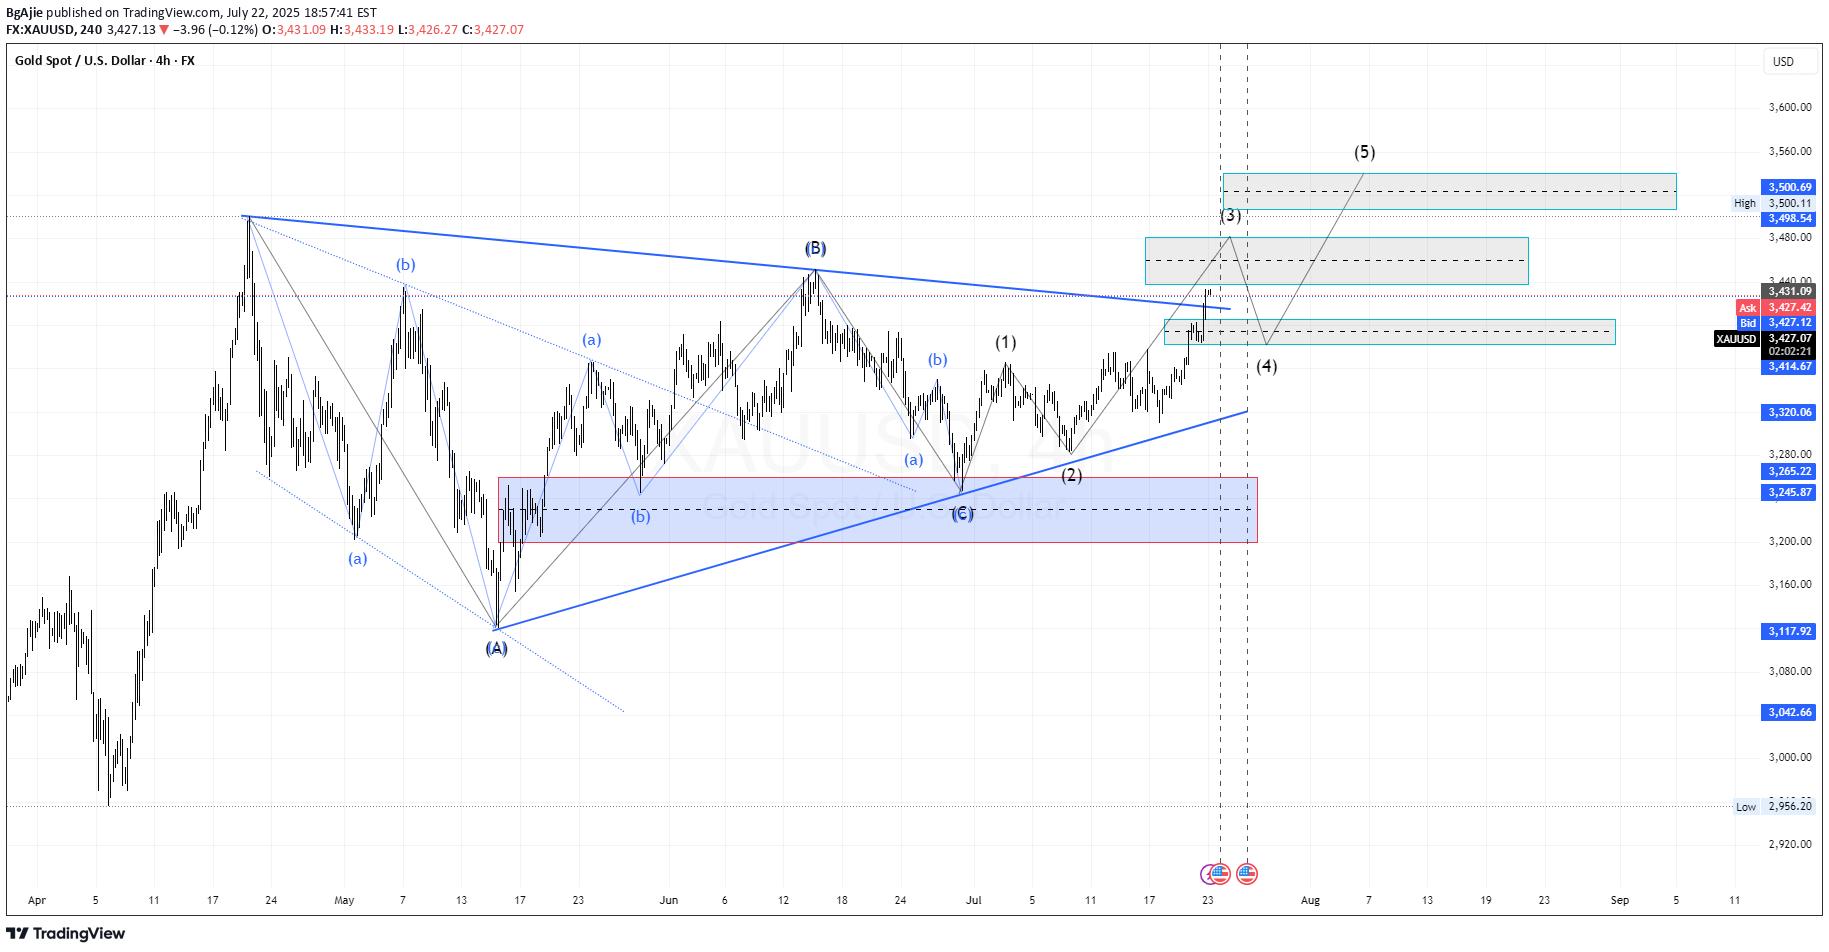
✅ Overall Structure Currently, a large ABCDE triangle structure has completed. After the corrective phase, the price is moving impulsively in wave (1)(2)(3)(4)(5). ✅ Wave Analysis Wave (1) and (2) are complete. The market is currently progressing within wave (3) to the upside. Projected target for wave (3) is around: $3,448 – $3,468 (small target box). After a minor correction in wave (4), the final wave (5) is projected towards $3,500 – $3,550. ✅ Key Zones Major Support: $3,320 – $3,265 (highlighted red-blue box around wave (2) area). Nearest Resistance: $3,448 – $3,468 for wave (3), and next resistance zone at $3,500+. Breakout from the upper trendline of the triangle is confirmed → continuation bullish bias remains valid. ✅ Summary Current Trend: Bullish, progressing towards waves (3) and (5). Potential Buy Zone: On a retracement near $3,400 – $3,380, or on a breakout continuation above $3,448. Potential Take Profit Zone: $3,500 – $3,550. Invalidation of Bullish Setup: Close below $3,320.
Disclaimer
Any content and materials included in Sahmeto's website and official communication channels are a compilation of personal opinions and analyses and are not binding. They do not constitute any recommendation for buying, selling, entering or exiting the stock market and cryptocurrency market. Also, all news and analyses included in the website and channels are merely republished information from official and unofficial domestic and foreign sources, and it is obvious that users of the said content are responsible for following up and ensuring the authenticity and accuracy of the materials. Therefore, while disclaiming responsibility, it is declared that the responsibility for any decision-making, action, and potential profit and loss in the capital market and cryptocurrency market lies with the trader.