
Bar-Pump
@t_Bar-Pump

What symbols does the trader recommend buying?
Purchase History
پیام های تریدر
Filter
Bar-Pump
ORBSUSDT - Expecting a 50-60% Rocket
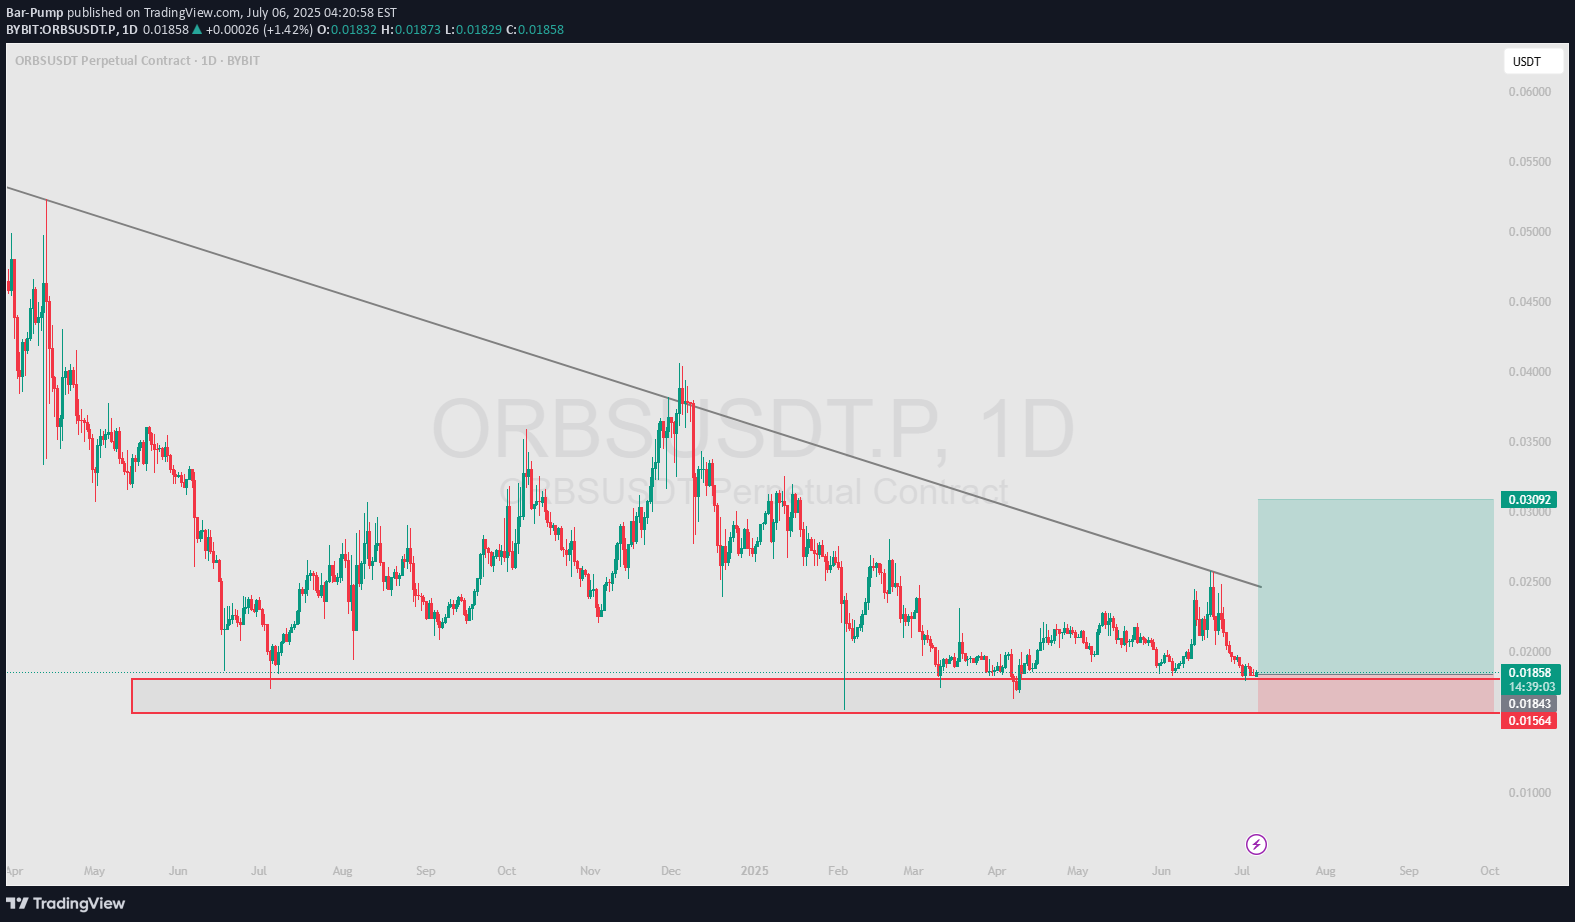
The ORBSUSDT chart shows a descending channel, which indicates a bearish trend. However, the recent consolidation near the horizontal support line creates an opportunity for long trades if the price successfully bounces off the level. A breakout above the upper boundary of the channel will confirm a potential trend reversal and open up significant upside potential.SUBSCRIBE ME. ANDt.me/aidailytrader - Telegram channel Free Trading Signals and buy AI private Indicators.
Bar-Pump
KAVA - We are expecting the rocket at 80%
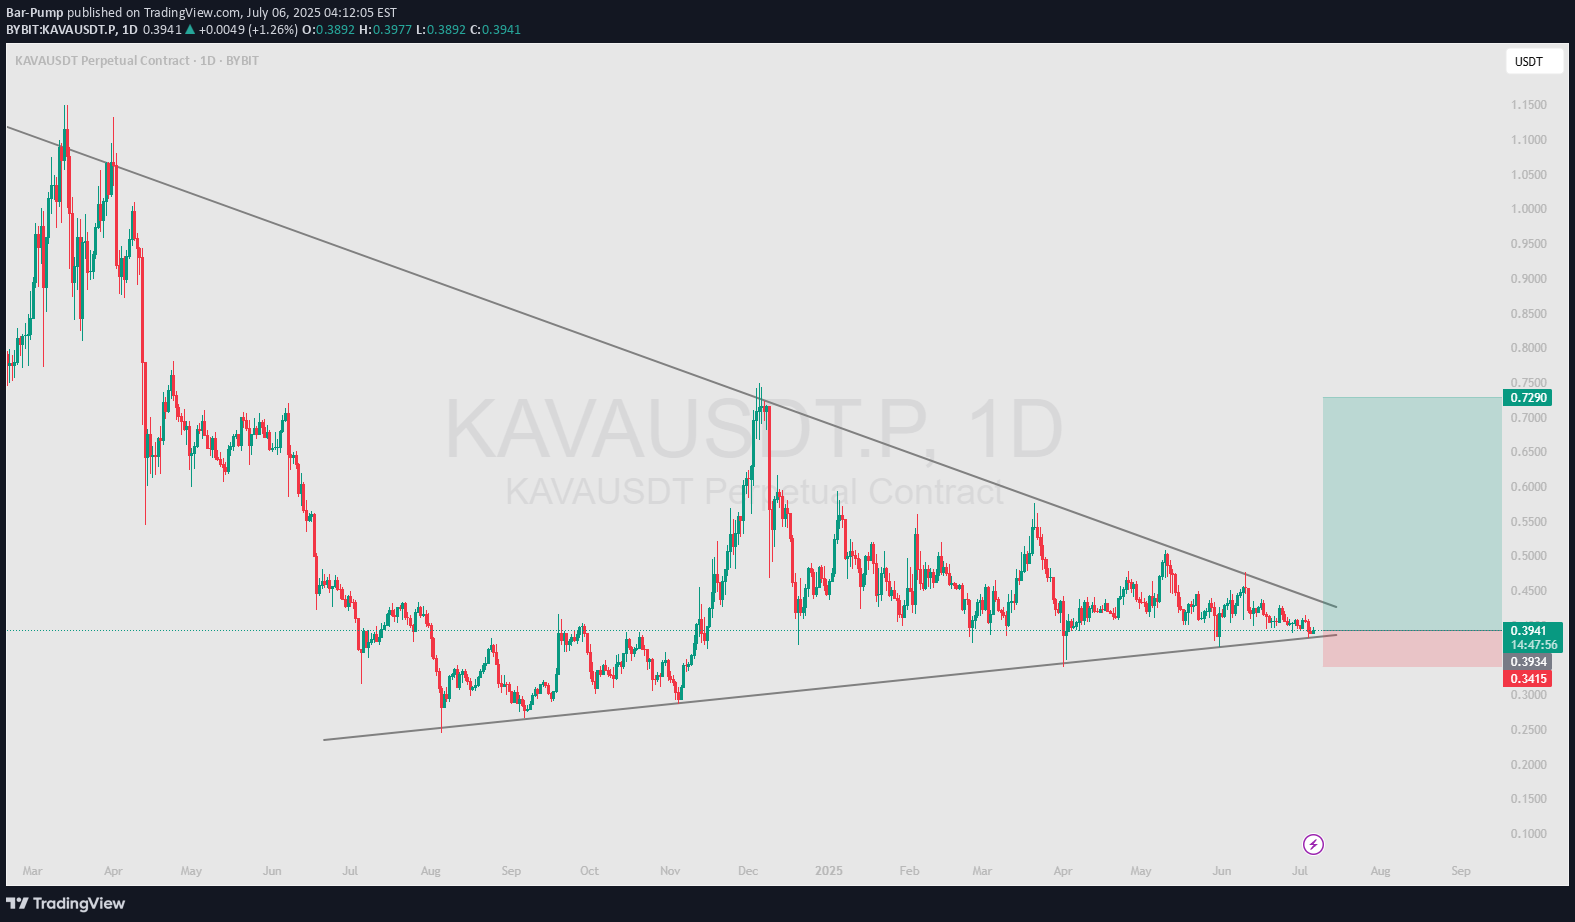
The KAVAUSDT chart shows a clear downward channel, indicating a bearish trend. However, the price is currently consolidating around the middle of the channel, creating uncertainty about the immediate direction.Recommended signal: wait for confirmation of a breakout above the upper boundary for longs or a breakout below the lower boundary for shorts.
Bar-Pump
AXS - We are on support, next rocket 180%
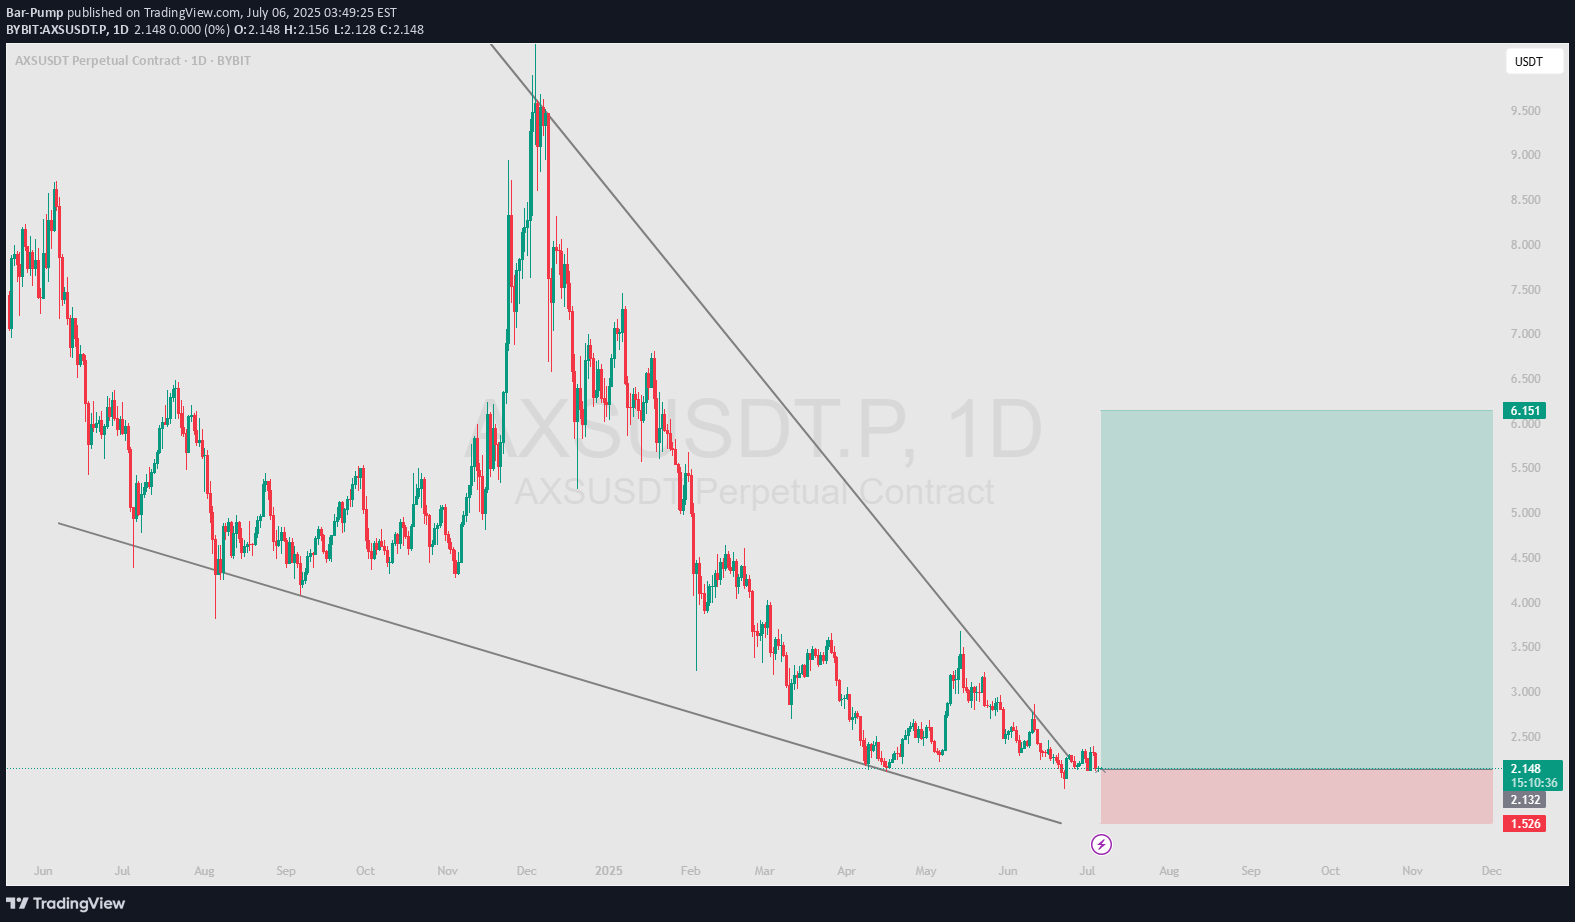
At the moment, the price is in the testing zone of the lower boundary of the descending channel. This is a critical level that will determine the further direction of movement. If the price bounces off the support, we can expect an upward correction. If the price breaks through the support, we should expect a further fall.Recommended signal: Waiting for confirmation of the breakout of the lower boundary of the channel to enter shorts or a rebound from support to enter longs.Price range forecast for the next 3 days: 1.50–2.30 USDT.
Bar-Pump
MANA - move in support and then shoot at 150%
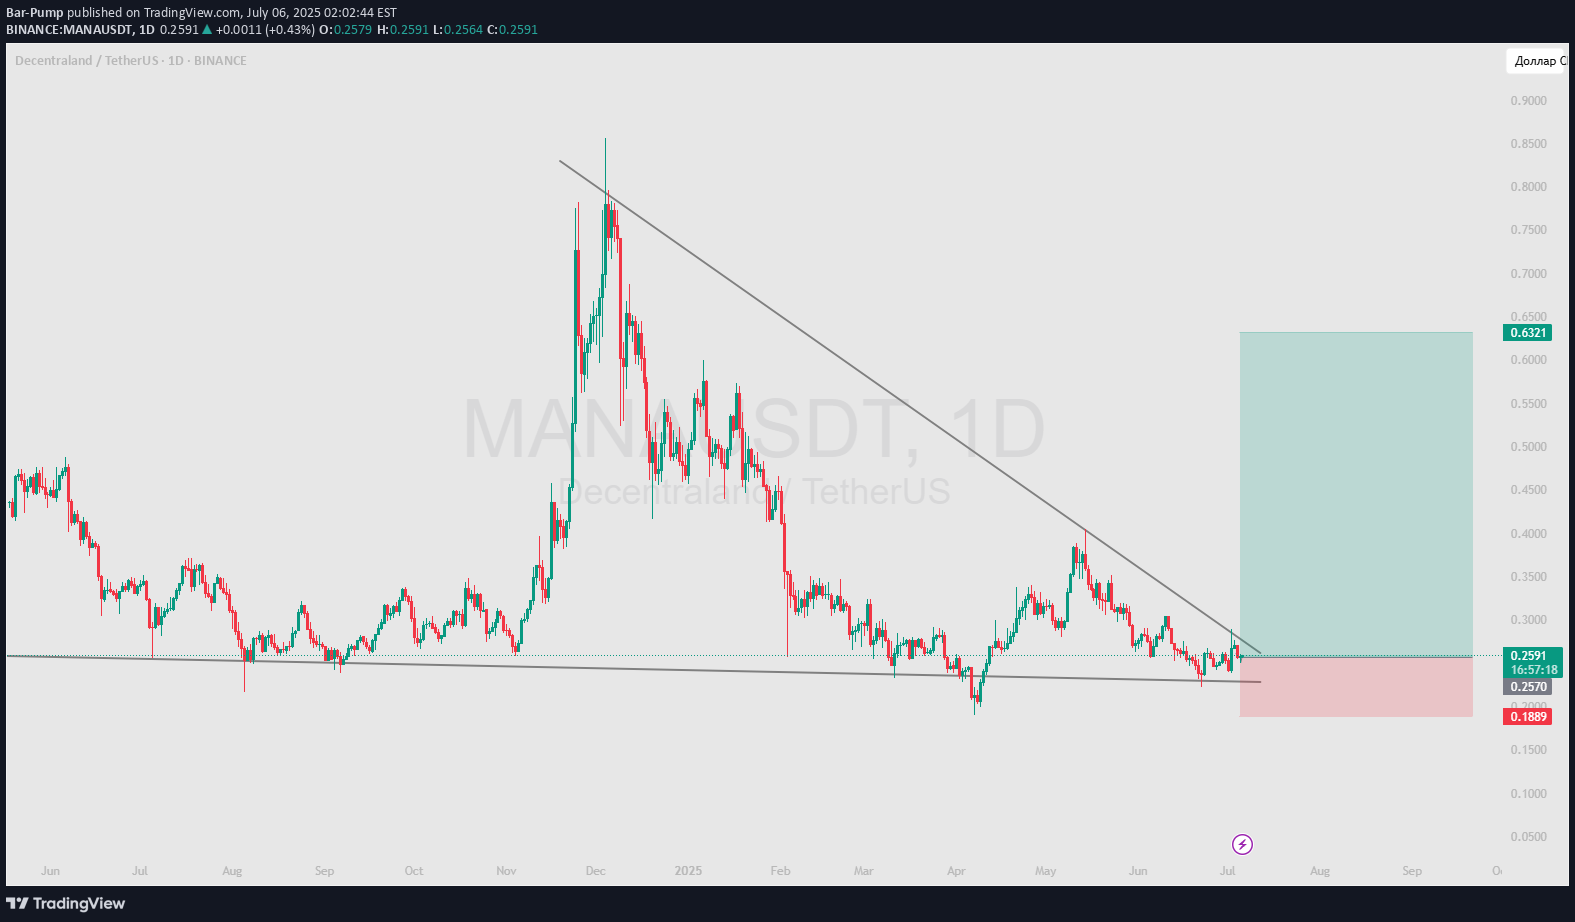
Price Prediction:Short Term (1-3 Days):The price may continue to move within the falling wedge, maintaining a downward trajectory. However, there is a high probability of testing the lower boundary of the wedge ($0.1900 USDT).If the price holds above $0.1900 USDT, this could signal a corrective rally toward the $0.2750 USDT level.Medium Term (1-2 Weeks):If the price successfully tests the lower boundary of the wedge and rebounds upward, this could lead to a reversal of the pattern and the start of an uptrend.The target levels after a wedge breakout would be $0.3863 USDT (previous local high).In case of an unsuccessful test of support ($0.1889 USDT), the price may continue to decline toward deeper support levels (e.g., $0.1500 USDT).Long Term (1 Month+):If there is a successful reversal of the falling wedge pattern, this could mark the beginning of a sustained recovery. Target levels could extend beyond $0.3863 USDT, such as $0.5000 USDT or higher.However, if the downtrend continues without reversal, long-term targets could be significantly below current levels.Trading Recommendations:Long (Buy):Entry: After a successful test of the lower boundary of the wedge ($0.1900 USDT) and a subsequent bounce upward.Take-Profit: $0.2750 USDT → $0.3863 USDT → $0.5000 USDT.Stop-Loss: Below $0.1889 USDT (to protect against further declines).Short (Sell):Entry: If the price fails to break above the upper boundary of the wedge ($0.2750 USDT) and begins to decline.Take-Profit: $0.1900 USDT → $0.1500 USDT.Stop-Loss: Above $0.2750 USDT (to protect against a bullish reversal).Conclusion:At the moment, the asset MANA is in a downtrend, forming a falling wedge. This creates potential for both a corrective rally and a continuation of the decline. The key event will be the test of the lower boundary of the wedge ($0.1900 USDT). A successful test could lead to a reversal of the pattern and the start of an uptrend, while an unsuccessful test could strengthen the downtrend.
Bar-Pump
ENJ - 4H Uptrend, after expected correction

Here is a short analysis based on the chart's elements:Trendline Breakout: The price has decisively broken out of a long-term descending white trendline, which previously acted as resistance. This is a strong bullish signal, suggesting the end of the downtrend.Market Structure Shift: The chart shows multiple "ChoCH" (Change of Character) and "BOS" (Break of Structure) to the upside, indicating a shift from a bearish market structure (Lower Lows and Lower Highs) to a bullish one.Predicted Path: The large yellow arrow drawn on the chart illustrates the forecast. It predicts a potential small dip or consolidation to retest the broken trendline as new support, followed by a significant upward move.Target: The arrow points towards the upper red resistance/supply zones, suggesting a potential target price around the 0.07200 level.
Disclaimer
Any content and materials included in Sahmeto's website and official communication channels are a compilation of personal opinions and analyses and are not binding. They do not constitute any recommendation for buying, selling, entering or exiting the stock market and cryptocurrency market. Also, all news and analyses included in the website and channels are merely republished information from official and unofficial domestic and foreign sources, and it is obvious that users of the said content are responsible for following up and ensuring the authenticity and accuracy of the materials. Therefore, while disclaiming responsibility, it is declared that the responsibility for any decision-making, action, and potential profit and loss in the capital market and cryptocurrency market lies with the trader.