
Asif_Iqbal_chaudhary
@t_Asif_Iqbal_chaudhary

What symbols does the trader recommend buying?
Purchase History
پیام های تریدر
Filter
Asif_Iqbal_chaudhary

Key ObservationsFactor: DetailsTrend-Shift SignalBreakout above the long-standing Descending Channel and the most recent Lower High.AccumulationSideways base fuel for the breakout.Harmonic ConfluenceBack-testing shows this zone aligns with a bullish harmonic reversal area on the 1-hour chart, reinforcing the probability of trend change.Trade PlanEntry : $4.241 (post-breakout retest)Stop-Loss: $3.940 (below accumulation floor)Profits should be booked according to your personal risk appetite and reward targets.🔒 Risk Management Tip:"True discipline in trading means waiting for the right setup and respecting your stop loss."
Asif_Iqbal_chaudhary

📊 Trend: Bullish📈 Entry Plan: I will take entry right after a confirmed breakout of the accumulation box.🎯 Profit Target: You can book profits based on your own risk-reward ratio and trade plan."Amateurs focus on rewards. Professionals focus on risk."Always protect your capital—let the market come to you, not the other way around.TP HIT
Asif_Iqbal_chaudhary

REZ is showing early signs of a trend reversal on the 1-hour chart after forming a Tweezer Bottom pattern near a support zone. This pattern, combined with a bullish RSI divergence and a break of the downtrend line, suggests a possible shift in momentum.🔹 Entry Price: $0.01378🔹 Stop Loss: $0.01310🔹 TP-1: $0.01467🔹 TP-2: $0.01559✅ RSI is showing bullish divergence, indicating weakening selling pressure.📌 Traders can watch for volume confirmation and manage risk accordingly. As always, take-profit levels can be adjusted depending on your individual risk-reward ratio or trade management plan.
Asif_Iqbal_chaudhary
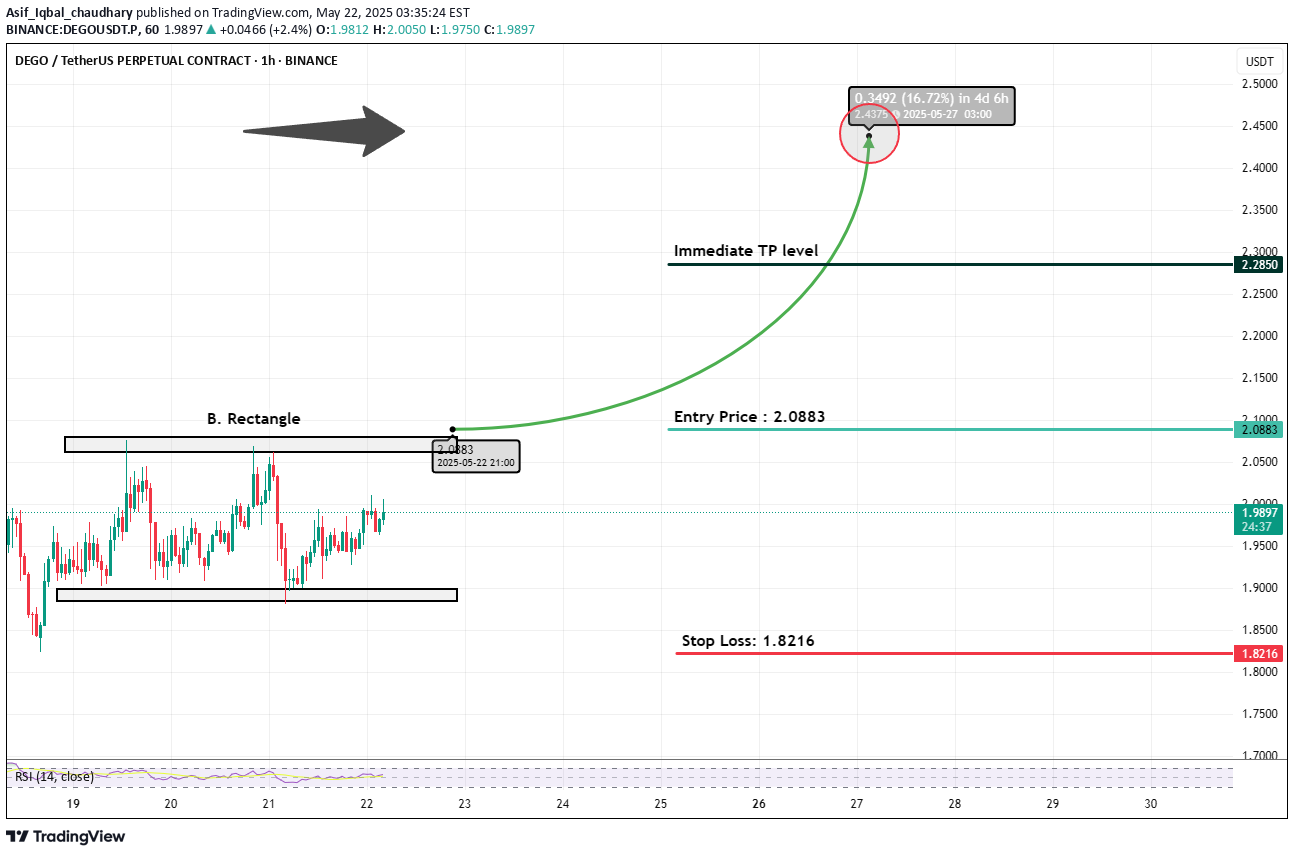
DEGO is currently exhibiting a bullish rectangle formation on the 1-hour chart, a pattern often indicative of continuation in an existing uptrend. The price has been consolidating between clearly defined horizontal support and resistance levels, and it's now approaching a breakout zone.🔹 Entry Price: $2.0883 (on breakout confirmation)🔹 Stop Loss: $1.8216 (below support range)🔹 Immediate TP Level: $2.2850🔹 Potential Upside: +16.75%✅ No bearish divergence or reversal signs are currently visible.A breakout above the rectangle resistance could trigger a strong upward move. As always, traders should wait for confirmation with volume and can adjust take-profit levels based on their individual risk-reward preferences.This setup remains bullish unless price rejects the breakout zone and closes below the support range.TP Hit
Asif_Iqbal_chaudhary

BBUSDT is currently presenting a strong bullish technical structure backed by multiple confirmations:🔹 A double bottom has formed, signaling potential trend reversal.🔹 Bullish divergence on the RSI strengthens the bullish outlook, showing hidden buying pressure.🔹 Price action is compressing within a symmetrical wedge, and no bearish reversal patterns are currently observed.A breakout above the wedge resistance trendline could lead to further upside continuation.📌 Entry: $0.18554 (upon confirmed breakout)🛡️ Stop Loss: $0.16322 (below structure support)🎯 Target: $0.21591 (+15.13%) — You may also set your take-profit levels based on your own risk-reward ratio and trading style.As long as the structure holds and no bearish confirmation appears, the setup remains valid. Always manage risk accordingly.
Asif_Iqbal_chaudhary

FLM has completed a bullish harmonic pattern and formed a strong base around $0.0300–$0.0324, showing signs of accumulation. A breakout above the range suggests a potential bullish move.📌 Entry: $0.0324🎯 Target (TP-1): $0.0371🎯 Final Target: $0.0414🛡️ Stop Loss: $0.0279RSI shows bullish divergence, supporting the upward momentum. Breakout confirmation above resistance may trigger a 25–28% upside. Trade with proper risk management.TP-1 hit
Asif_Iqbal_chaudhary

FLM has recently completed a Bullish Butterfly Harmonic Pattern on the 1-hour chart, signaling a potential reversal from the D point. "✅ Trade Idea:Entry Zone: 0.0324 – 0.0330Stop Loss: Below 0.0300 (structure invalidation)Take Profit 1 (TP-1): 0.0371Take Profit 2 (TP-2): 0.0416⚠️ Risk Management:Always apply proper risk management. Harmonic patterns are powerful tools, but no setup is guaranteed. Use calculated lot sizes and respect your stop-loss to protect capital.💬 Please share your thoughts in the comments and hit the like button if you agree with this setup!TP-1 hit
Asif_Iqbal_chaudhary

Market Overview:The MKR/USDT pair is forming a Rising Wedge, a bearish reversal pattern. This suggests a potential downside move after a strong uptrend if the price breaks below the support level.Key Technical Observations:🔹 Rising Wedge Formation: The pattern consists of higher highs (HH) and higher lows (HL), signaling weakening bullish momentum.🔹 RSI Bearish Divergence: The RSI indicates weakening buying pressure, increasing the likelihood of a correction.Trade Setup:📌 Sell Stop Entry: Below 1,157.1 (Wedge breakdown)📌 Stop Loss: 1,273.9 (Above resistance)📌 Take Profit 1: 1,100.6📌 Take Profit 2: 1,026.6Trading Plan:✅ If the price breaks below 1,157.1, a short position is valid.✅ Stop loss is placed above resistance to limit upside risk.✅ Secure partial profits at TP-1 (1,100.6) and trail SL for TP-2 (1,026.6).💡 Conclusion:A confirmed Rising Wedge breakdown signals a potential bearish move. Traders should wait for a clear break below 1,157.1 before entering short positions.📉 Trade smart & manage risk! 🚨💬 What’s your view on MKR? Drop your thoughts in the comments! 🔥👇
Asif_Iqbal_chaudhary

ACH/USDT) is currently showing signs of a potential bearish reversal after forming a double top near the resistance zone. Additionally, the RSI divergence suggests weakening bullish momentum, increasing the probability of a downward move.Trade Setup:📌 Entry Price: 0.03367 (Below neckline support)📌 Stop Loss: 0.03753 (Above resistance to avoid stop hunts)📌 Take Profit 1: 0.02981📌 Take Profit 2: 0.02589Technical Outlook:🔹 Double Top Formation: A clear bearish pattern, signaling a potential trend reversal.🔹 RSI Divergence: Momentum is weakening, suggesting a shift from buyers to sellers.🔹 Breakdown Potential: If the price breaks below the neckline, further downside movement is expected.📊 Strategy:Traders should watch for a confirmed breakdown below the neckline before entering short positions. If rejection occurs and the price moves back above resistance, reconsideration may be needed.💡 Trade Wisely & Manage Risk Effectively! 🚀
Disclaimer
Any content and materials included in Sahmeto's website and official communication channels are a compilation of personal opinions and analyses and are not binding. They do not constitute any recommendation for buying, selling, entering or exiting the stock market and cryptocurrency market. Also, all news and analyses included in the website and channels are merely republished information from official and unofficial domestic and foreign sources, and it is obvious that users of the said content are responsible for following up and ensuring the authenticity and accuracy of the materials. Therefore, while disclaiming responsibility, it is declared that the responsibility for any decision-making, action, and potential profit and loss in the capital market and cryptocurrency market lies with the trader.