
ArminMah
@t_ArminMah

What symbols does the trader recommend buying?
Purchase History
پیام های تریدر
Filter
Signal Type
ArminMah
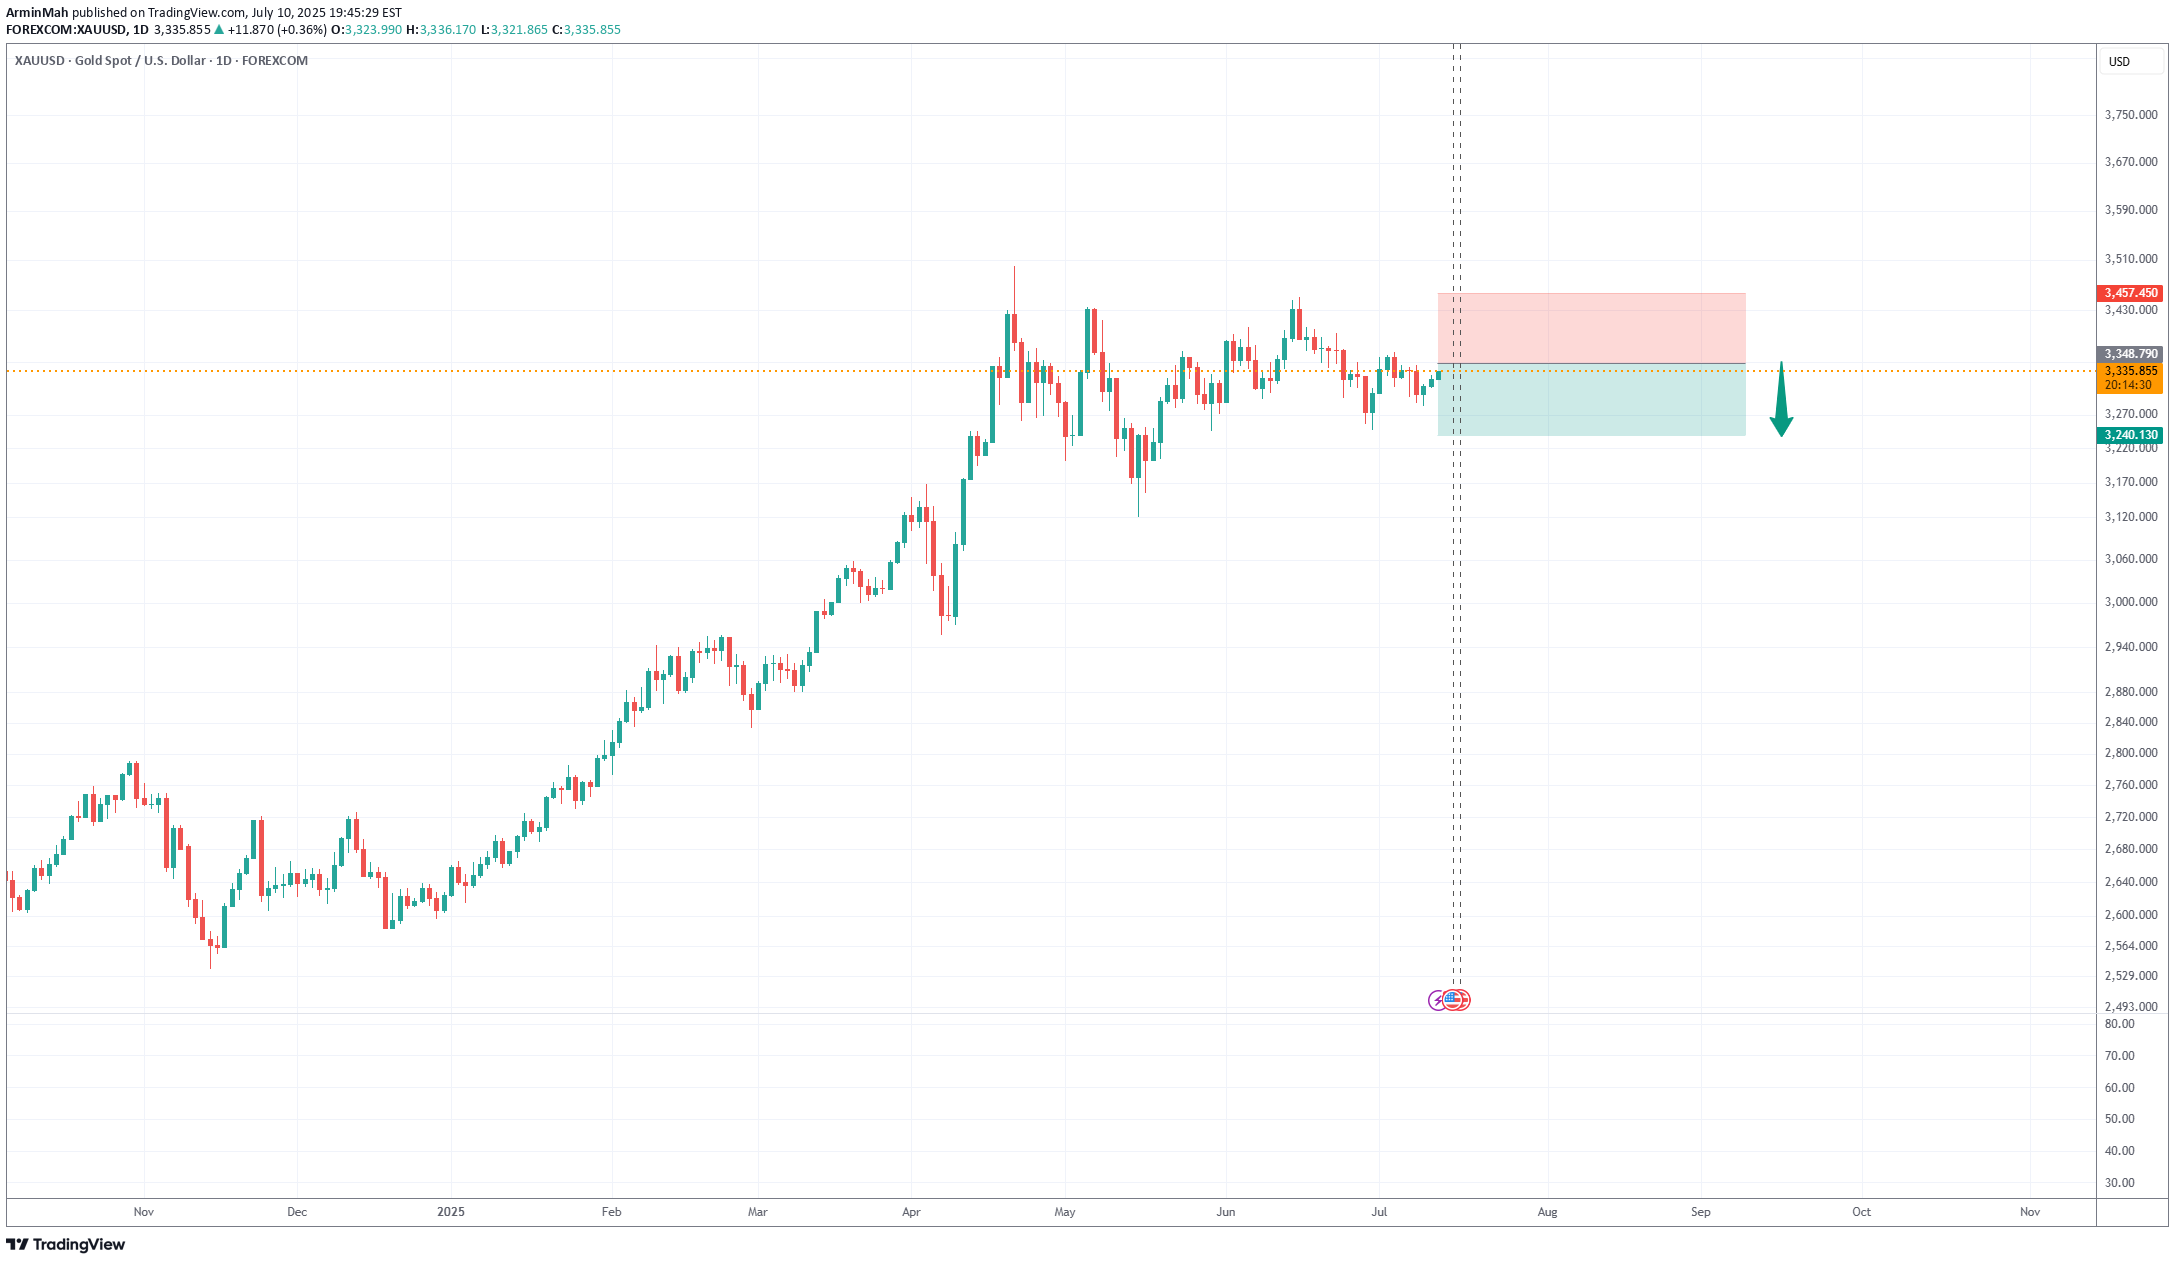
Gold is currently showing signs of weakness after failing to break above $3,360 resistance. Momentum indicators such as RSI and MACD are turning bearish, and price is now trending below key moving averages and near-term Ichimoku resistance on the H1 and H4 charts. Recent price action shows lower highs forming, indicating sellers are gaining control. A break below $3,300 would confirm the start of a deeper correction. 🔽 Trade Plan – SELL GOLD (XAU/USD) This setup targets a breakdown toward the $3,240 support zone, with a stop above recent highs. The trade is based on short-term bearish momentum and weakening buyer strength. ⛔ If GOLD stays below $3,340, selling pressure will likely build, favoring short positions with controlled risk.
ArminMah
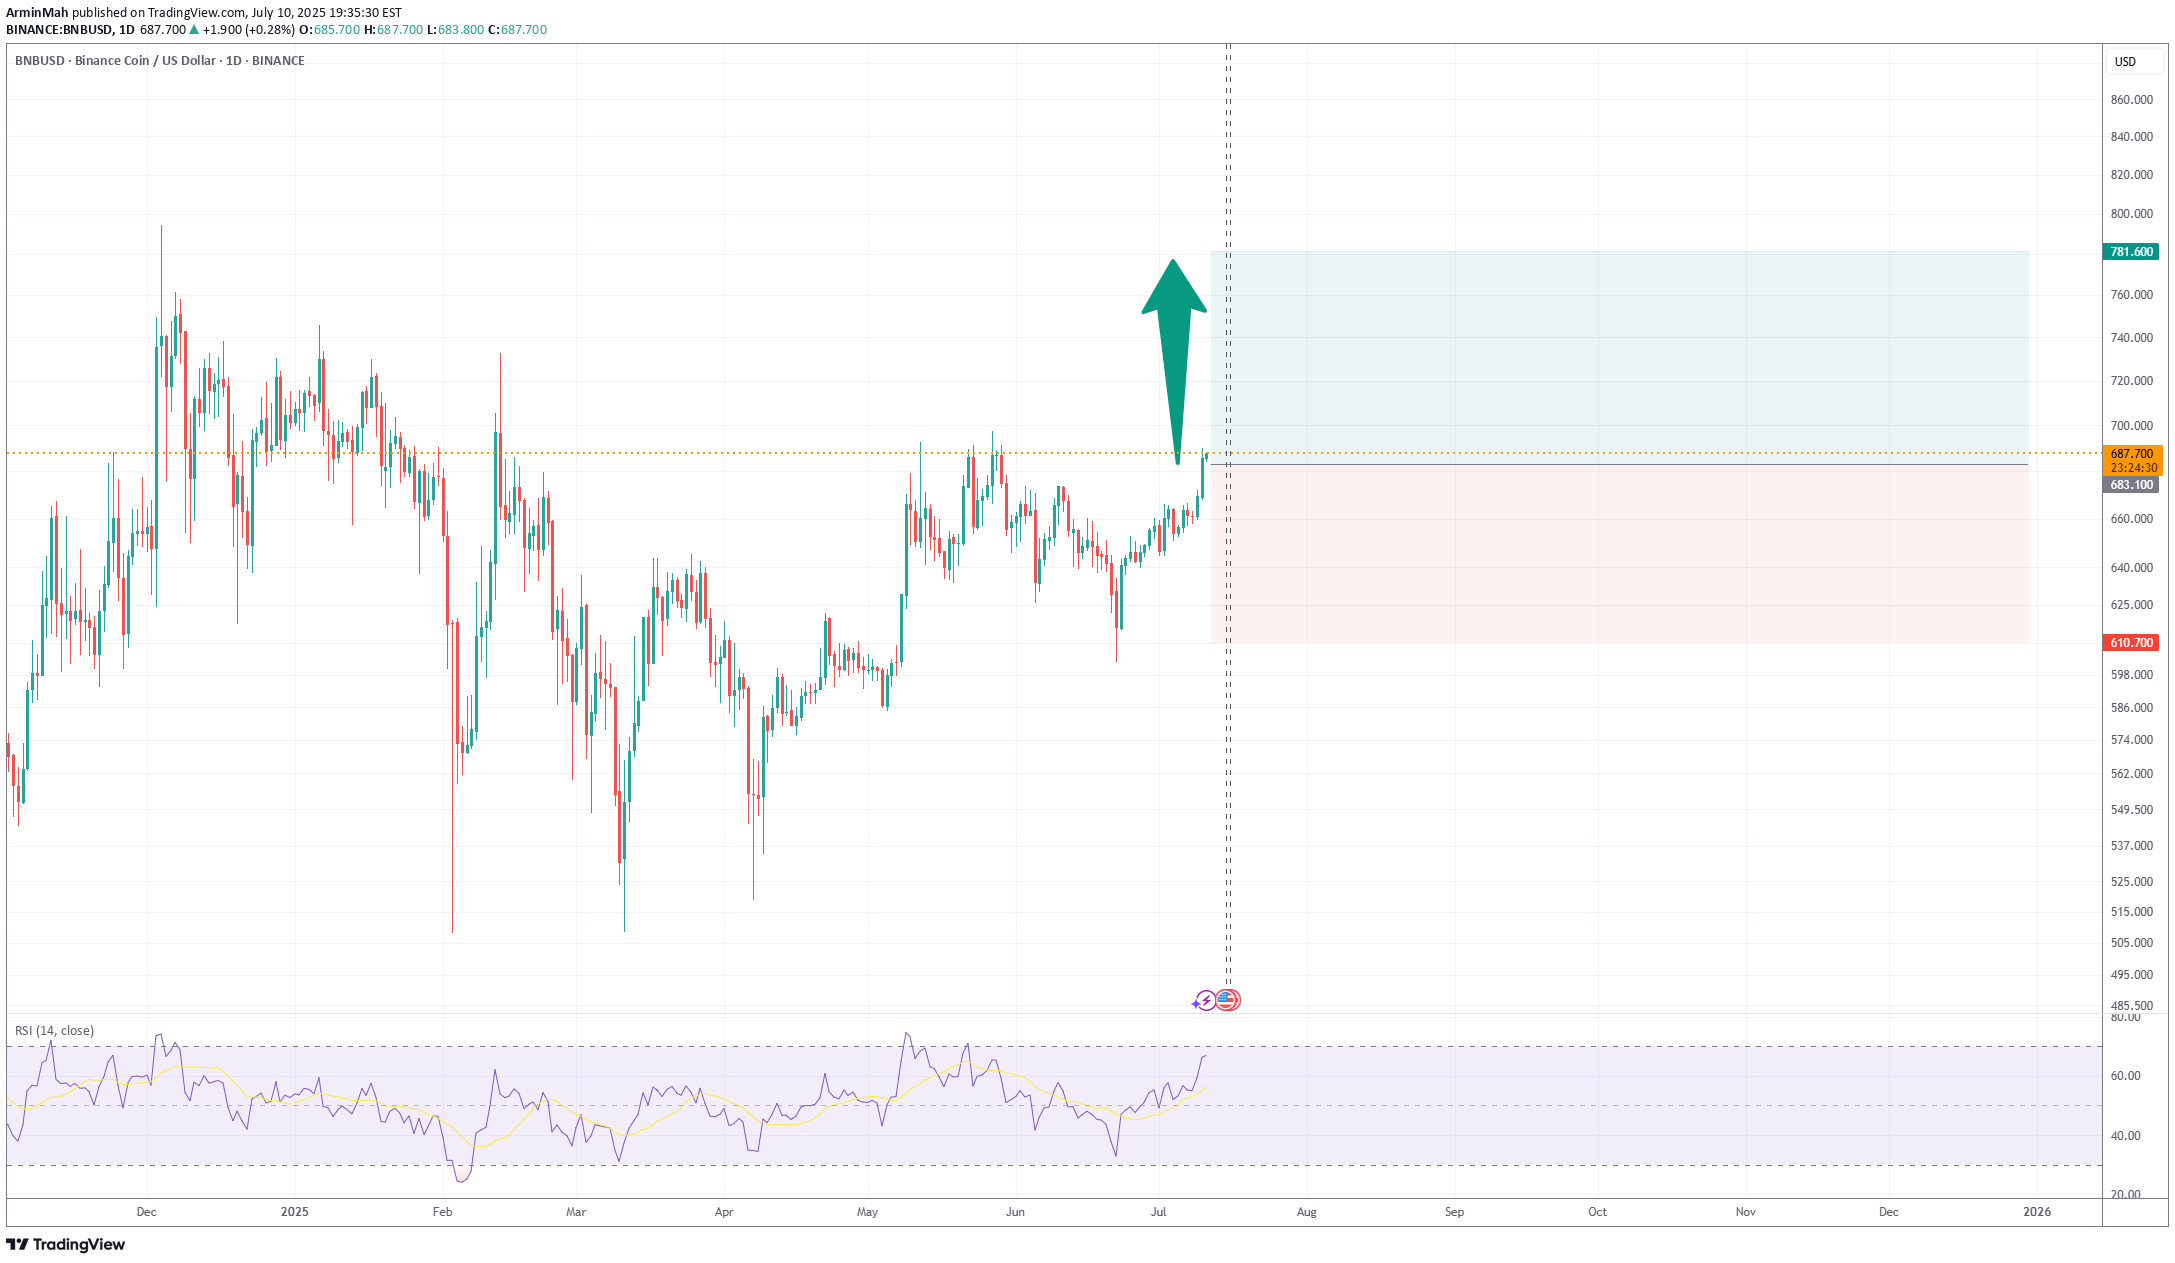
1. Recent Price Action & History BNB is consolidating around $660–$690, recently hitting a 52‑week high near $793 in May, with a 24‑hour range between $668–$687 Nasdaq +14 TradingView +14 CoinDCX +14 . Over the past month, it’s gained ~2–3%, with an uptick of ~4% in late June CoinLore +3 TradingView +3 changelly.com +3 . 2. Technical Setups Supporting Uptrend Descending wedge breakout on 4‑hour chart, with targets around $697–710, then resistance at $728 TradingView +2 CoinDCX +2 tradinglounge.com +2 . Bullish flag & inverse H&S patterns suggest continuation toward $750–800+ . Elliott Wave count shows corrective Wave ② ending near $633, projecting a Wave ③ rise; invalidation if drops below $597 TradingView +2 tradinglounge.com +2 TradingView +2 . Support zones holding firm at $648–637 and $608–592 . 3. Key Indicators Price is above short‑ & mid‑term EMAs, waiting for hold above the 100/200‑day EMA confluence (~$612) tradinglounge.com +3 Iconomi +3 CoinDCX +3 . The Stochastic RSI is overbought, risks a short consolidation before next leg . 🎯 Trade Analysis & Recommendation You mentioned TP = 781, SL = 610. Here's an aligned plan: AspectDetails EntryAfter retracement into $648–660 or break above $690 Stop Loss (SL)Place around $610–$597 (key support/invalidation zone) Take Profit (TP)Primary: $750–781 zone; beyond that, targets near $800–$830 plausible Risk ManagementRisk ~5%, expect consolidation before breakout 🧭 Summary Bullish stance justified — price structure supports uptrend, with clear technical triggers and historical momentum. Watch $648–637 and $610–597 as critical levels for pullback and stop placement. If BNB stays above those, chance of hitting your $781 TP is solid, with upside potential beyond. Bottom Line: Go long on consolidation pullback or breakout above ~$690 SL: ~$610 (or conservative $597) TP: initial $781, trailing into $800+ if momentum continues Tailor position size for acceptable risk and monitor EMA/RSI for signs of exhaustion.
ArminMah
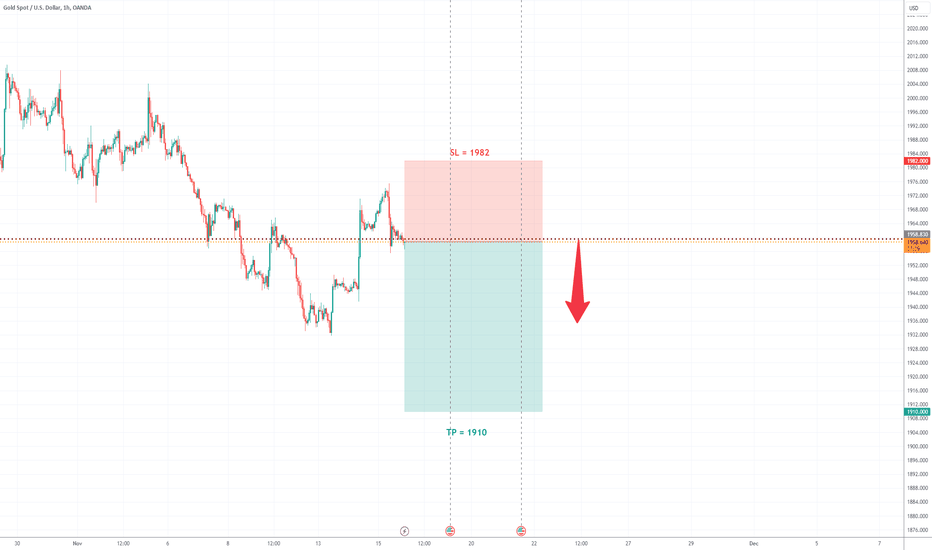
Based on the previous days' candlestick patterns and the current market conditions of XAUUSD (Gold/US Dollar), there are indications that the price might decline further. The decision to place a trade with a take profit (tp) set at 1910 and a stop loss (sl) at 1982 is a personal choice and should be made with careful consideration of risk management. To delve deeper into the rationale behind this potential trade, it's essential to analyze the historical price action, trend lines, support and resistance levels, moving averages, and other technical indicators. Previous days' candlestick formations, such as doji, engulfing patterns, or specific price rejections at crucial levels, could provide insights into potential market sentiment and direction. Additionally, macroeconomic factors and geopolitical events may significantly impact the XAUUSD pair. Factors such as inflation rates, central bank policies, global economic stability, geopolitical tensions, and the US Dollar's performance could influence the price of gold. Moreover, traders often use various technical analysis tools like Relative Strength Index (RSI), Moving Average Convergence Divergence (MACD), or Fibonacci retracement levels to complement their decision-making process. However, it's crucial to emphasize that trading carries inherent risks, and any decision to enter a trade should be based on a well-defined strategy and risk management plan. Utilizing proper position sizing, setting stop-loss orders to mitigate potential losses, and having a clear exit strategy are crucial elements of responsible trading. Remember, this analysis and trade idea are subjective and speculative. Market conditions can change rapidly due to unforeseen events or shifts in sentiment, potentially invalidating the initial analysis. Therefore, constant monitoring of the trade and adapting to new information is essential to manage risks effectively. Lastly, it's recommended to consult with a financial advisor or perform thorough research before making any trading decisions, as this analysis is for informational purposes only and should not be considered as financial advice.
ArminMah
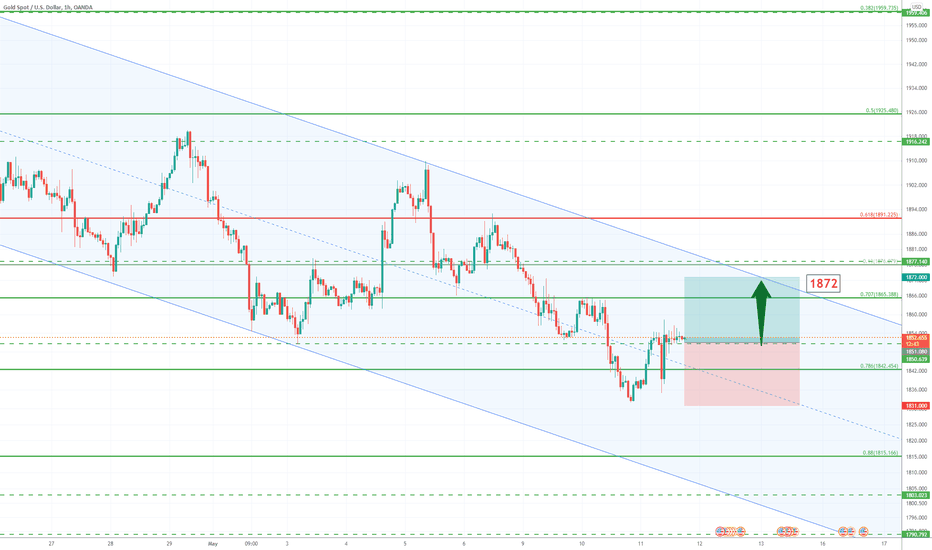
It's just an idea .....!! IT'S GOING UP IN THE FOLLOWING CANDLES
ArminMah
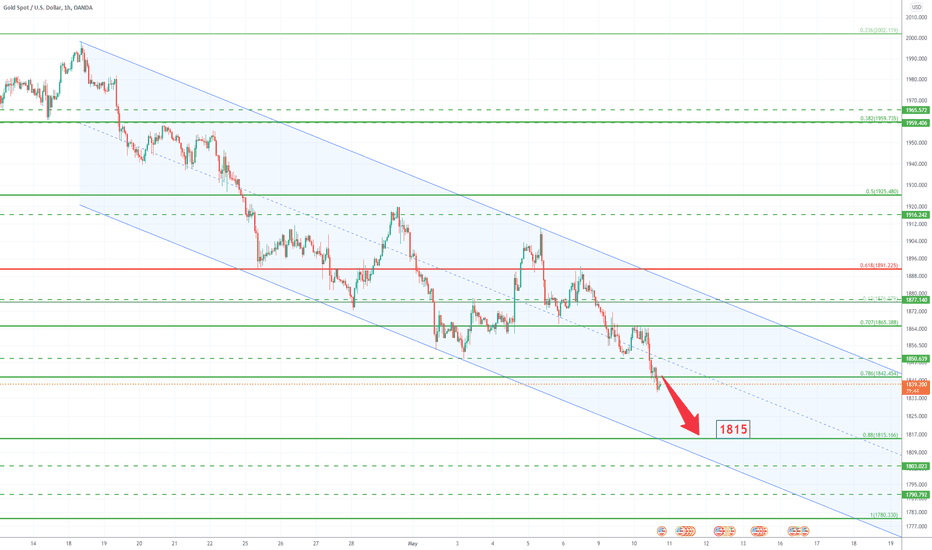
It's just an idea .....!! IT'S GOING DOWN AND PROBABLY REACH AT 1815.
ArminMah
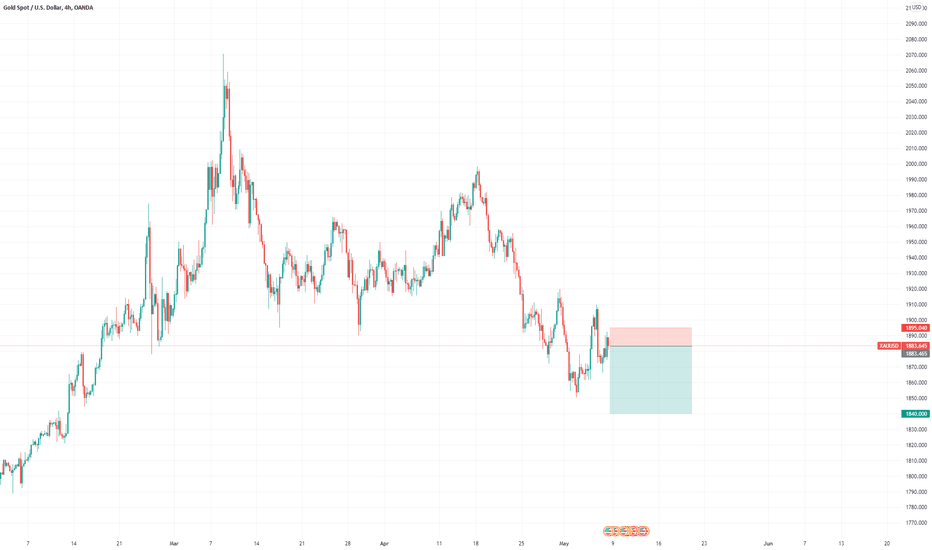
It's just an idea .....!! IT'S GOING DOWN IN THE NEXT FEW DAYS
Disclaimer
Any content and materials included in Sahmeto's website and official communication channels are a compilation of personal opinions and analyses and are not binding. They do not constitute any recommendation for buying, selling, entering or exiting the stock market and cryptocurrency market. Also, all news and analyses included in the website and channels are merely republished information from official and unofficial domestic and foreign sources, and it is obvious that users of the said content are responsible for following up and ensuring the authenticity and accuracy of the materials. Therefore, while disclaiming responsibility, it is declared that the responsibility for any decision-making, action, and potential profit and loss in the capital market and cryptocurrency market lies with the trader.