
Arknex
@t_Arknex

What symbols does the trader recommend buying?
Purchase History
پیام های تریدر
Filter
Arknex
تحلیل فنی POPCAT/USDT: آیا وقت ورود به پامپ جدید فرا رسیده است؟ (سطوح دقیق خرید و فروش)
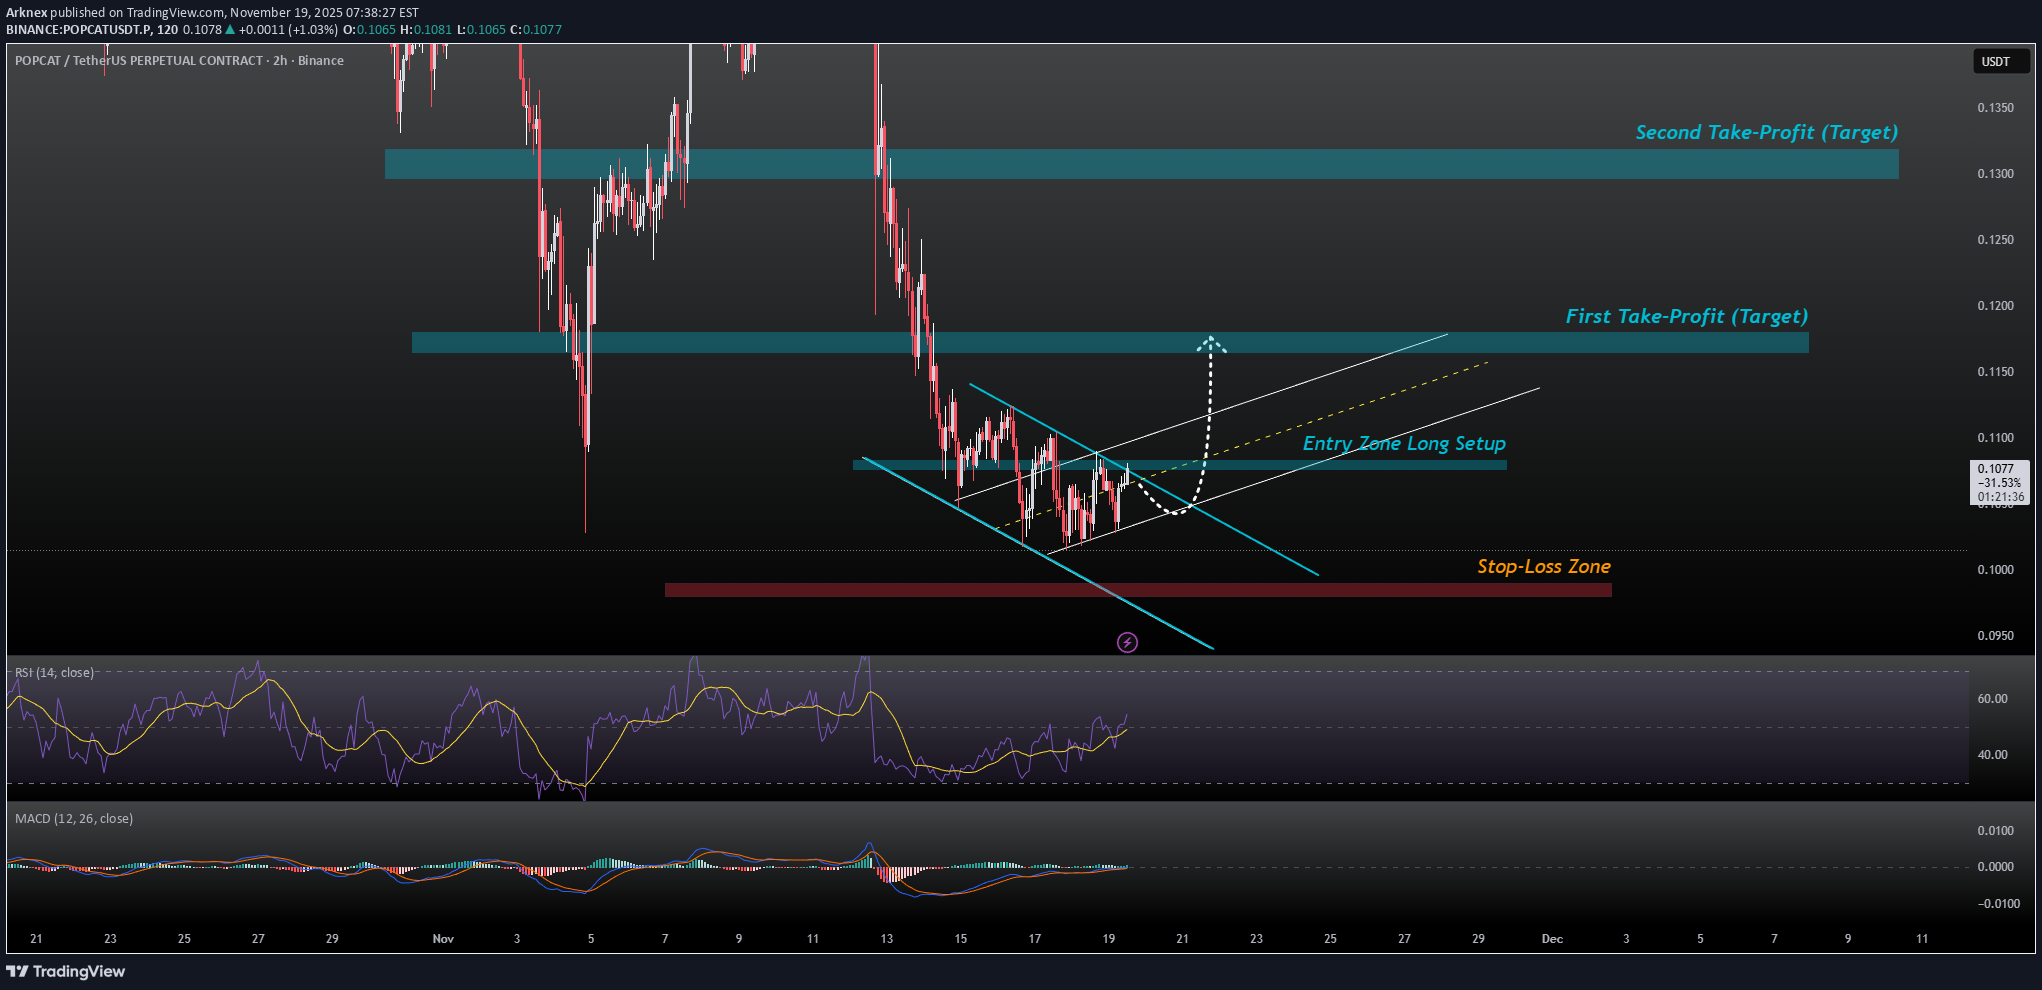
Current Market View Price appears to be attempting a breakout of the channel into a new upward trend channel (marked in white/grey). On the hourly chart, momentum oscillators (RSI, MACD) show early signs of shift: RSI is climbing from oversold/neutral area; MACD lines are converging. The 4-hour and daily charts suggest the downtrend is still in place, but the breakout attempt may signal a reversal if sustained. Proposed Entry & Exit Levels Entry Zone (Buy Setup) Entry: around $0.102 – $0.106 USDT if the price successfully breaks above the upper boundary of the descending channel and closes above it. Stop-Loss (Risk Control) Stop-loss below the recent swing low and the lower channel boundary: around $0.095 – $0.098 USDT. Take-Profit Targets TP1: $0.115 – $0.118 USDT (initial target upon channel breakout) TP2: $0.125 – $0.130 USDT (next psychological level if momentum carries) TP3 (extended): $0.140 USDT or more – only if the broader trend turns bullish and volume supports.
Arknex
تحلیل زِنوسدیت (ZENUSDT): آیا آماده جهش به ۱۳.۱۰ دلار است؟
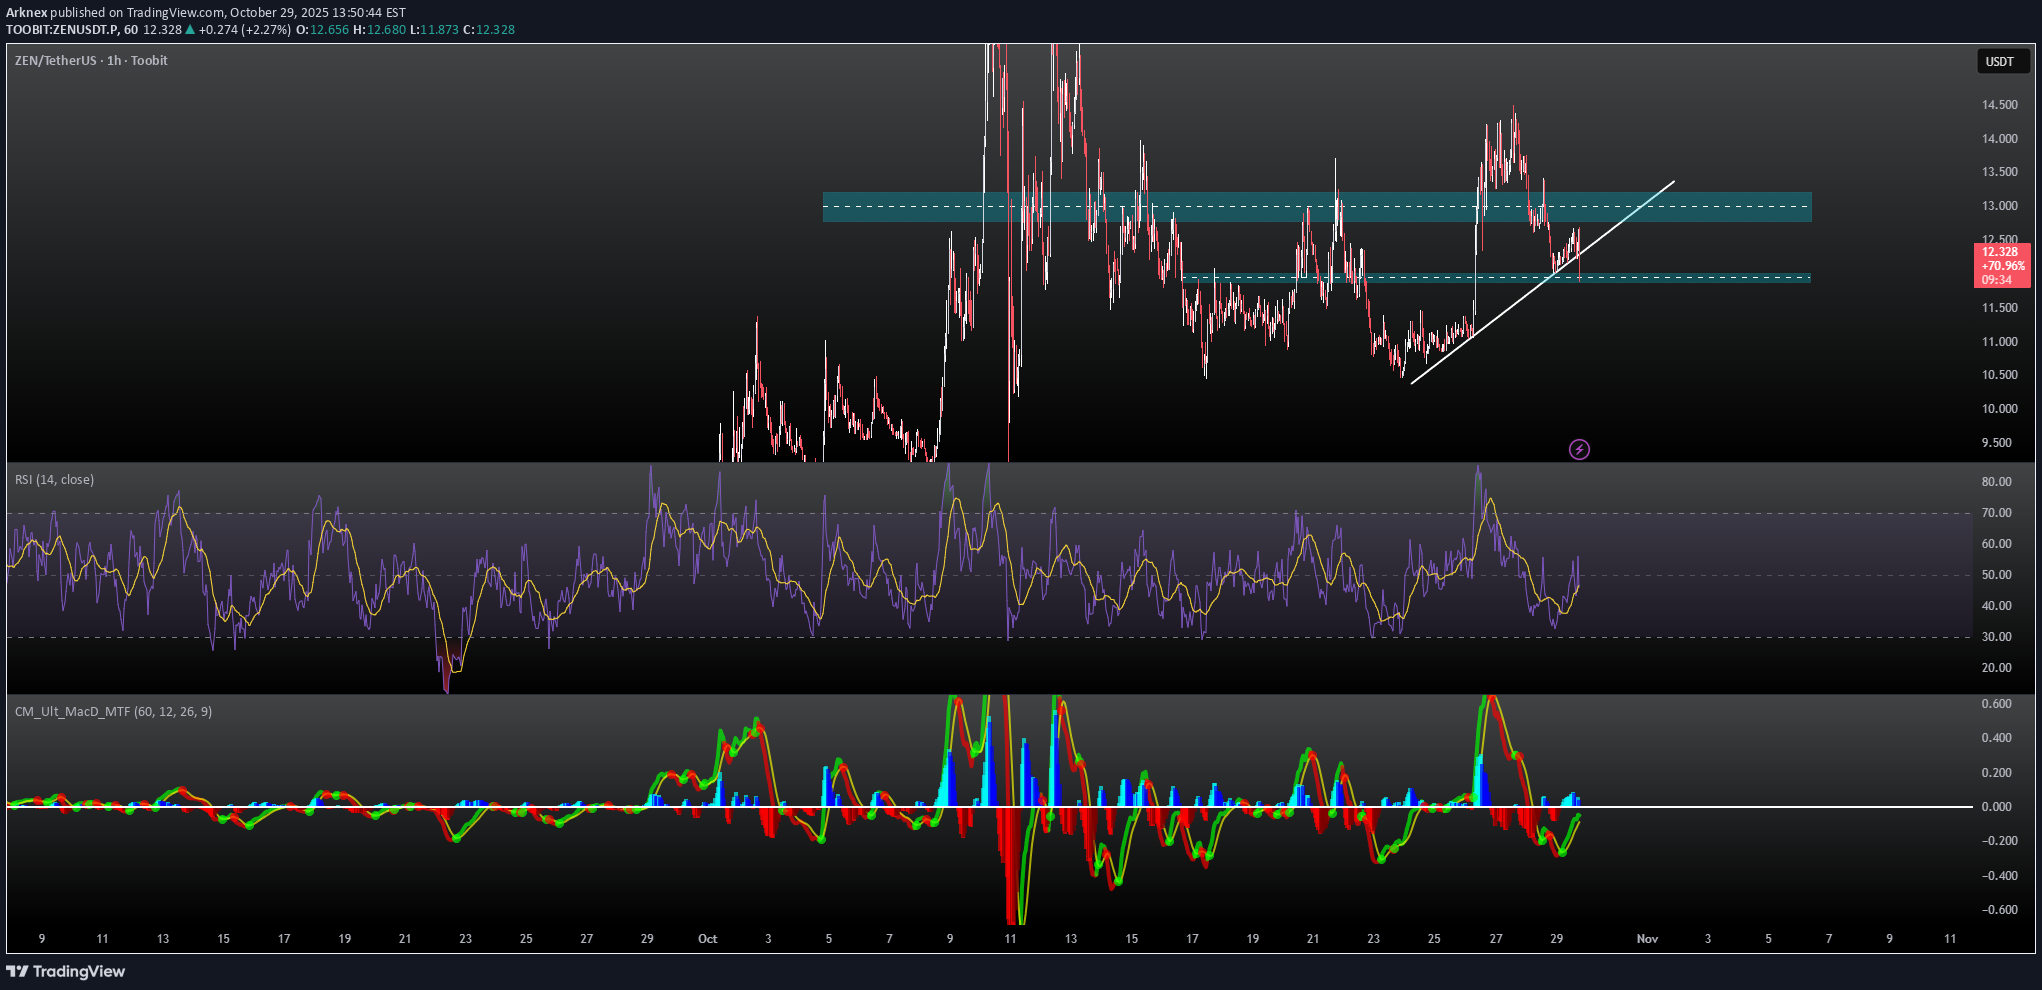
Price stabilizing near $12.45 after pullback. RSI (1h ~49) recovering from mid-zone and MACD showing early bullish crossover with low momentum. In my opinion possible short bounce toward $12.90–13.10 if volume confirms. Importan: the break below $12.10 invalidates setup.
Arknex
صعود انفجاری SNXUSDT: هدف نهایی ۲.۲۵ دلار کجاست؟
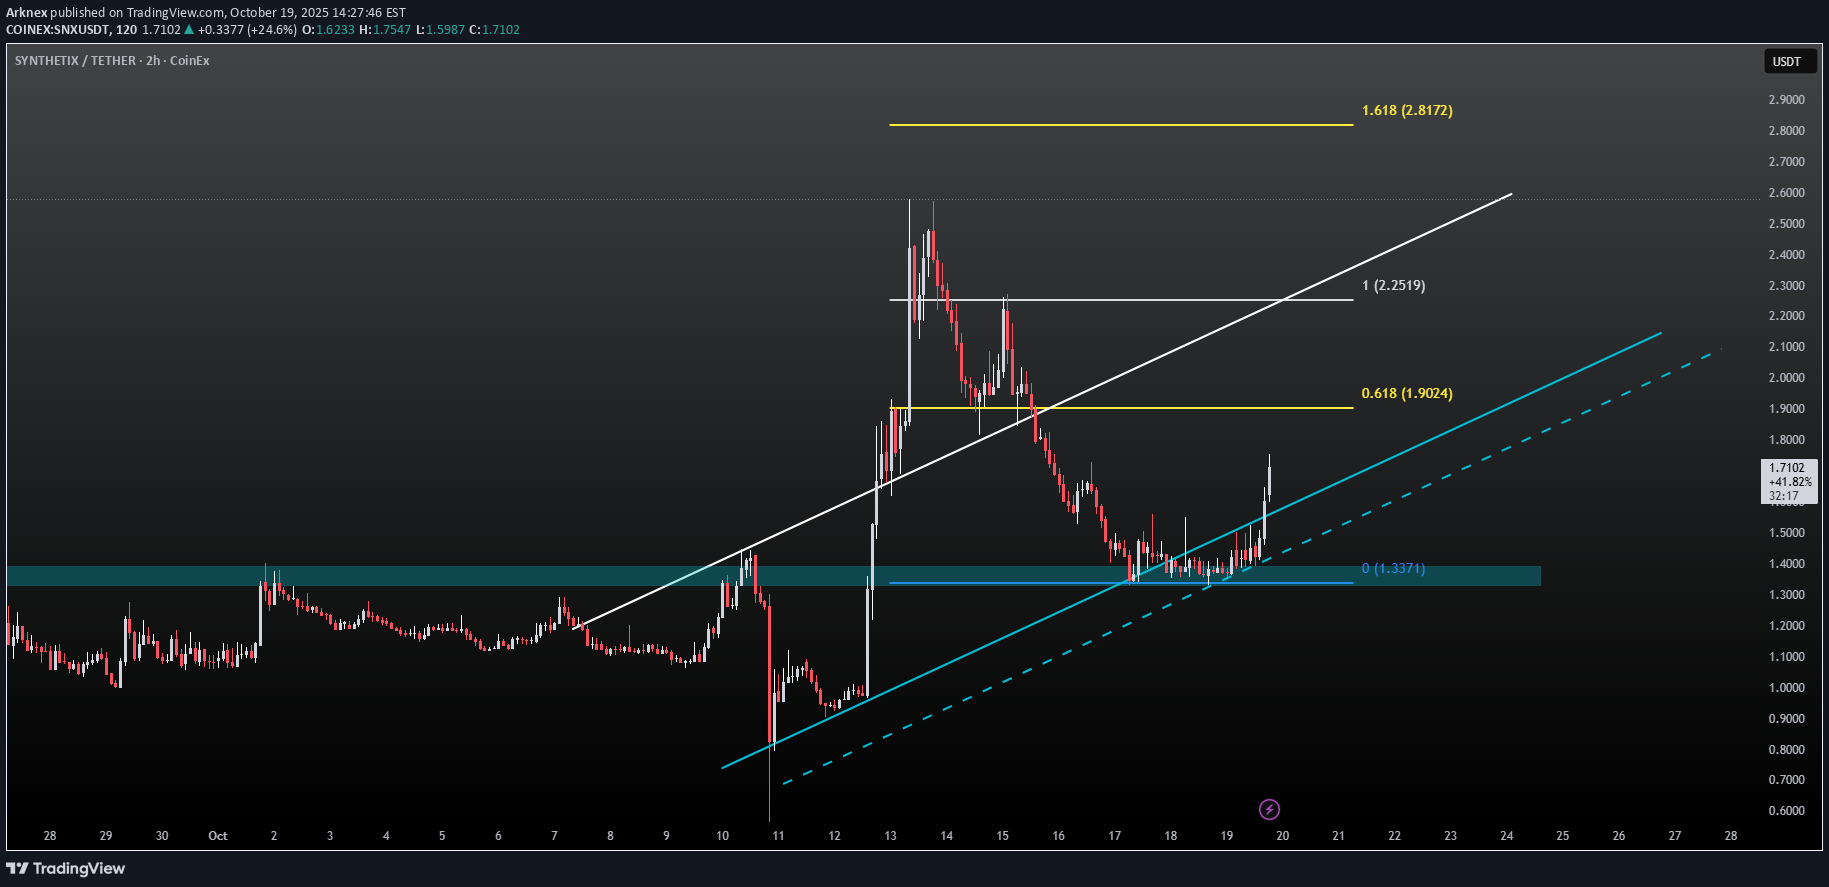
SNXUSDT has demonstrated significant bullish momentum, breaking out of a consolidation phase with a remarkable +26.08% surge on October 19, 2025. This move pushed the price to a high of $1.7396, indicating strong buying pressure. The price is currently situated above the crucial Fibonacci retracement level of 0.618 at approximately $1.9034. A successful retest and hold above this level could confirm the continuation of the uptrend. The daily Relative Strength Index (RSI) is at a healthy 59.71, suggesting there is still room for growth before the asset becomes overbought. The 4-hour chart further supports this bullish sentiment, with the RSI at 63.72 after a significant +16.09% increase in a single 4-hour candle. Based on this analysis, a strategic entry point could be considered upon a successful retest of the support zone. Entry Zone: $1.65 - $1.72 Target 1: $1.90 (Fibonacci 0.618) Target 2: $2.25 (Previous resistance area) Target 3: $2.81 (Fibonacci 1.618) Stop-Loss: A close below $1.45 would invalidate this bullish outlook. Disclaimer: This is not financial advice. The cryptocurrency market is highly volatile. Please conduct your own research before making any investment decisions.
Disclaimer
Any content and materials included in Sahmeto's website and official communication channels are a compilation of personal opinions and analyses and are not binding. They do not constitute any recommendation for buying, selling, entering or exiting the stock market and cryptocurrency market. Also, all news and analyses included in the website and channels are merely republished information from official and unofficial domestic and foreign sources, and it is obvious that users of the said content are responsible for following up and ensuring the authenticity and accuracy of the materials. Therefore, while disclaiming responsibility, it is declared that the responsibility for any decision-making, action, and potential profit and loss in the capital market and cryptocurrency market lies with the trader.