
Arash-RK
@t_Arash-RK

What symbols does the trader recommend buying?
Purchase History
پیام های تریدر
Filter
Arash-RK
POLYX: Primed for a Bounce? Long Opportunity at Channel Support.

Greetings, fellow traders, An interesting setup is forming on the POLYXUSDT chart. The price is currently situated near the lower boundary of an established ascending channel, suggesting a potential support zone. We are identifying a potential long entry under the following conditions: A confirmed close on the 1-hour (or 30-minute for more aggressive entries) timeframe within the confines of the delineated blue triangle on the chart. Alternatively, a decisive close above the $0.1830 resistance level. Should either of these conditions be met, a long position could be initiated with a primary price target of $0.2150. Best of luck with your trades. Trade with discipline and manage risk accordingly.
Arash-RK
USUAL Idea - USUAL/Theter

Hey traders! Sorry, no chart Analysis! My suggestion is to enter above the $0.1530 price range With targets: 1- $0.1650 2- $0.1790 3- $0.1900 There is a possibility of a price correction to the $0.1400 range Good luck
Arash-RK
JASMY/USDT: Bullish Breakout and Long Opportunity

Hello fellow traders, I've spotted a promising long opportunity on JASMY/USDT that I wanted to share with you. Here's the setup: Breakout Confirmation: JASMY has successfully broken out of a descending channel, indicating a potential shift in momentum. Retracement and Readiness: Following the breakout, the price has retraced, suggesting it's now poised for an upward move. Target: My target for this trade is the $0.01250 level, which conveniently aligns with the 200-period moving average on the 4-hour timeframe. Here's my proposed trade plan: Entry: I'm looking to enter the trade once the price moves above $0.01060. Stop Loss: To manage risk, I've set my stop loss around $0.00970. Remember, this is just my analysis, and trading always carries risk. Please do your own due diligence before making any trading decisions. Wishing you all profitable trades!
Arash-RK
Wormhole (W): Is the Correction Over? Targeting $0.1700 and $0.2

Greetings, fellow traders! Following a significant rally that reached the $0.1300 resistance zone, Wormhole (W) is currently undergoing a corrective phase. This retracement is finding support near the key 0.50 and 0.618 Fibonacci levels, a common area for price consolidation before a potential trend continuation. Anticipated Price Action: Based on the current technical structure, a resumption of the upward trend towards the $0.1700 and $0.2000 resistance levels is anticipated. The timeframe for this projected move is estimated to be within the next 24 hours. However, this is a projection, and market conditions can change rapidly. Trading Considerations: Cautious Entry: While a continuation of the uptrend is likely, traders should exercise caution when initiating long positions. Confirmation of bullish momentum, such as a strong bullish candlestick pattern or a break above a short-term resistance level, is recommended before entry. Entering during a retracement carries increased risk. Fibonacci Support: Monitor price action closely around the 0.50 and 0.618 Fibonacci levels. These levels may act as potential support and provide opportunities for entry, if accompanied by bullish confirmation signals. Timeframe: Keep the projected 24-hour timeframe in mind, but remain adaptable to changing market dynamics. Disclaimer: This analysis is for informational purposes only and should not be considered financial advice. All trading decisions should be made after conducting thorough independent research, including a comprehensive risk assessment. Market conditions can be volatile, and past performance is not indicative of future results.
Arash-RK
POPCAT idea
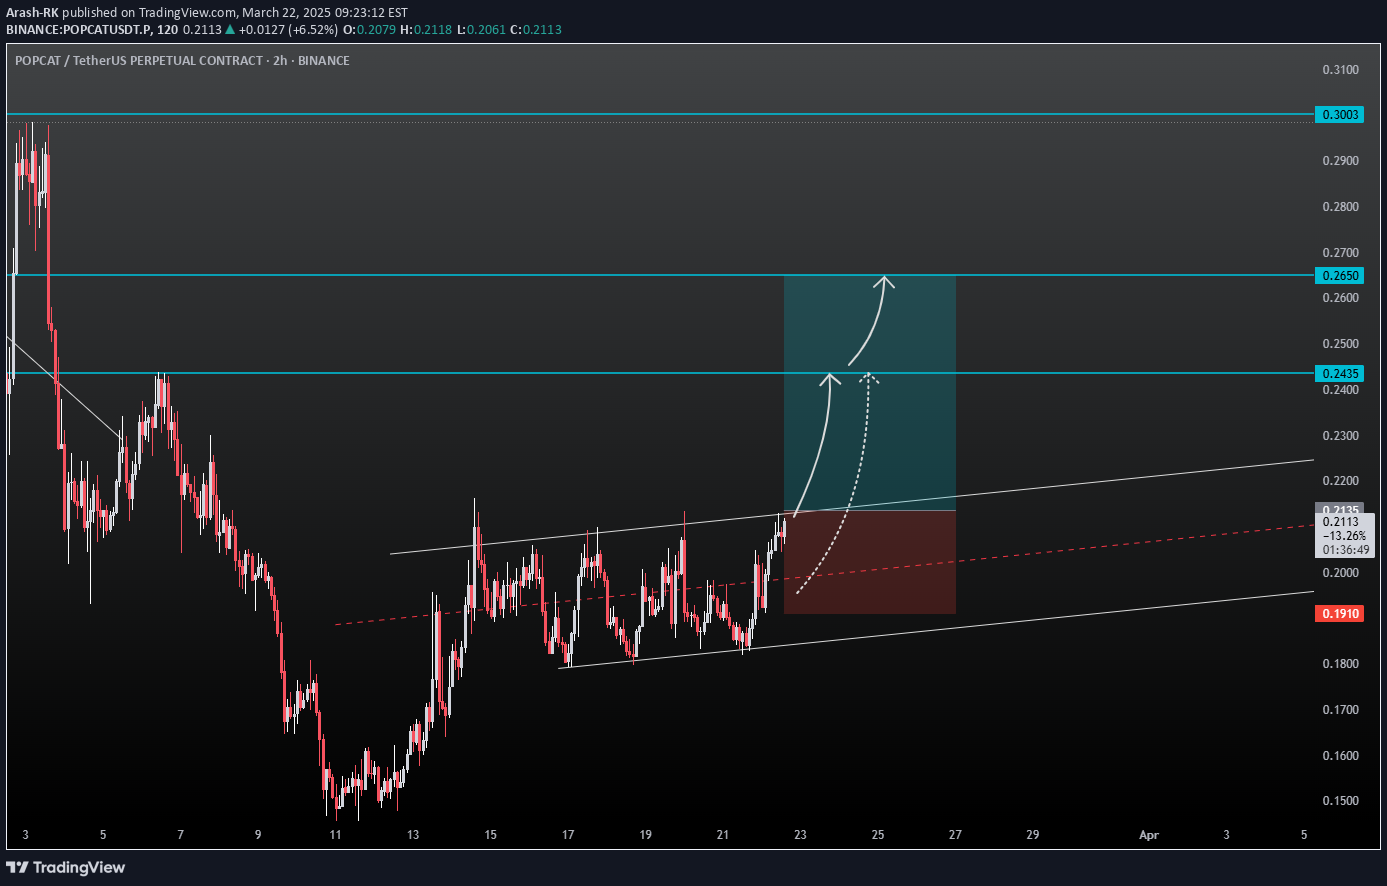
Greetings, fellow traders! My analysis suggests a developing potential for a bullish move in POPCAT/USDT. I'm observing a possible breakout scenario, and I'll outline a potential long trade setup. Entry Rationale: A long entry is suggested above the $0.2135 level, contingent upon a confirmed breakout from the currently established neutral-bullish channel. This breakout would serve as confirmation of increasing bullish momentum. Trade Setup: Entry: Above $0.2135 (post-breakout confirmation) Target 1: $0.2435 Target 2: $0.2650 Stop-Loss: $0.1910 (This provides a risk management level below a recent swing low, it's just an idea.) Risk Management: A stop-loss order placed around $0.1910 is recommended to mitigate potential losses should the trade move against the anticipated direction. Disclaimer and Call to Action: I welcome your constructive feedback and alternative perspectives on this analysis. Please conduct your own independent research and due diligence, including thorough risk assessment, before making any trading decisions. This analysis is for informational purposes only and does not constitute financial advice.
Arash-RK
Grass/USDT uptrend Idea....
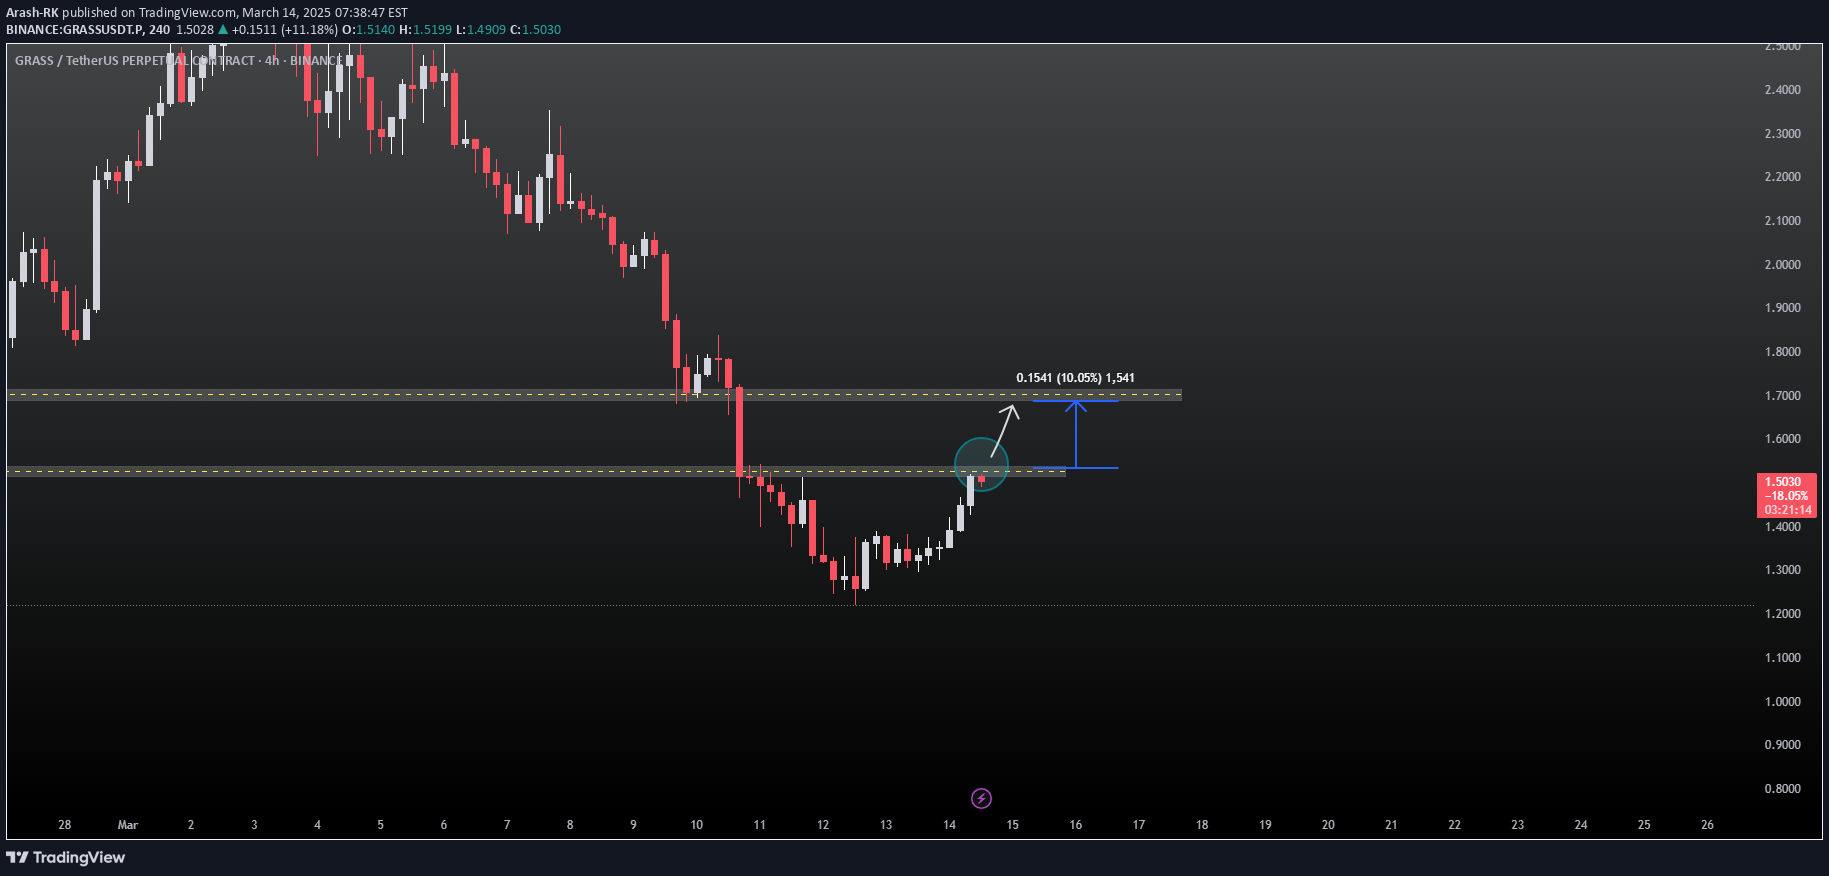
Hello, Traders! Grass/USDT is showing early signs of an uptrend, encountering initial resistance at $1.500. The asset is currently gathering momentum, with the potential to continue higher. A confirmed breakout above the resistance could lead to a test of the 59-period moving average on the 4-hour timeframe. I'm eyeing a potential long trade above $1.5250, with a target around $1.700. However, always manage your risk and use appropriate stop-loss orders. Good luck and trade responsibly!
Arash-RK
DYDX/USDT: Long Opportunity Above $0.7450

Greetings, traders, A more detailed analysis of the DYDXUSDT chart will follow in the comments section below. For now, a potential long opportunity presents itself above $0.7450. Entry: Above $0.7450 Take Profit: About $0.8350 Stop Loss: $0.7250 DYDXUSDT I will post a detail analysis of DYDXUSDT in comment. Profitable trades to all!
Arash-RK
POPCAT/USDT: Head and Shoulders Points to Continued Downtrend
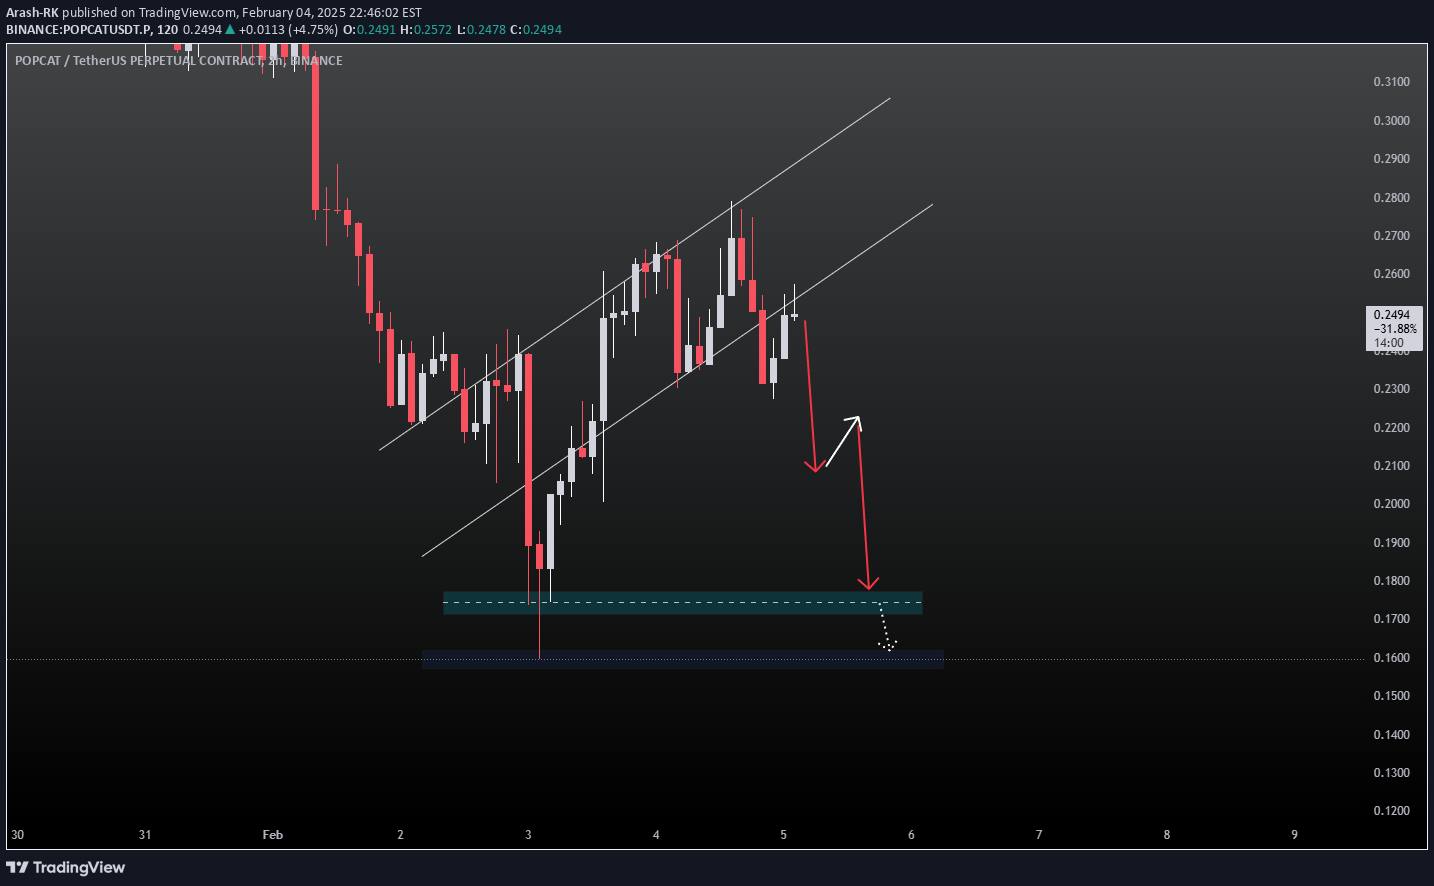
Hey traders! POPCAT/USDT is forming a head and shoulders pattern, signaling a likely continuation of the recent downtrend. Following a temporary price correction within the pattern, the downtrend is expected to resume. POPCATUSDT Now is the time to short the PopCat, after the 2-hour candle closes, I enter a short trade below the closed 2-H candle. Profitable trades to all!
Arash-RK
ONDO/USDT: Wave 5 Elliot Wave, Long Opportunity

📈 ONDOUSDT Greetings, traders! On the 2-hour chart of ONDO/USDT, the fifth wave of an Elliott Wave uptrend appears to be forming, presenting a potential long trade opportunity. I've identified a potential entry point above $1.4400, with the following targets: Target 1: $1.6200 Target 2: $1.7000 My stop-loss would be placed in the range of $1.3000 to $1.3200. Disclaimer: This is not financial advice. Trade at your own risk.
Arash-RK
DOGS/USDT: Price Corrections After Extended Downtrend

Greetings, traders, The 🐶 DOGS/USDT chart reveals an interesting pattern after a two-month downtrend. We're now seeing short-term price corrections forming across multiple timeframes. These corrections are consistently reaching the 0.50 and 0.618 Fibonacci retracement levels, as well as the 50-period moving average on each respective timeframe. Based on this observation, I've identified a potential entry point for a short position at the upper range of $0.002550. My entry and exit points are clearly marked on the chart for your reference. Profitable trades to all!
Disclaimer
Any content and materials included in Sahmeto's website and official communication channels are a compilation of personal opinions and analyses and are not binding. They do not constitute any recommendation for buying, selling, entering or exiting the stock market and cryptocurrency market. Also, all news and analyses included in the website and channels are merely republished information from official and unofficial domestic and foreign sources, and it is obvious that users of the said content are responsible for following up and ensuring the authenticity and accuracy of the materials. Therefore, while disclaiming responsibility, it is declared that the responsibility for any decision-making, action, and potential profit and loss in the capital market and cryptocurrency market lies with the trader.