
Altcenter_Analysis
@t_Altcenter_Analysis

What symbols does the trader recommend buying?
Purchase History
پیام های تریدر
Filter
Altcenter_Analysis
APTUSDT Ready for a Bullish Rebound

APTUSDT is showing strong signs of an upward trend, with a key support level at $9.23. Indicators such as the RSI suggest a recovery from oversold conditions, indicating a potential increase in buying pressure. This support level may act as a foundation for a bullish move in the near term.
Altcenter_Analysis
STRK/USDT: Bullish Momentum Builds as Technical Indicators Sign
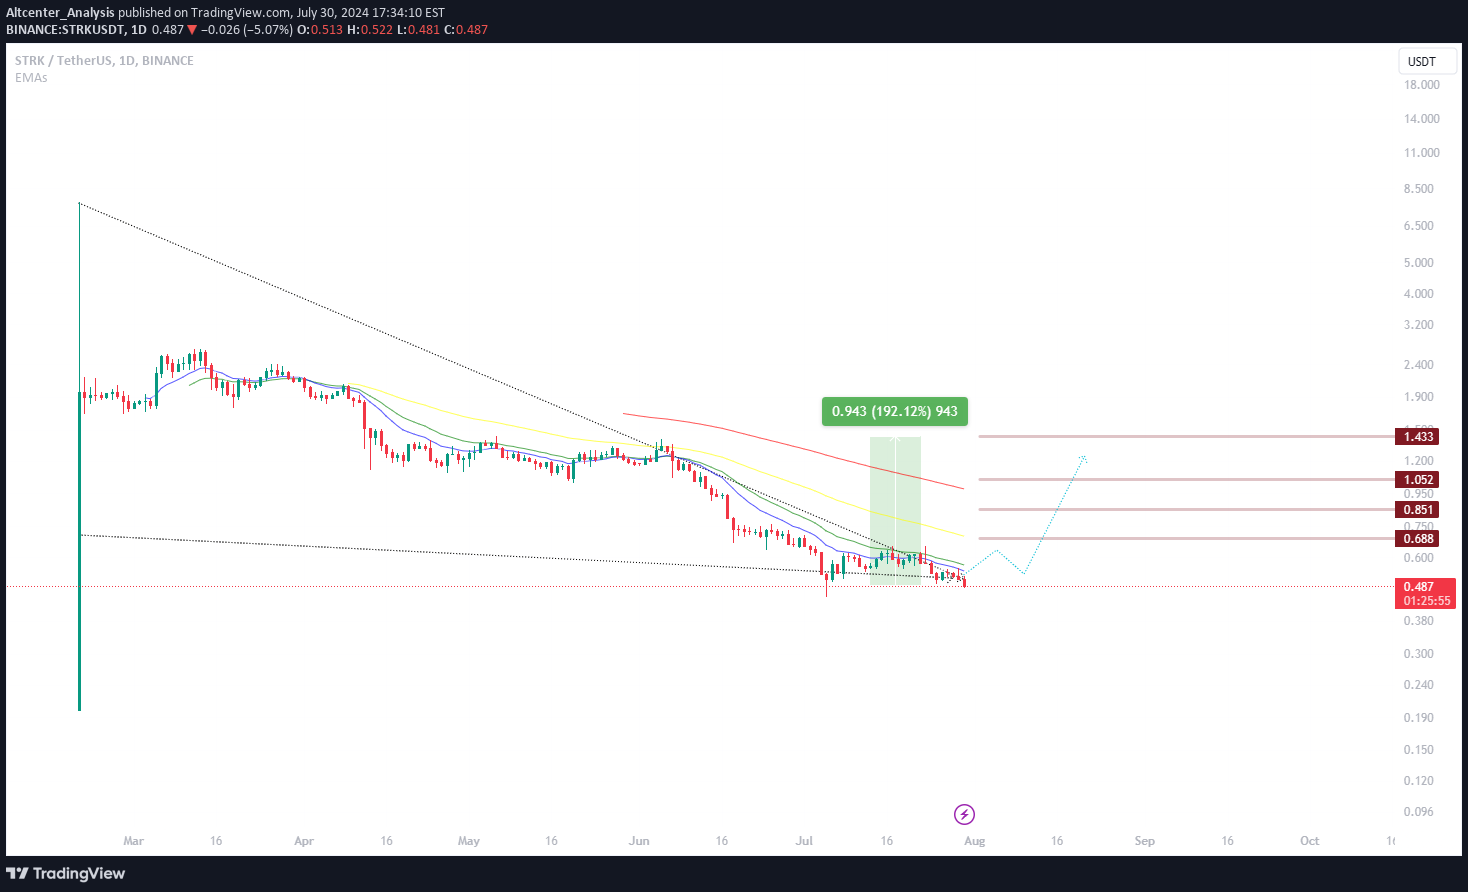
Analyzing the recent performance of STRK/USDT, several technical indicators suggest that the cryptocurrency might be poised for an upward trend from its current price of $0.489. Firstly, the Moving Average Convergence Divergence (MACD) has shown a bullish crossover, with the MACD line crossing above the signal line. This is typically a strong indicator that upward momentum is building and could lead to price appreciation. Additionally, the Relative Strength Index (RSI) is currently at 60, which is above the neutral 50 level but still below the overbought threshold of 70. This positioning suggests that there is room for further growth before the currency enters overbought territory, making it an attractive option for traders looking for upward potential. The 50-day moving average is approaching a crossover with the 200-day moving average, signaling a potential "golden cross." This is a bullish indicator often seen as a sign of a long-term upward trend in the making. Moreover, trading volume has shown a significant uptick, indicating increased market interest and participation. This rise in volume is often correlated with sustained price movements, suggesting that the current upward trend may continue. The Bollinger Bands are also starting to widen, reflecting increasing volatility with an upward bias. The price has consistently closed near the upper band, which is another indication of bullish sentiment in the market. Overall market sentiment around cryptocurrencies, particularly altcoins like STRK, has been improving, driven by positive developments and increasing adoption. These factors combined with the technical indicators point towards a potential continued rise in STRK/USDT from its current price level of $0.489.
Altcenter_Analysis
PYRUSDT has surged by 168.30%

The cryptocurrency PYRUSDT has surged by 168.30%, reaching a price of $10.92. This remarkable increase demonstrates a significant bullish trend in its market performance. Investors are closely monitoring its trajectory as it continues to show substantial growth potential. #PYRUSDT All Targets: done✅ Entry price: 4.07$✅ Price reached :10.92$ ✅ Profit: 168.30% ✅🚀🚀🤑
Altcenter_Analysis
POLSUSDT Skyrockets by 249%, Reaching $1.3976! 🚀

All Targets: done✅ Entry price: 0.400$✅ Price reached :1.3976$ ✅ Profit: 249% ✅🚀🚀🤑 In a remarkable surge, the cryptocurrency POLSUSDT has experienced an impressive gain of 249%, achieving a notable price of $1.3976. This substantial ascent underscores the coin's strong bullish momentum, capturing the attention of traders and investors alike. Stay tuned for further insights as POLSUSDT continues its upward trajectory in the dynamic world of cryptocurrency.
Altcenter_Analysis
GLMRUSDT All Targets: done✅

#GLMRUSDT Only in VIP Spot 🔥🎯 All Targets: done✅ Entry price: 0.0.1992$✅ Price reached :0.6414$ ✅ Profit: 221.98% ✅🚀🚀🤑
Altcenter_Analysis
STMXUSDT Soars by 143.58%, Reaching $0.013073! 🚀

All Targets: done✅ Entry price: 0.005367$✅ Price reached :0.013073$ ✅ Profit: 143.58% ✅🚀🚀🤑 In a remarkable ascent, the cryptocurrency STMXUSDT has surged by an impressive 143.58%, reaching a notable price of $0.013073. This significant uptrend has caught the attention of traders, highlighting the potential for substantial gains. Stay tuned for further insights as STMXUSDT continues its upward momentum in the dynamic digital currency market. #STMXUSDT #CryptoSurge 📈
Altcenter_Analysis
TROYUSDT Analysis: Bullish Momentum Ahead!

With TROYUSDT currently priced at $0.002617, key indicators signal a potential bullish surge. Moving averages and RSI trends suggest favorable conditions for an upward movement. Traders may consider this an opportune moment to explore long positions. 📈 #TROYUSDT #BullishOutlook
Altcenter_Analysis
NKNUSDT hit first target 36.04% ✅🚀

#NKNUSDT All Targets: done✅ Entry price: 0.0935$✅ Price reached :0.1272$ ✅ Profit: 36.04% ✅🚀🚀🤑
Altcenter_Analysis
GHSTUSDT

#GHSTUSDT #GHSTUSDT as you can see at the chart in daily chart time-frame we are in over sold area and we have very important and strong support zone i expect the price will fly to the target at the chart RSI showing bullish MACD is showing bullish EMAs is neutral i expect there will be a correction move buy and hold it to the next targets at the chart ZELMA is showing uptrend-move Ichimoku cloud is neutral Fib retracement is showing bullish Accumulation distribution is bullish
Altcenter_Analysis
EOSUSDT

EOSUSDT #EOSUSDT we are in over sold area in daily chart time-frame and we have powerful support zone RSI showing bullish EMAs showing a bullish move MACD is showing bullish Ichimoku cloud is neutral ZELMA is showing uptrend-move Accumulation distribution is neutral Fib retracement is showing bullish i expect the price will fly to the target at the chart buy and hold it to the next targets at the chart
Disclaimer
Any content and materials included in Sahmeto's website and official communication channels are a compilation of personal opinions and analyses and are not binding. They do not constitute any recommendation for buying, selling, entering or exiting the stock market and cryptocurrency market. Also, all news and analyses included in the website and channels are merely republished information from official and unofficial domestic and foreign sources, and it is obvious that users of the said content are responsible for following up and ensuring the authenticity and accuracy of the materials. Therefore, while disclaiming responsibility, it is declared that the responsibility for any decision-making, action, and potential profit and loss in the capital market and cryptocurrency market lies with the trader.