
AdamIdris2
@t_AdamIdris2

What symbols does the trader recommend buying?
Purchase History
پیام های تریدر
Filter
Signal Type
AdamIdris2
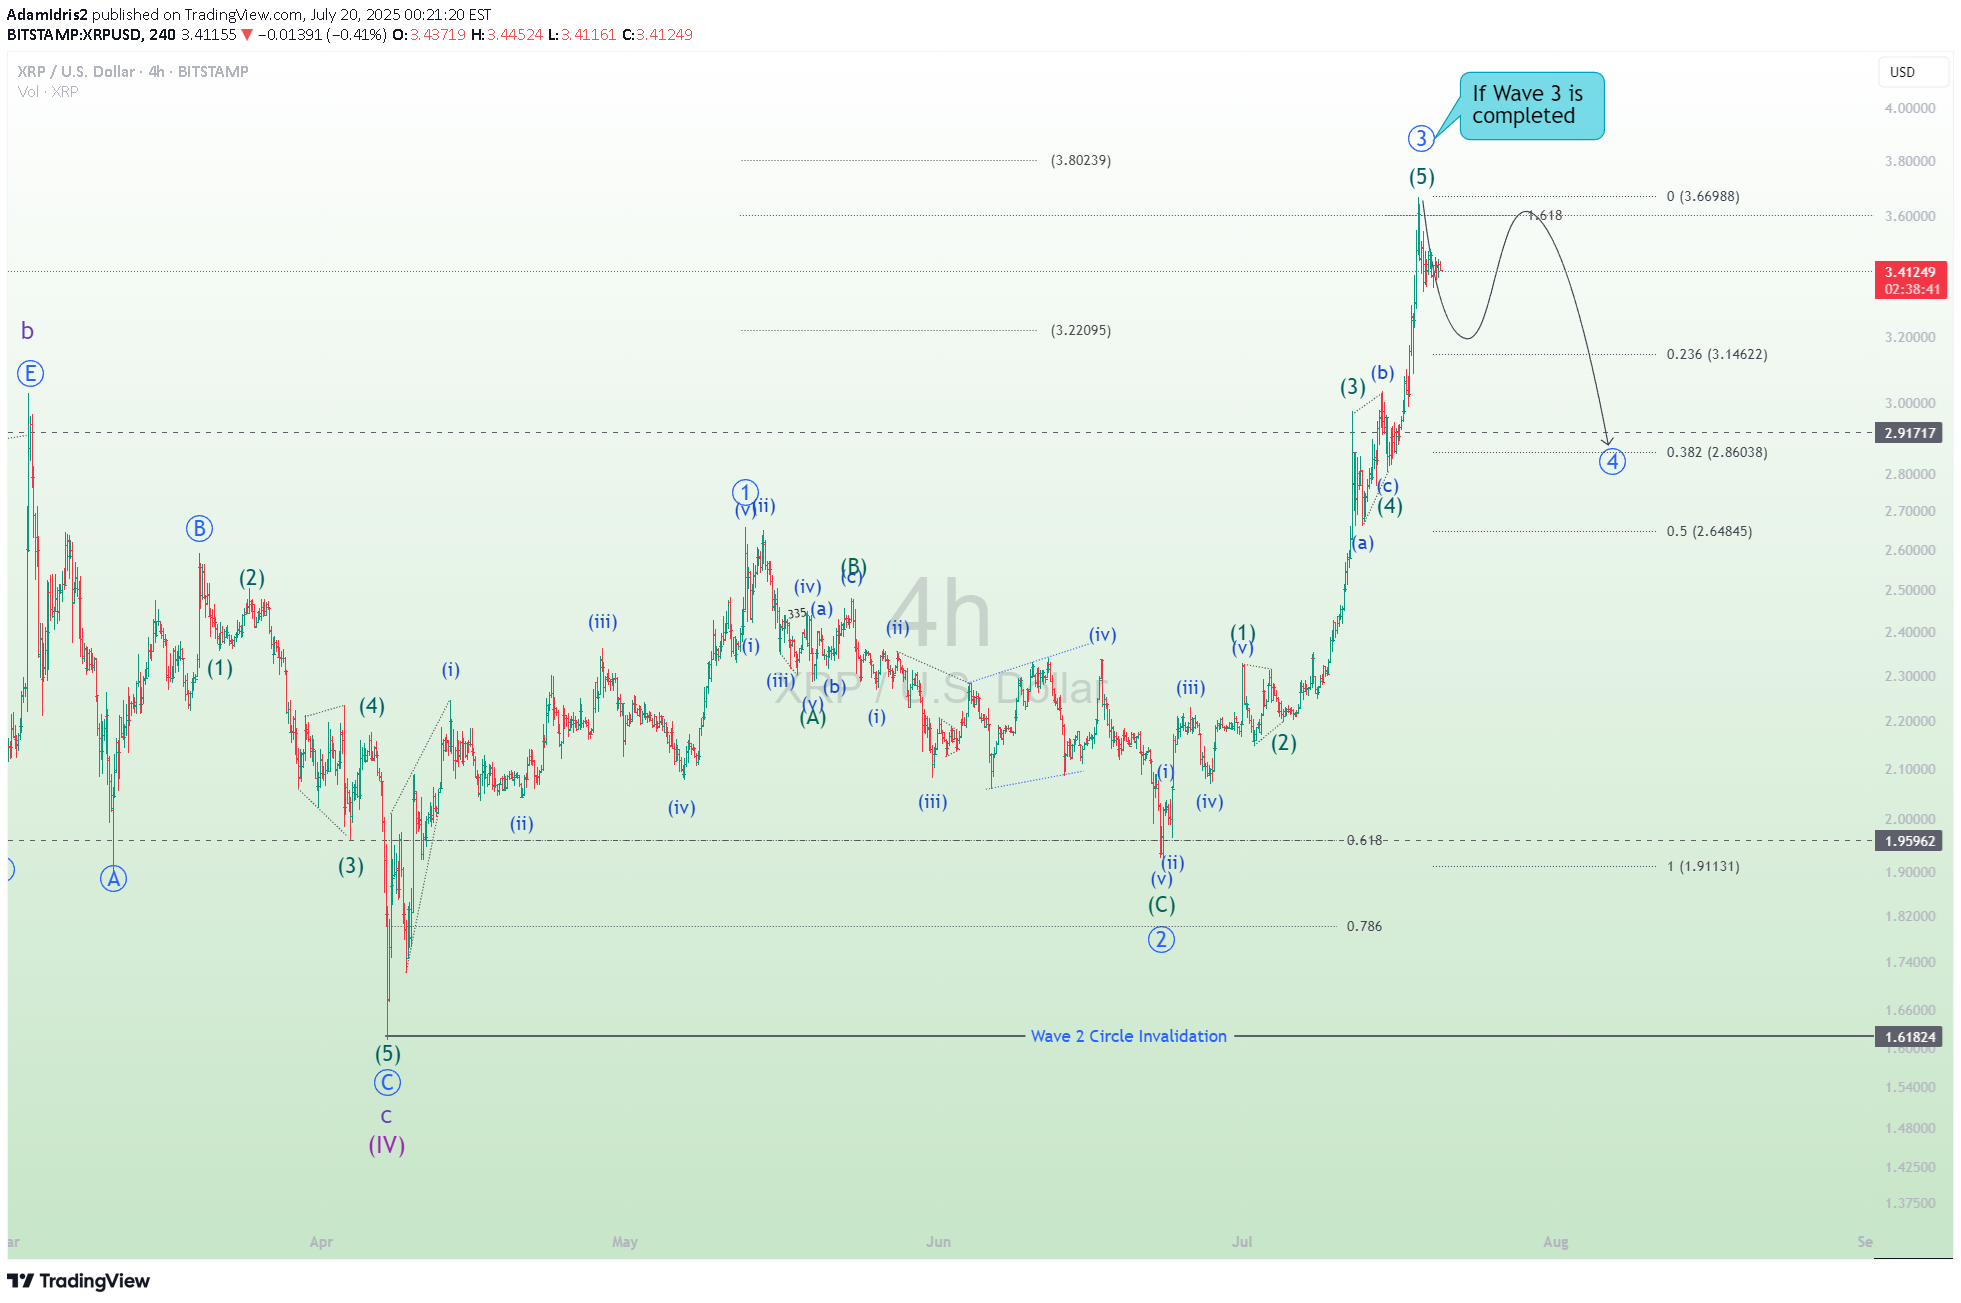
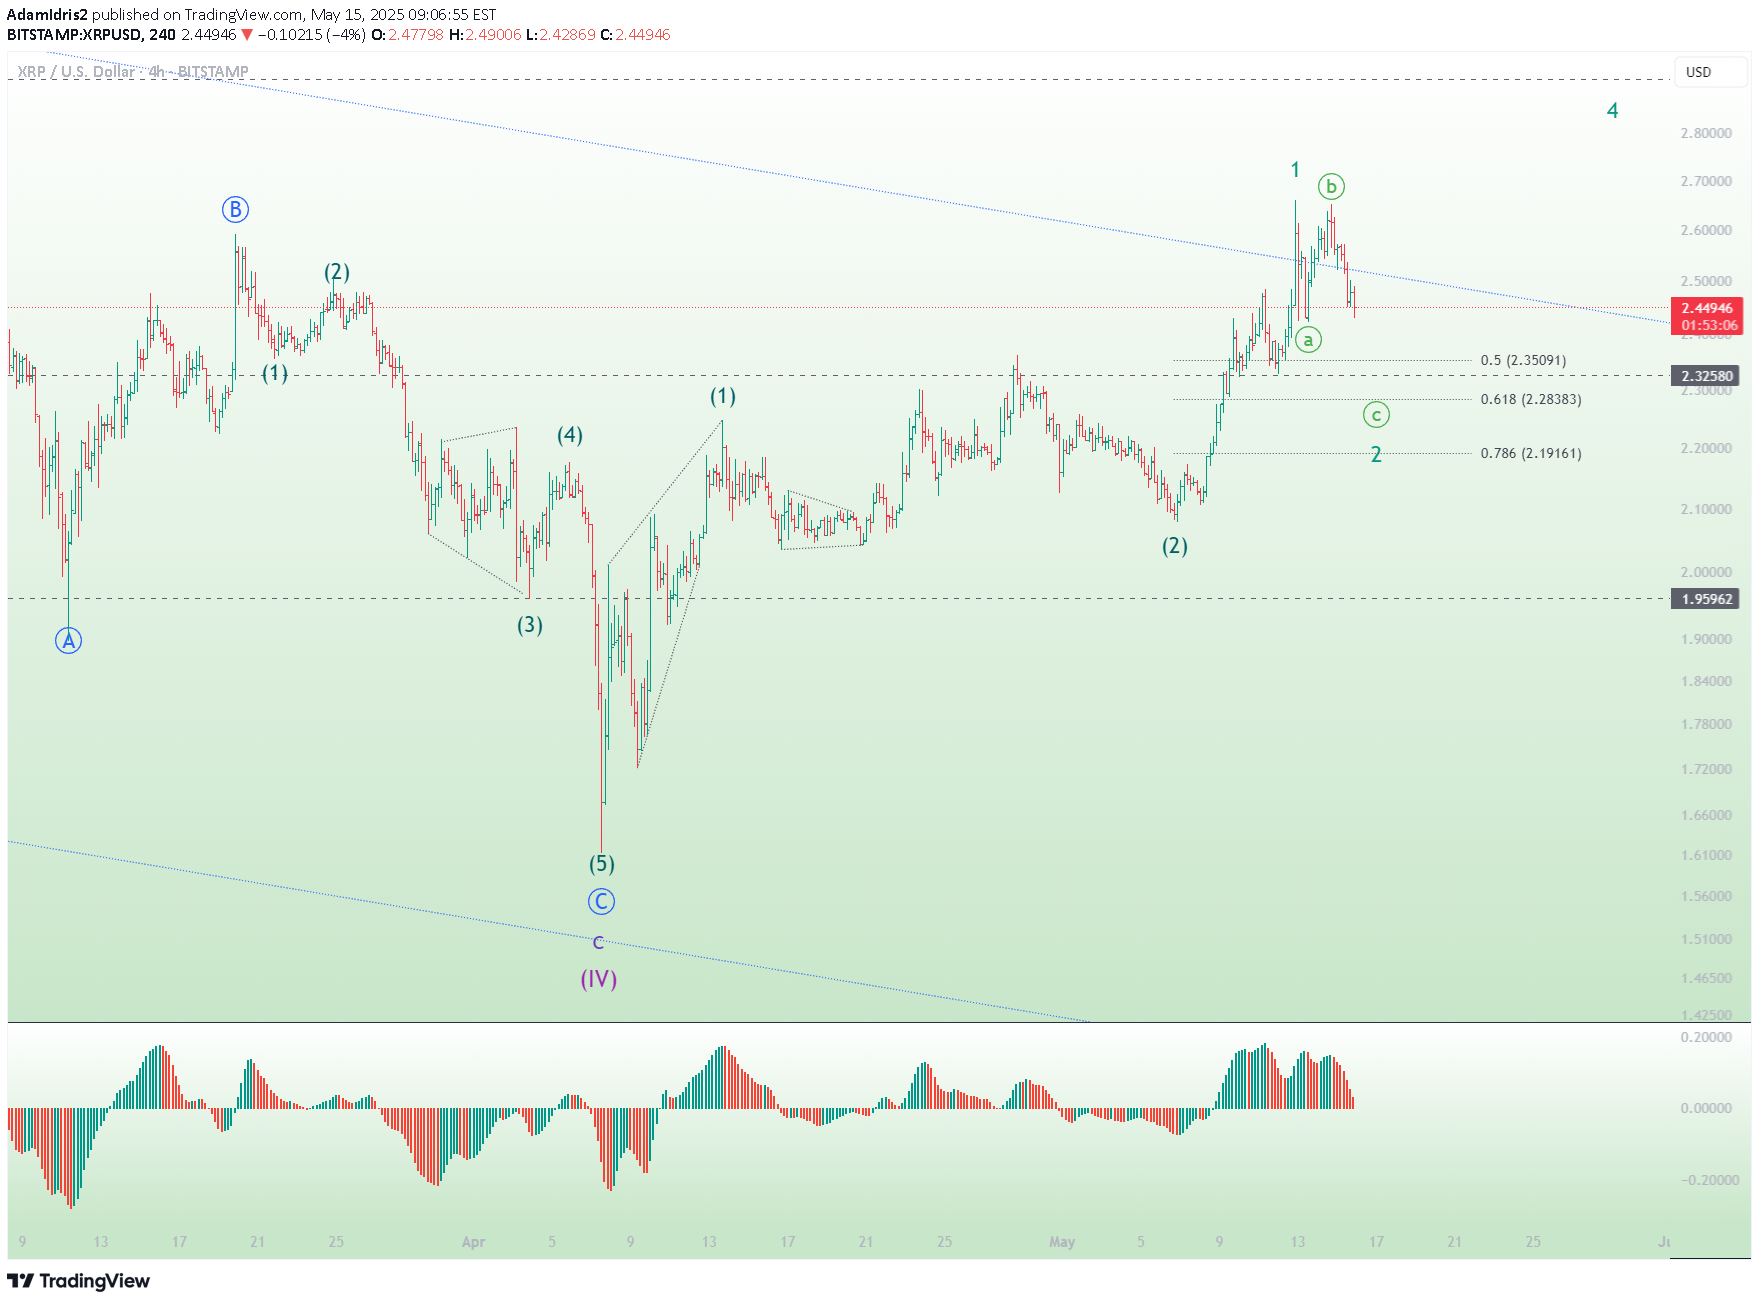
Now we see XRPUSD reached the level 1.618, a trader's psychological level for wave 3. If most traders take profit at this level accompanied by big volume, most probably we are going to see a new downtrend of wave A of wave 4.
AdamIdris2
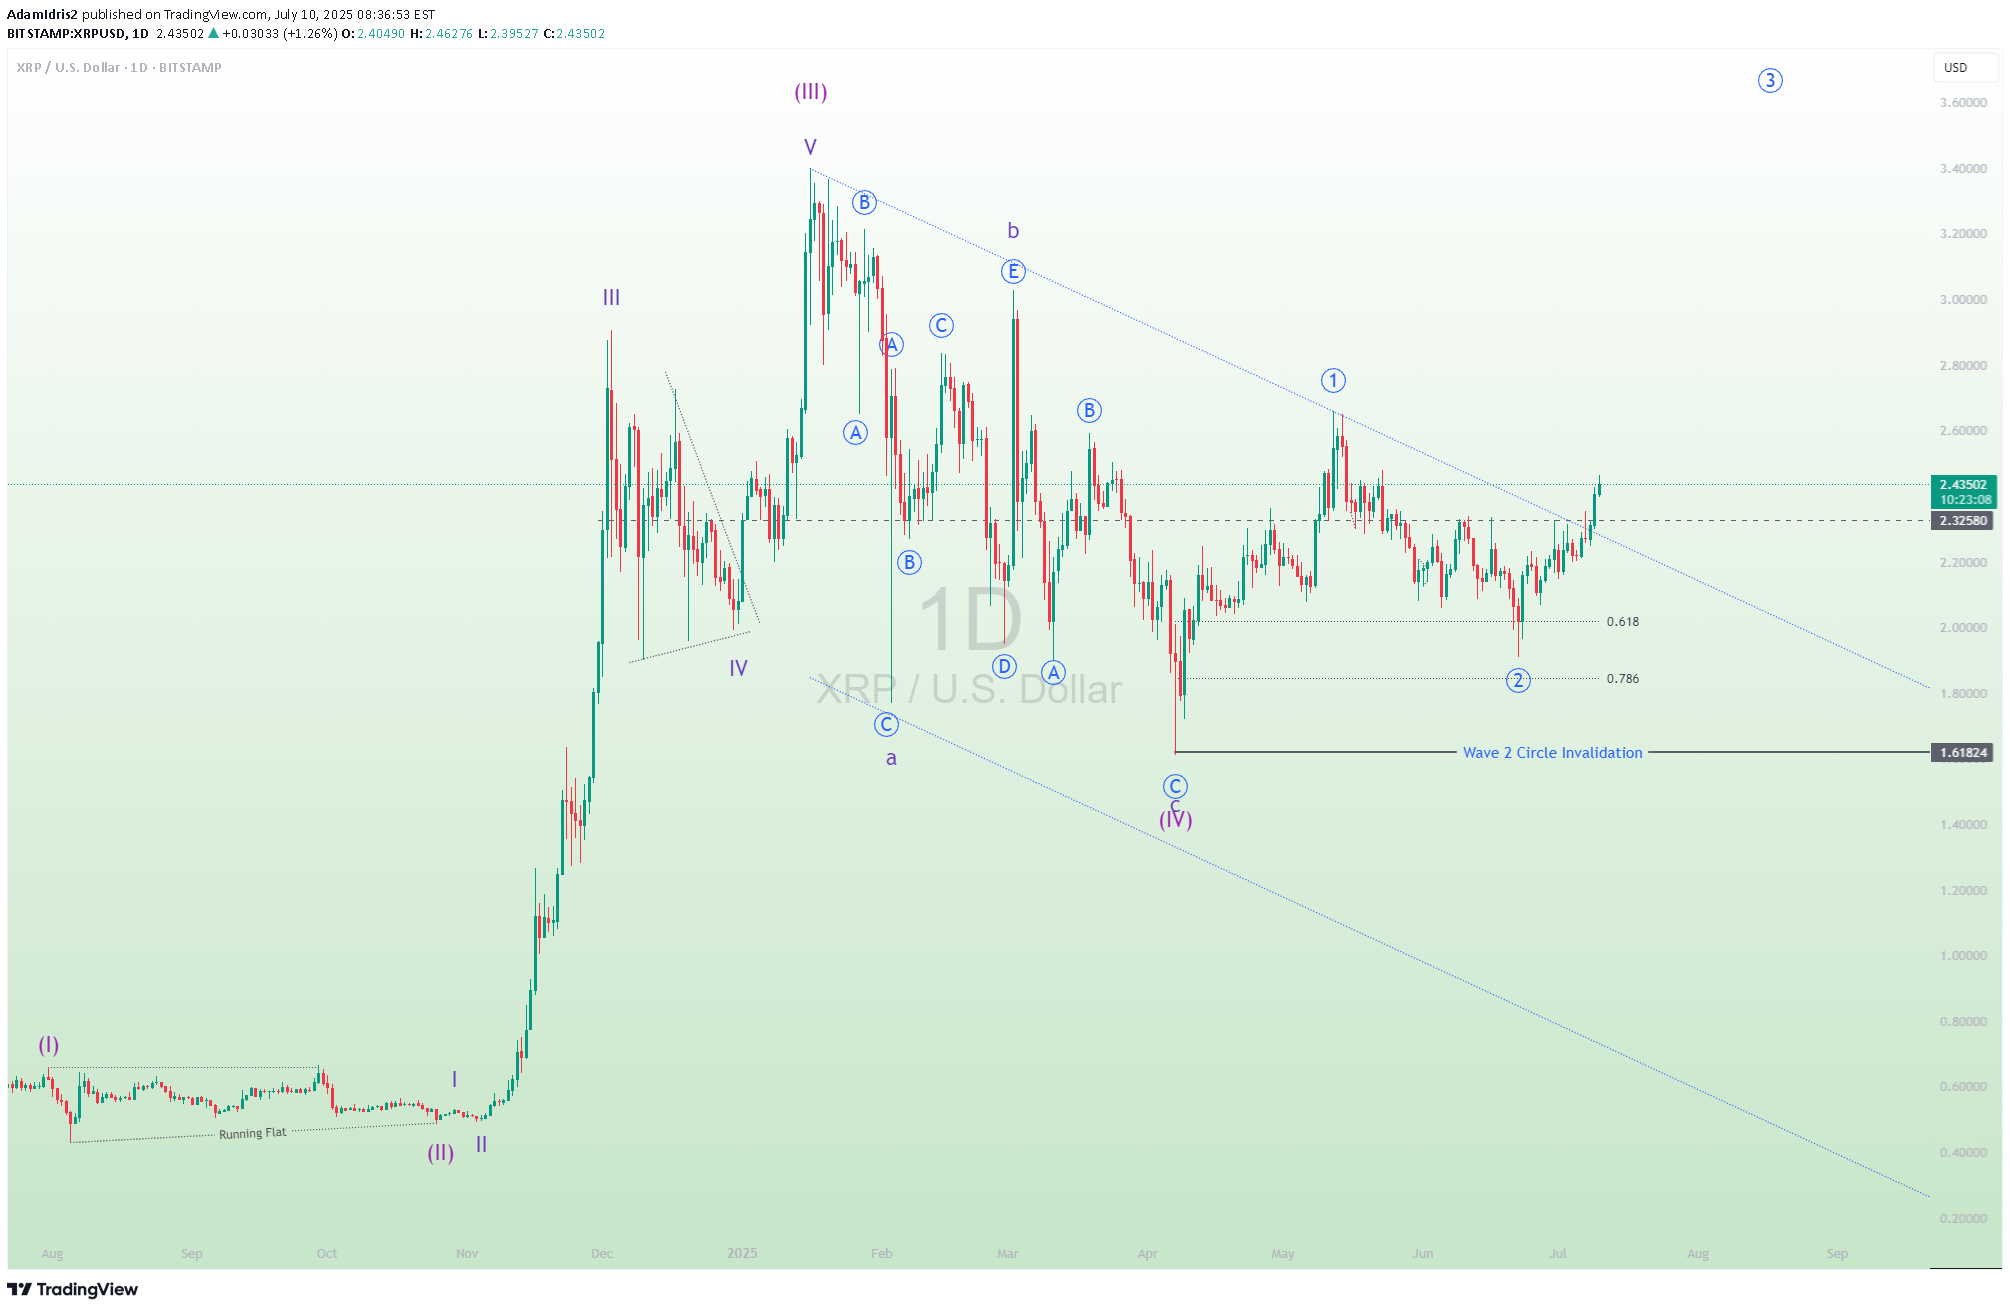
XRPUSD, in my opinion, has completed the wave 2 uptrend and is now moving toward wave 3 in 5 minor waves. Traders are advised to do their own technical analysis prior to placing a trade.
AdamIdris2
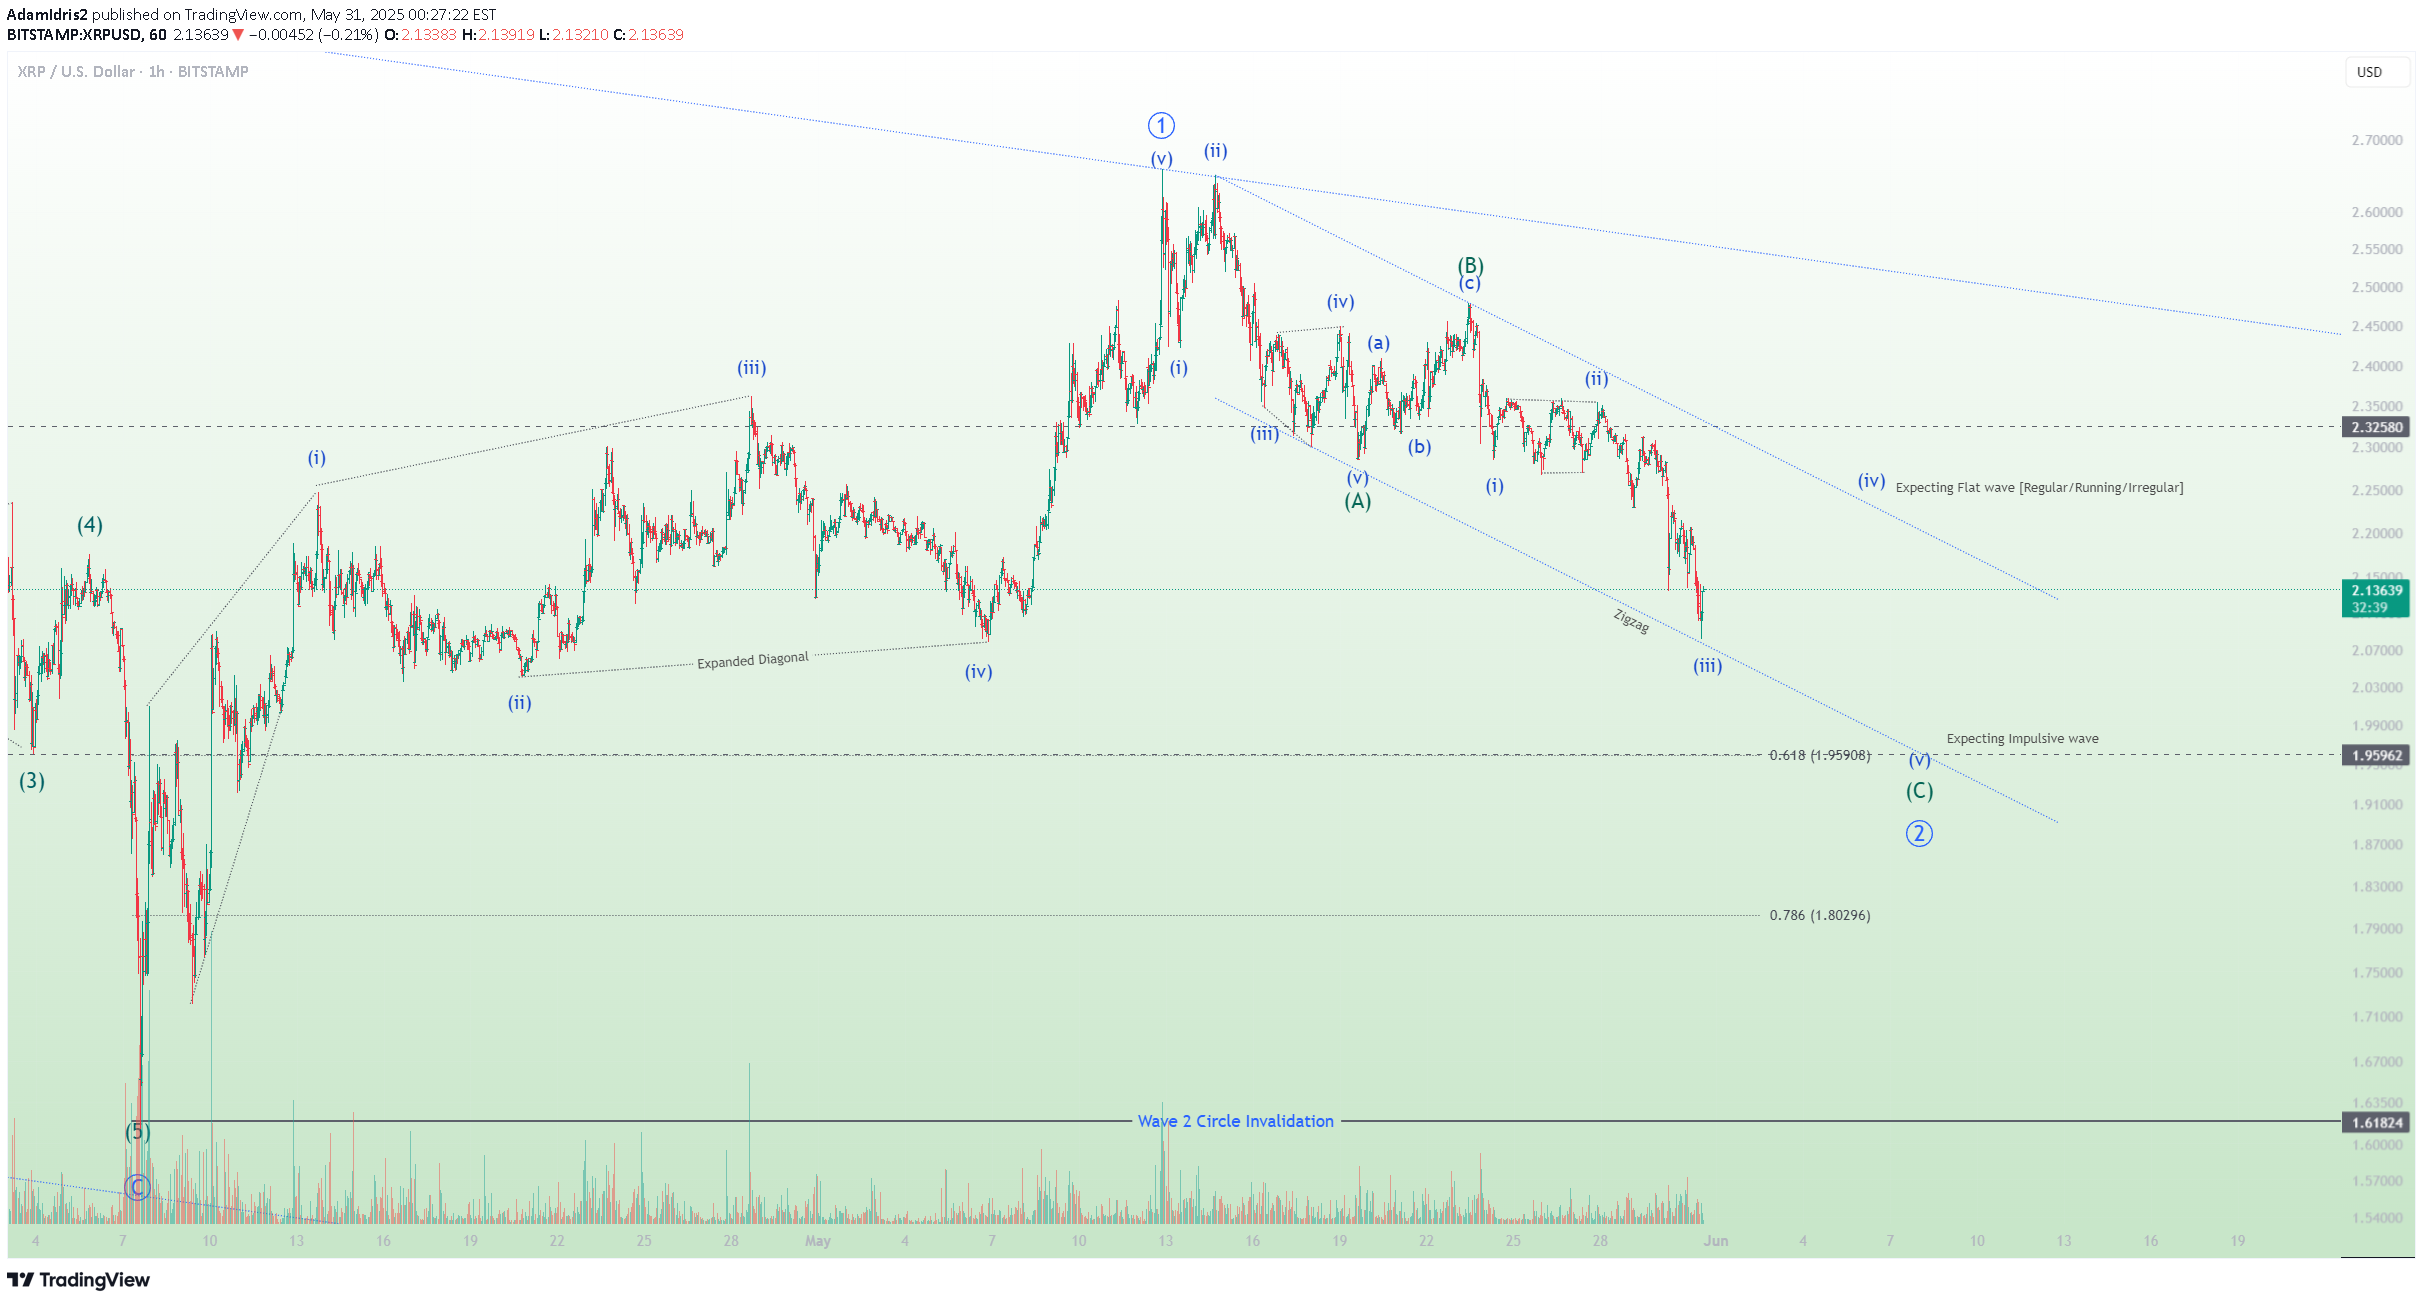
This is an update of my wave count for XRPUSD.Major trend : UptrendMinor trend : RetracementCurrently the price moves in the direction of sub-wave iii down. Next will be sub-wave iv up before finalizing with sub-wave v down to complete Sub-wave C of Wave 2 in circle.This is just my opinion. No trade recommendation based on this study. Do your own judgement.
AdamIdris2
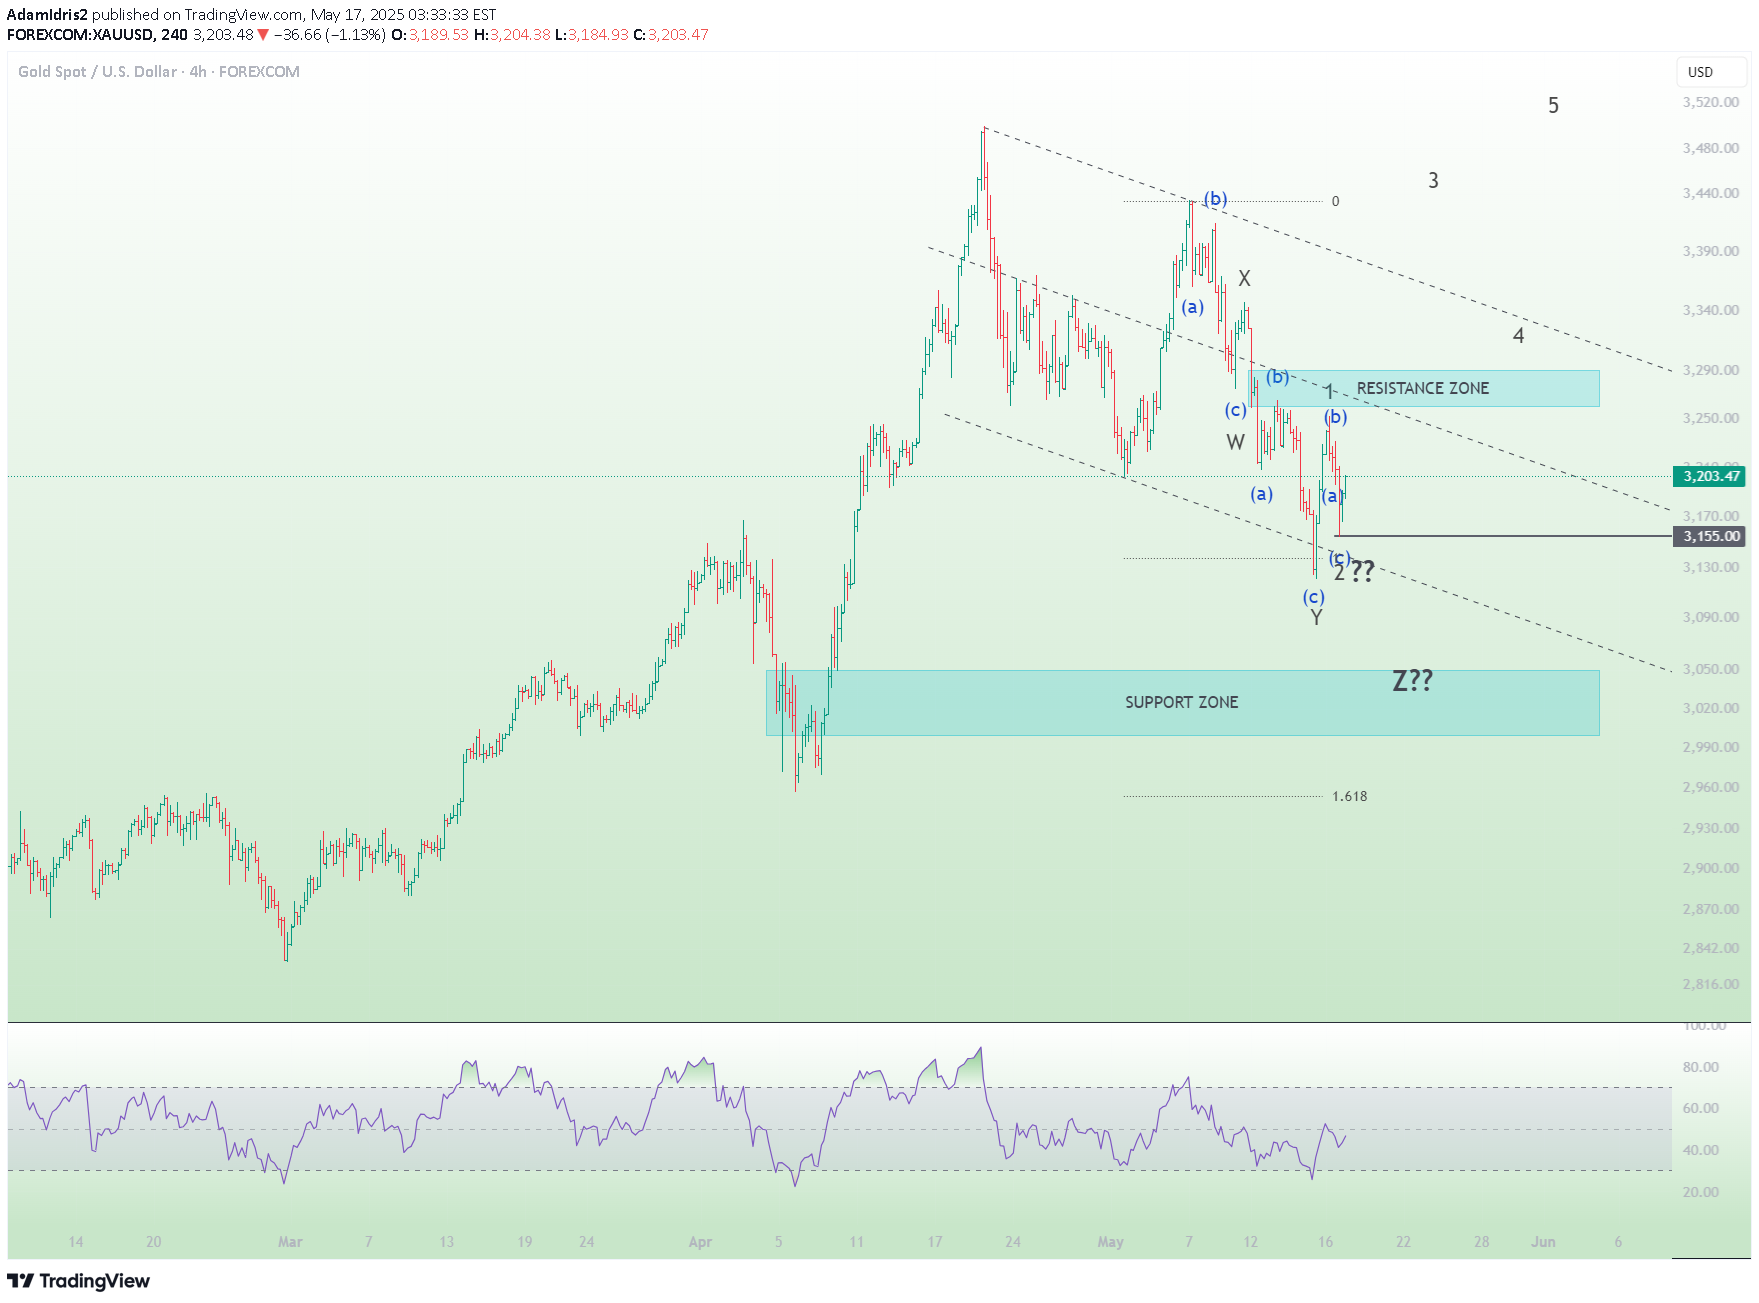
As of mid-May 2025, gold prices have experienced a notable decline, retreating from April's record highs above $3,500 per ounce to approximately $3,180. This downturn is attributed to easing geopolitical tensions, particularly the U.S.-China trade truce, and a strengthening U.S. dollar, which have reduced the demand for gold as a safe-haven asset.Technical Analysis: Short-Term OutlookKey Support Levels: Analysts identify the $3,155 level as a critical support point. A breach below this could signal further declines towards the $3,000–$3,050 range.Resistance Zones: Resistance is observed around $3,275–$3,287.85. A decisive move above this range may indicate a potential reversal or continuation of the uptrend.Indicators: The Relative Strength Index (RSI) remains in bearish territory, suggesting continued downward pressure. However, if gold maintains its position above the ascending channel's lower boundary, a rebound towards $3,450 is plausible.Fundamental Analysis: Medium-Term OutlookCentral Bank Demand: The People's Bank of China has increased its gold reserves for the sixth consecutive month, reflecting sustained institutional interest.Investor Sentiment: Despite recent corrections, gold remains up 21% year-to-date, indicating robust investor confidence. However, nearly 50% of fund managers surveyed by Bank of America believe gold is overvalued, which could lead to cautious trading behavior.Economic Indicators: U.S. producer prices fell by 0.5%, and retail sales stagnated, with inflation dipping to 2.3%. These factors may influence Federal Reserve policy decisions, potentially affecting gold prices.Forecast SummaryNext Week: Gold prices may test the $3,155 support level. A breach could lead to further declines towards $3,000. Conversely, holding above this level might prompt a rebound towards $3,275.Next Month: Analysts anticipate a consolidation phase, with gold trading between $3,000 and $3,300. Factors such as central bank purchases and economic data releases will play pivotal roles in determining the direction.
AdamIdris2
Trend: Major Trend : BullishMinor Trend : RetracementNote: Looking for the completion of Sub-wave C of Wave ii.This is just my point of view. No trade recommendation. Please do your own analysis before placing any trade. TAYOR.
AdamIdris2

Refer to the support and resistance level drawn on the chart; there are 3 possible scenarios that might occur.1. If the price breaks the resistance, it may continue the uptrend.2. If the price is still within the support and resistance level, it may continue sideways.3. If the price breaks the support, it may continue the downtrend.At this moment, there is hidden divergence appearing on XRPUSD as if it will strengthen the bearish mood. If the price breaks the resistance level, the hidden divergence will be cancelled.This is just my opinion. Not recommended to buy or sell.
AdamIdris2

Trend: Major Trend : BullishMinor Trend : RetracementNote:-Wave (1) completed with starting diagonal. Wave (2) possibly completed with ABC.Now price is moving up for Wave (3) with 5 sub-waves.This is just my point of view. No trade recommendation. Please do your own analysis before placing any trade. TAYOR.
AdamIdris2

Major Trend : UptrendMinor Trend : Downtrend (Retracement)Note: At this moment I still see the price structure as retracement to complete Wave 4. I don't know whether it's already completed or can go down further.This is only my EW view. Not recommended to trade based on this EW counting. Must do your own analysis prior to placing a trade.
AdamIdris2

Major trend: UptrendMinor trend: Downtrend or sidewayNote: Monitor the completion of wave IV.If the price break below the triangle, consider wave ‘e’ failed and need to recount. Probably the new pattern is expanded flat and final wave is wave C of Wave IV which consist of 5 minor waves.This is my EW counting and maybe wrong. No trade recommendation. Please do your own analysis.
AdamIdris2

Trend: Major Trend : BullishMinor Trend : RetracementNote: Here is my alternate EW counting for XRPUSD. If the ATH is considered Wave (III), then the current price movement looks like a triangle to form Wave (IV) in 5 abcde waves. Let's see whether the price is fluctuating in that triangle or not.This is just my point of view. No trade recommendation. Please do your own analysis before placing any trade. TAYOR.
Disclaimer
Any content and materials included in Sahmeto's website and official communication channels are a compilation of personal opinions and analyses and are not binding. They do not constitute any recommendation for buying, selling, entering or exiting the stock market and cryptocurrency market. Also, all news and analyses included in the website and channels are merely republished information from official and unofficial domestic and foreign sources, and it is obvious that users of the said content are responsible for following up and ensuring the authenticity and accuracy of the materials. Therefore, while disclaiming responsibility, it is declared that the responsibility for any decision-making, action, and potential profit and loss in the capital market and cryptocurrency market lies with the trader.