
ALSHIHRY
@t_ALSHIHRY

What symbols does the trader recommend buying?
Purchase History
پیام های تریدر
Filter
ALSHIHRY
آغاز صعود بزرگ: سهم AdEx پس از اتمام دوره تجمّع، آماده پرواز ۲۰۰ درصدی!
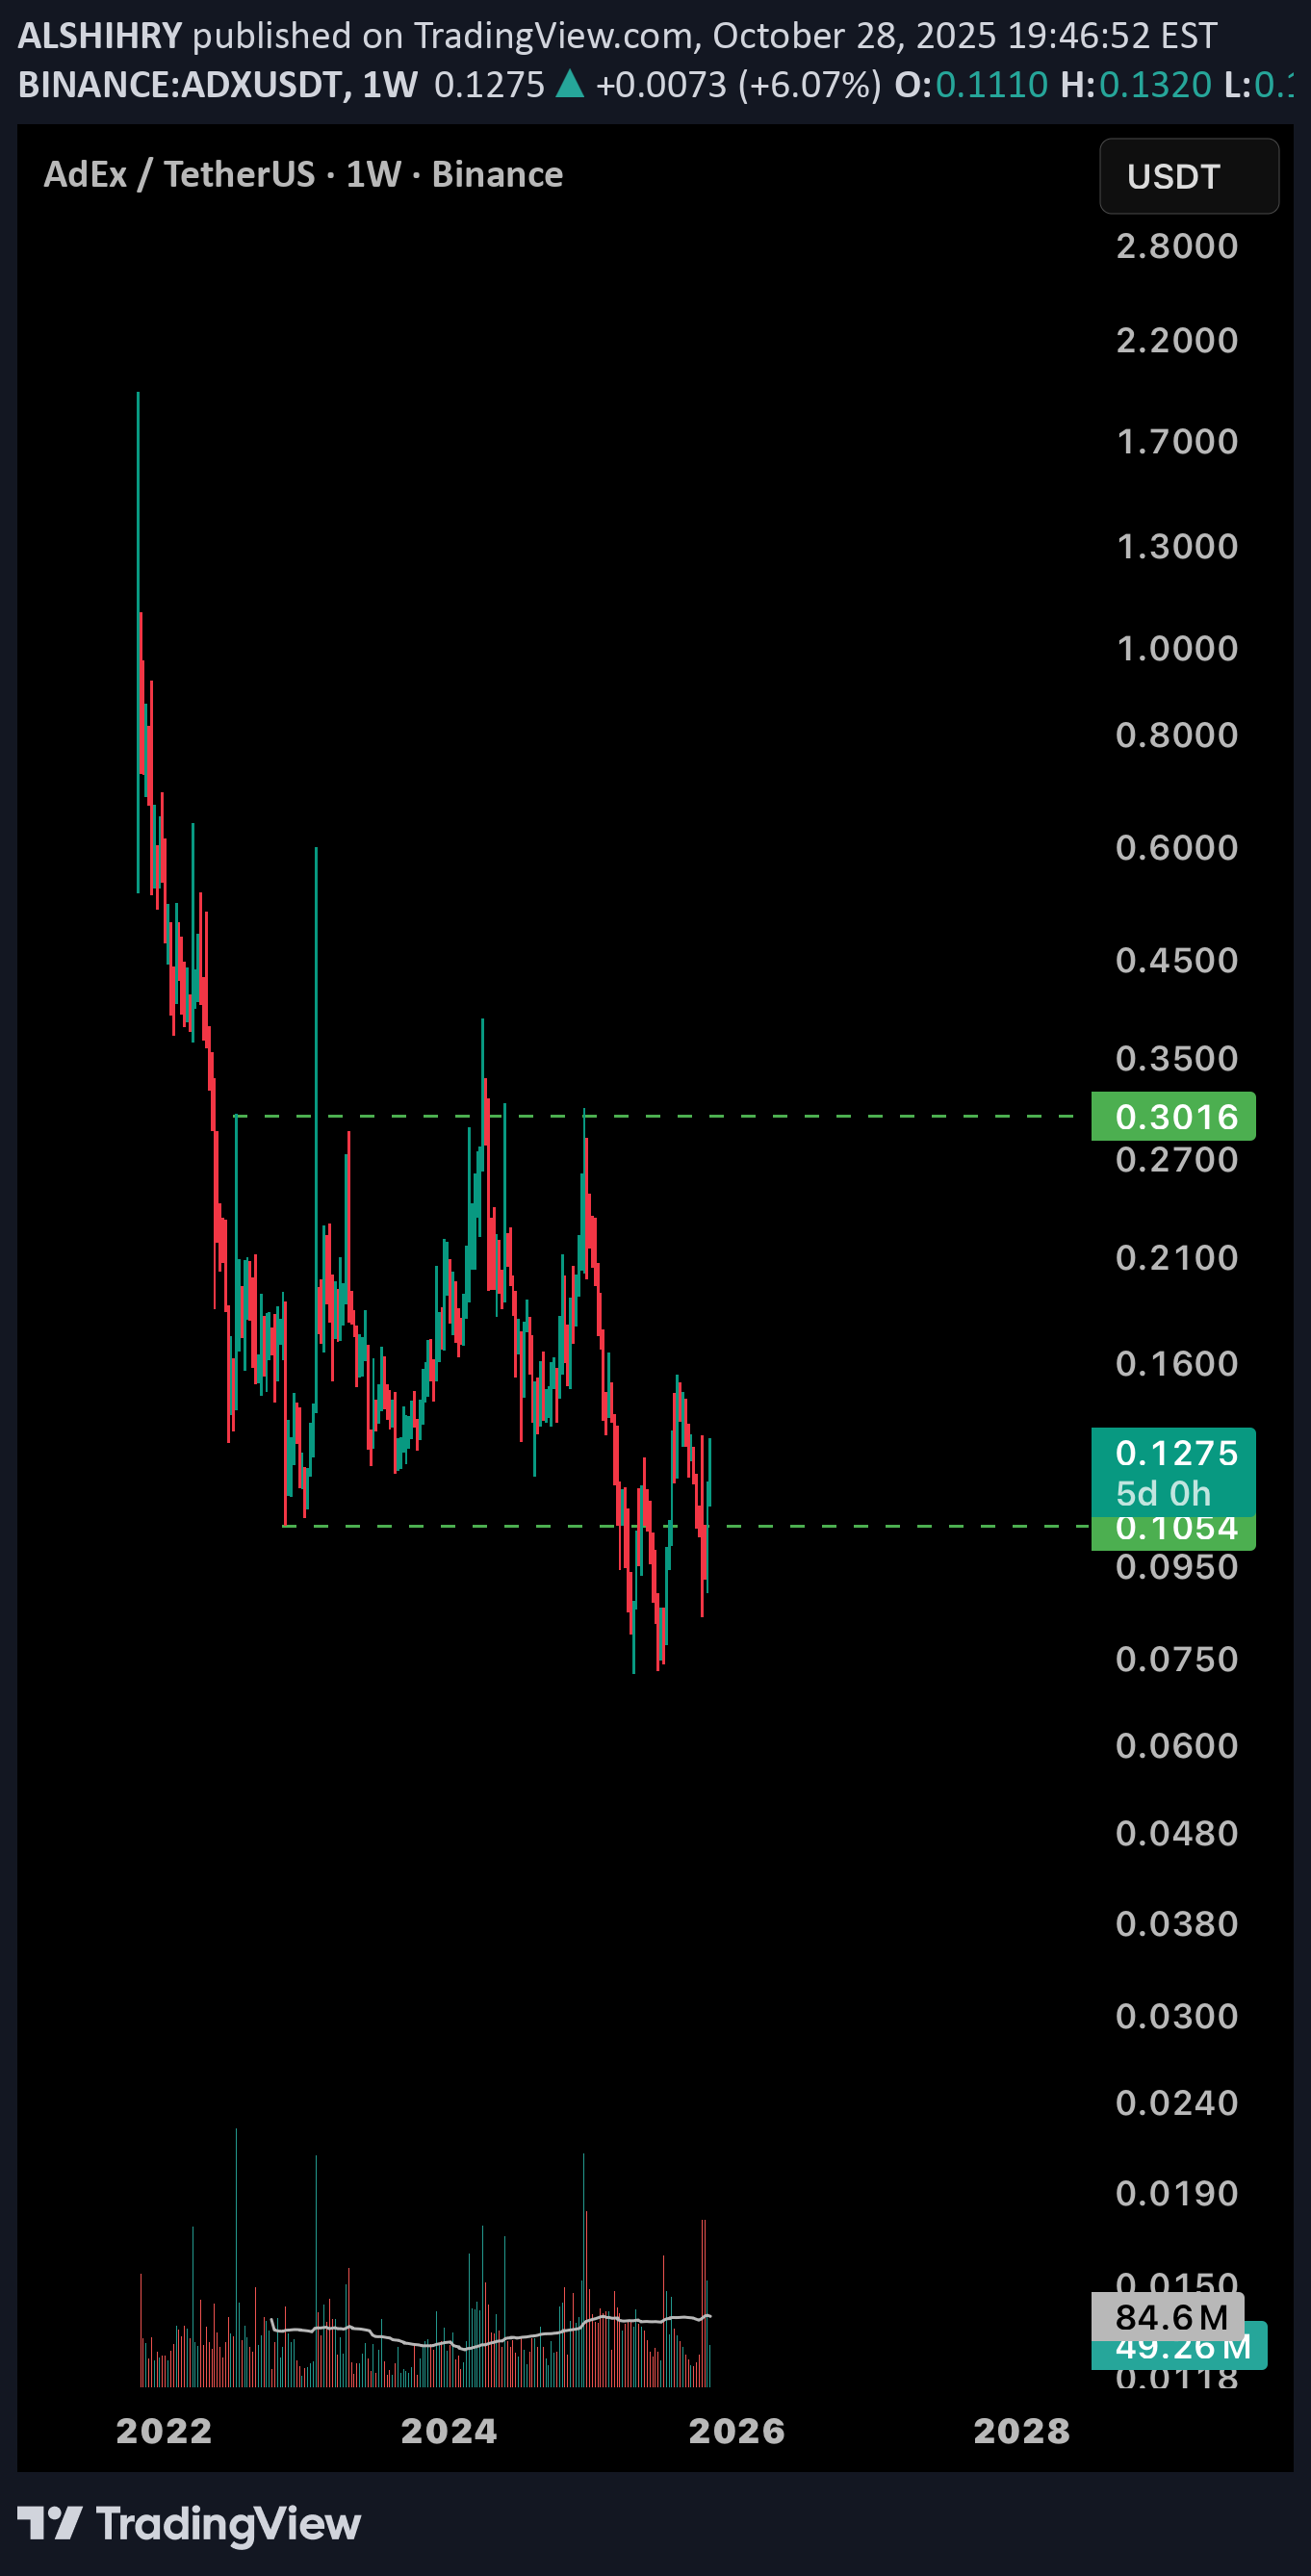
AdEx (ADX) has completed its Wyckoff accumulation phase, confirming a fully developed Spring (false breakout). The move was validated by the formation of a double-bottom pattern, highlighting the strength of the underlying base. The structure suggests a strong upside breakout is imminent, with a potential rally exceeding +200% as buying momentum and liquidity expansion continue to build.
ALSHIHRY
شکست مثلث و حرکت انفجاری قیمت: راز حفظ صعود در ۰.۱۸۸!

“We need a strong close above 0.188 to maintain bullish momentum. Volume confirmation is key. Targets remain promising — patience is everything. 📈”Within one month, all the targets are done 100 % 73 % 50 %
ALSHIHRY
HOTUSDT clusters

What we have in this point "We are at a strong support area on the higher timeframes, with a demand zone.A Butterfly harmonic pattern has appeared, and a breakout from the descending channel occurred.This situation calls for making a decision now and then patiently waiting for the targets to be achieved."
ALSHIHRY
descending channel

Breakout Above Can signal a trend reversal to the upside. I'm in
ALSHIHRY
Galausdt Wyckoff Eyes

On the weekly chart, GALA shows signs that may indicate:•Formation of a price base: The price is moving within a narrow range after a prolonged downtrend, suggesting a possible end to the distribution phase.•Increase in trading volume: Recent price rises have been accompanied by increased volume, supporting the idea of accumulation.•Resistance breakout attempts: The price is testing previous resistance levels, which may confirm a transition into a new phase.⸻📊 Technical Indicators•RSI (Relative Strength Index): Around 61, indicating bullish momentum without entering the overbought zone.•MACD: Showing positive signals with bullish crossovers.•Overall technical outlook: Suggests the potential continuation of the uptrend if current breakout attempts are confirmed.
ALSHIHRY
MOVRUSDT IS READY?

1. Bullish Scenario (Breakout to the Upside):•If the price closes daily above 5.60 or 5.80 with strong momentum, it would confirm a breakout from the descending channel.•The next potential target could be in the range of 6.20 – 6.50.2. Bearish Scenario (Rejection from the Upper Channel):•If the price fails to break above 5.60 and gets rejected from the upper trendline, it may pull back to test support levels around 5.00 – 4.85.
ALSHIHRY
AVAXUSDT Breaking descending channel

above 24$ we heading up channel with target more than 70%
ALSHIHRY
Wyckoff Accumulation

In Phase D of the Wyckoff Accumulation pattern, the key sign is strong price rallies aiming for the top of the channel.To confirm that we’ve entered this phase, we need two main things:1.A monthly close above the last resistance (now support)2.Low volume during pullbacks — this shows that sellers are weakIf the price breaks below the last swing low, the bullish outlook is no longer valid.But if it closes back inside the accumulation range, the pattern is confirmed, and that’s usually a signal to enter right away.We need to be patient — this is the stage where profits come, but only if you let the move play out.
ALSHIHRY

my idea on the Daily and 4H TimeframesOn the daily timeframe (left), we observe a breakout above a previous high-volume candle. From a classical technical analysis or price action perspective, this could be seen as a false breakout. However, in volume analysis, this is interpreted as a liquidity grab, potentially signaling the beginning of a strong move.On the 4-hour timeframe (right), the price has successfully broken above the high-volume candle and is currently in the process of retesting the breakout level, a key confirmation point before continuation.when you thin outside the box, you will see the light ELFUSDT Price Targets:•First target: +30%•Second target: +70%
ALSHIHRY

we need a daily close above 0.13 to achieve the target shown on the chart
Disclaimer
Any content and materials included in Sahmeto's website and official communication channels are a compilation of personal opinions and analyses and are not binding. They do not constitute any recommendation for buying, selling, entering or exiting the stock market and cryptocurrency market. Also, all news and analyses included in the website and channels are merely republished information from official and unofficial domestic and foreign sources, and it is obvious that users of the said content are responsible for following up and ensuring the authenticity and accuracy of the materials. Therefore, while disclaiming responsibility, it is declared that the responsibility for any decision-making, action, and potential profit and loss in the capital market and cryptocurrency market lies with the trader.