
newcomer
@h_newcomer

What symbols does the trader recommend buying?
Purchase History
پیام های تریدر
Filter
newcomer
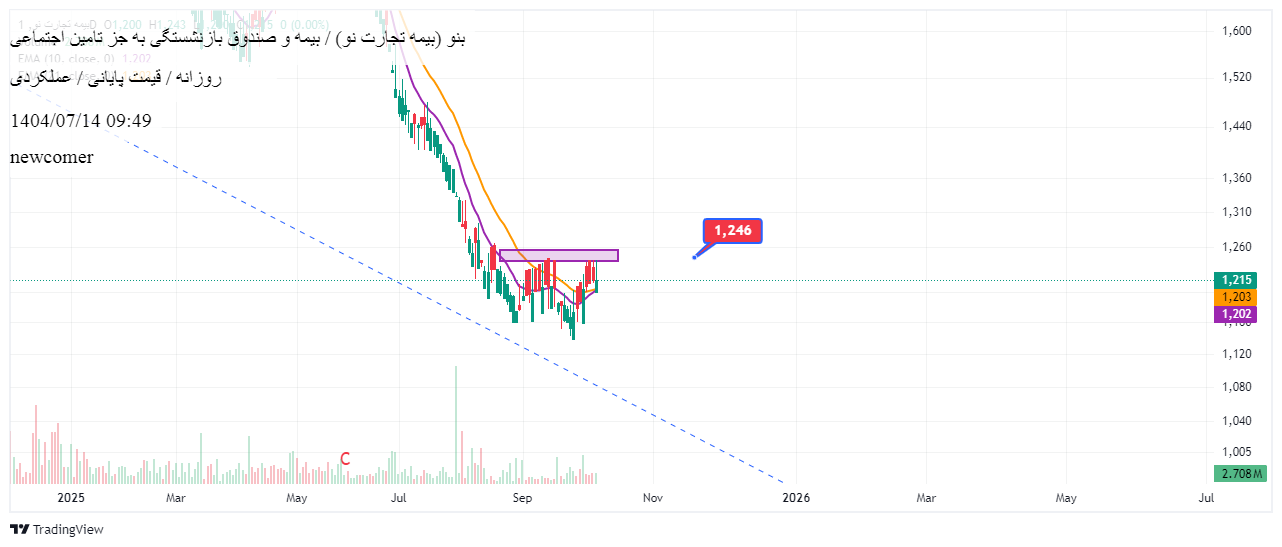
If it goes beyond the range of 125 Tomans, its climb is definite. That purple line has to reject the color of a money. Then move. It has excellent growth in the long run. Loss limit is exactly 113 Tomans
newcomer
Monthly diagram and starting a great long -term growth. Whenever it goes up to the bottom of the channel. The year 96 with fluctuations has grown by about 200 times by 1401. Now at the beginning of Wave 3 and the highest growth.
newcomer
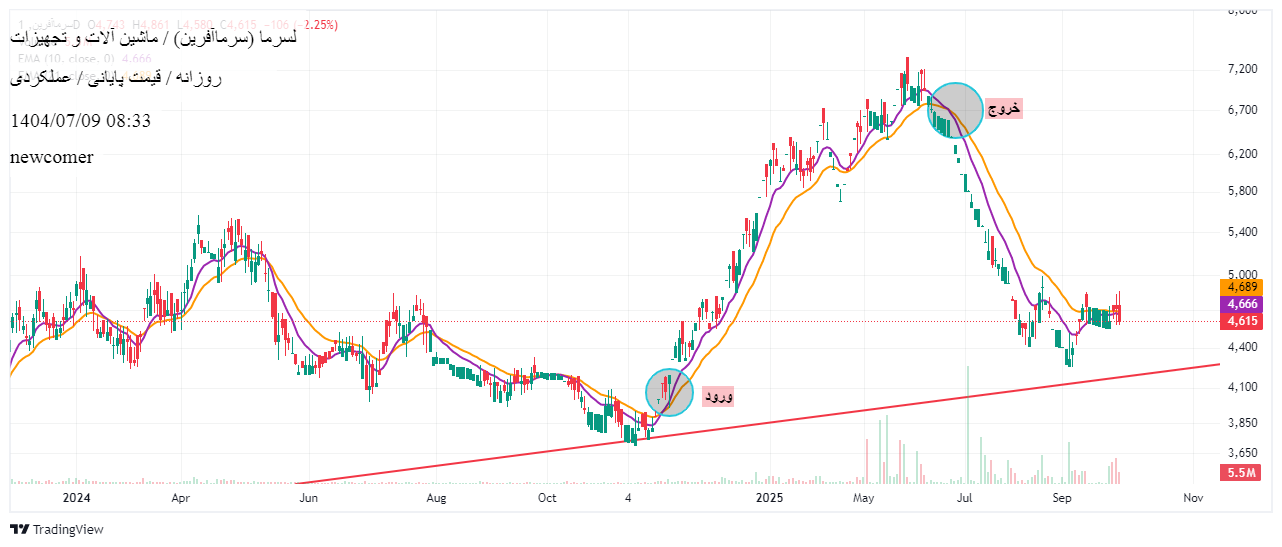
The best way to deal with this share is to use the diagram of 10 and 21 days. Whenever a 10 -day -up chart, buy a 21 -day chart, and whenever the 10 -day diagram fails the 21 -day chart. In the meantime, if you have a weekly chart of 100 and 200 weeks, you will always start climbing for nearly 200 weeks.
newcomer
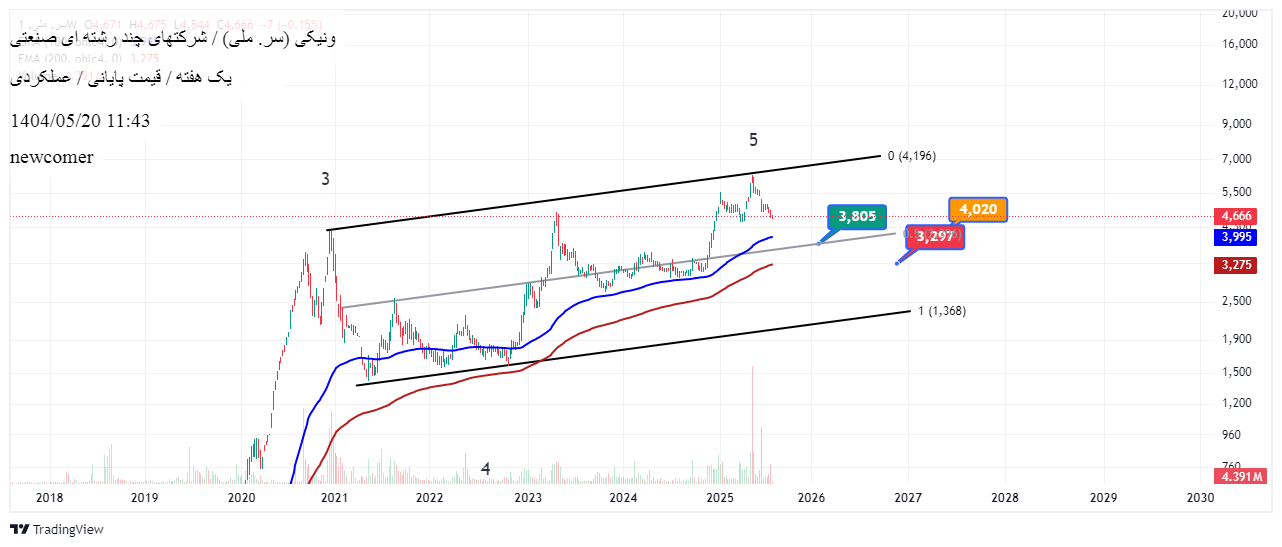
Venice has rarely been rarely under the average of 200 days and 100 days. As a result, these two average can be the simplest criterion for trading. You can buy 400 tomans according to the price chart. And of course, up to the average of 200 days, which shows 330 tomans. If we look at canalize, the current correction can reach about 380 tomans to the black channel. In total, between 380 and 400 tomans should be re -examined. Not currently decreasing and shopping. 3 -point Fibonacci also confirms the same points that are more accurate
newcomer

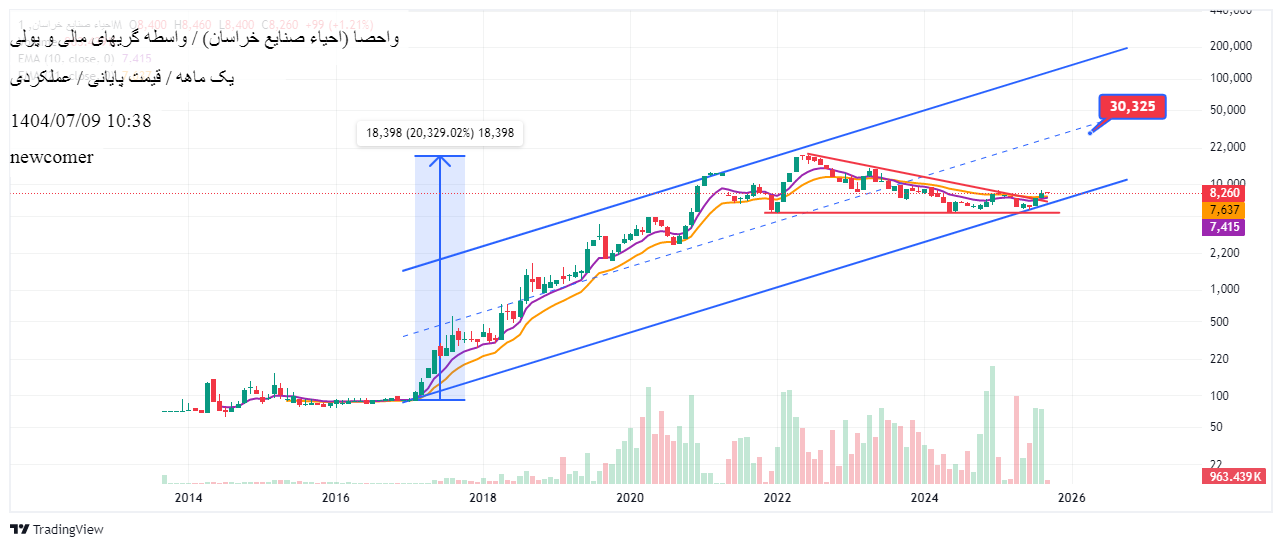
We are large in the middle of Wave 3, and the slope of the growth of the share has increased with excitement compared to previous years. Up to about 8600 Tomans, which can grow 1.618 percent, and share modifications are often compensated as quickly as the share is with a strong buyer. If you don't have to wait for reform, and if you have no worries for long -term and your powerful climb will continue. Observe the required loss. See the 10 -day and 21 -day averages, when it comes to sell under both of the 21 -day water lines and a 21 -day brick. See all the modifications of the past 3 years, finally a few percent and how long it was returned. The numbers are approximate and all of these are possibilities. The first goal: 8600 Tomans Average 10 days: 5300 Tomans Average 21 days: 4900 Tomans Bandy Limit limit: 4500 Tomans
newcomer

After almost 4 and a half years, we are now at the beginning of the long -term wave that can climb to blue targets (5300 tomans and 14 tomans). It has to grow in the middle of the day to a while above 390 tomans, which is the ceiling of 99. If they increase, these numbers will change. Loss of Disage and Stabilization below 145 Tomans
newcomer

We are big in the middle of Wave 3 and can be bought with any correction and now there is a growing place. Better than gold and property. Never had a sharp drop. Finally, 50% dropped in three sections. You can see a continuing upward ascending rally that is still up to a uptrend. The best place to buy is about 7600 Tomans to see if it comes. An average of 52% annually has a price growth provided you maintain long -term. If you go out in time and get 50% lower, this profit is even more profitable.
newcomer

Weekly time. We are modified in the middle of the uptrend Rally Wave 3. Wave 3 probably continues. We have to wait for the reaction to the channel's Midline of about 3300 tomans (black line). If it breaks it will go to the bottom of the canal, which is about 2400 tomans.
newcomer

When climbing time
newcomer

We are at the end of the correction and at the beginning of Wave 5. You should not go down from 99 tomans. Fibonachi saw 78% at the price of 133 Tomans and moves for the same purpose
Disclaimer
Any content and materials included in Sahmeto's website and official communication channels are a compilation of personal opinions and analyses and are not binding. They do not constitute any recommendation for buying, selling, entering or exiting the stock market and cryptocurrency market. Also, all news and analyses included in the website and channels are merely republished information from official and unofficial domestic and foreign sources, and it is obvious that users of the said content are responsible for following up and ensuring the authenticity and accuracy of the materials. Therefore, while disclaiming responsibility, it is declared that the responsibility for any decision-making, action, and potential profit and loss in the capital market and cryptocurrency market lies with the trader.