
mk990909
@h_mk990909

What symbols does the trader recommend buying?
Purchase History
پیام های تریدر
Filter
Signal Type
mk990909

What everyone sees is the green channel and hope to cross the 2250 AD. What I see is the blue channel that is consistent with both its technical negative divergence and fundamental conditions. This analysis (ie, from the viewpoint) is invalid when it is rejected by 2.300 AD and the money to the dynamic resistance (blue canal) and move toward higher targets. Basically (ie, investing), conditions change when: 1- The price of global commodity growth 2- Exports of industries other than oil boom 3. The exchange rate of the export industries has a short distance from the free market 4- Yuan's equality rate against the dollar lift And how many things to stay
Rahavardmk990909

It was almost a month ago when I put this chart and anticipated a short -term trickery pattern. Although Kendell closes tomorrow and we can fluctuate next week, it is likely to be more pressure tomorrow due to next week's holidays. Technically, the negative trend of money flow rates and the volume of trading at the chart is clear. More simple, money is not big or the stock market is not. So probably the first goal of the Terry Drive was about 2.100 AD. During the market, the market grew due to the index of instruments and the lack of a strong seller due to the holidays, but the chart is now showing the corrective process. But why? This year, 350 steps are expected to finance the capital market at about 30 % of the capital market. That is, banks, especially stock banks, provide it. These securities are distributed around the tower 4 and are guaranteed by banks with one -year maturity (ie tower 12) by banks. This is about twice as much as last year's papers. About 70 efforts were performed last year, and this year we have to see how much it is. However, if all 350 efforts are provided with 30 % profit from the capital market, the bank's stock sales pressure will increase and reduce about 130,000 units wherever it is. There are, of course, other macroeconomic points that are not necessary here. This is a personal view of interaction and it is responsible for buying and selling anyone.
Rahavardmk990909
In the adjusted chart, the support of 1600 Rials can be seen. The 98-day money flow rate of this stock has not been lower than 39 so far. A positive divergence is also evident in the 14-day money flow rate. I think you can buy a staircase from this price up to 1600. I don't think it will be less than 1600.
Rahavardmk990909

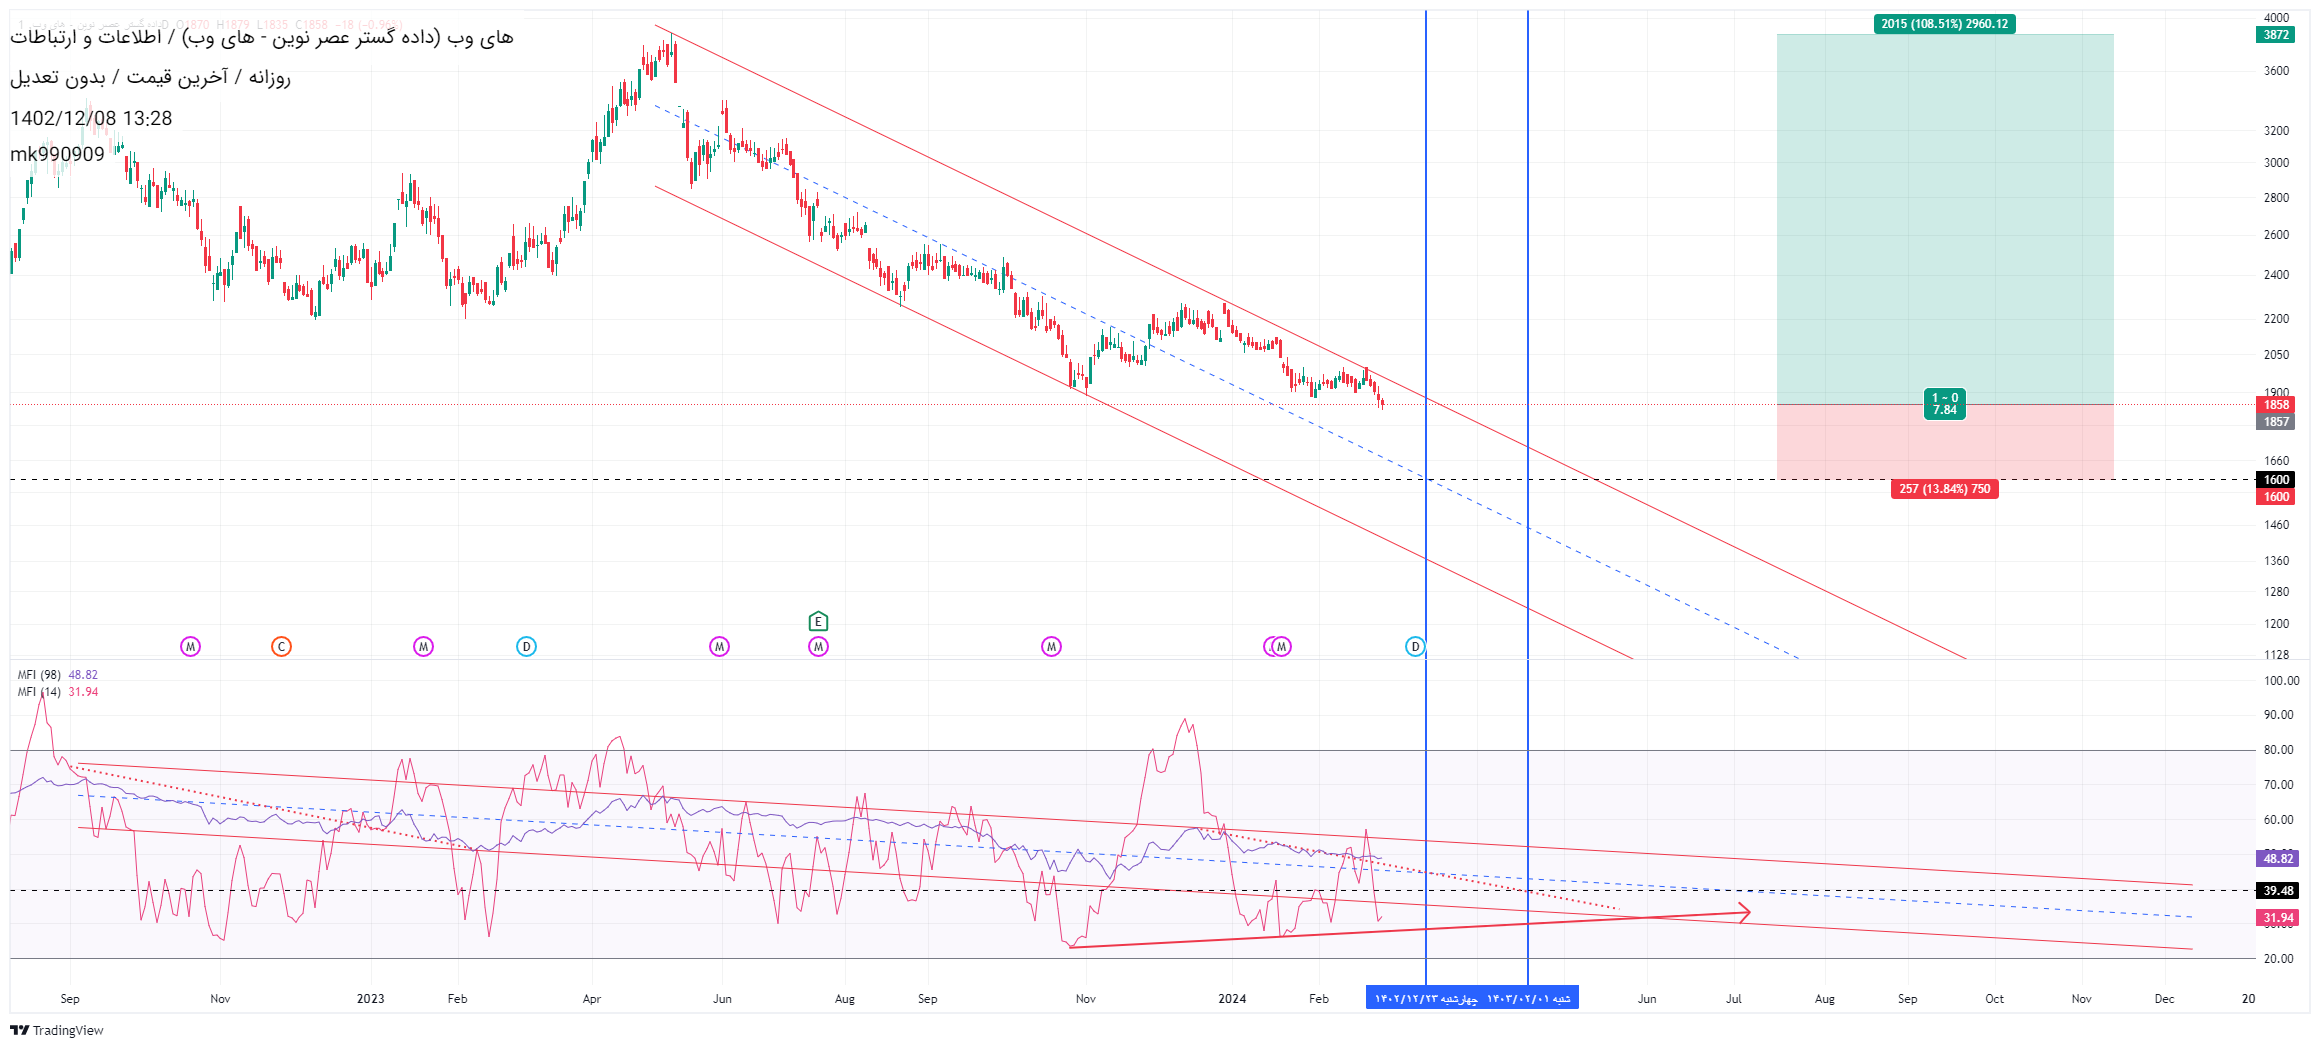
There is no doubt that the long-term market trend is bearish or at best suffering. Therefore, I have shown the guidance lines in the chart to indicate that the 1.8M target is still valid. Fundamentally, the process of making profits and selling index-making industries is still in a state of stagnation. But the long-term downward trend does not mean the absence of upward swing. Whenever the monthly trading volume is less than 60B, weekly less than 10B, and daily less than 2B, the phase change in the downward price trend has started. Therefore, my view is an upward swing to 2.280 m and then a price correction to 1.8 m. In this upward fluctuation environment, the symbols that have made a proper correction and are seasonally on the threshold of sales growth have a better situation to fluctuate. The loss limit of the total index is still preserved in the range of 2.050 to 2.030 and it is possible that we will have a negative range this week before the upward swing.
Rahavardmk990909

My impression is that it will reach the targets of 5500 and 9000. With a loss limit of 3700.
Rahavardmk990909
Gedna will either go down and its price will be halved or it will go up. I think he will go with his head. Of course, the loss limit is 6000 rials.
Rahavardmk990909

Keller's chart has a hidden positive divergence from the OBV. In the adjusted weekly chart, it is at the bottom of the long-term dynamic support. Most of the profit making of this share is in the second and fourth quarter of every year. Usually, the price fluctuation is maximum for the 3rd tower. I think it can reach the targets shown in the chart up to 60,000.
Rahavardmk990909

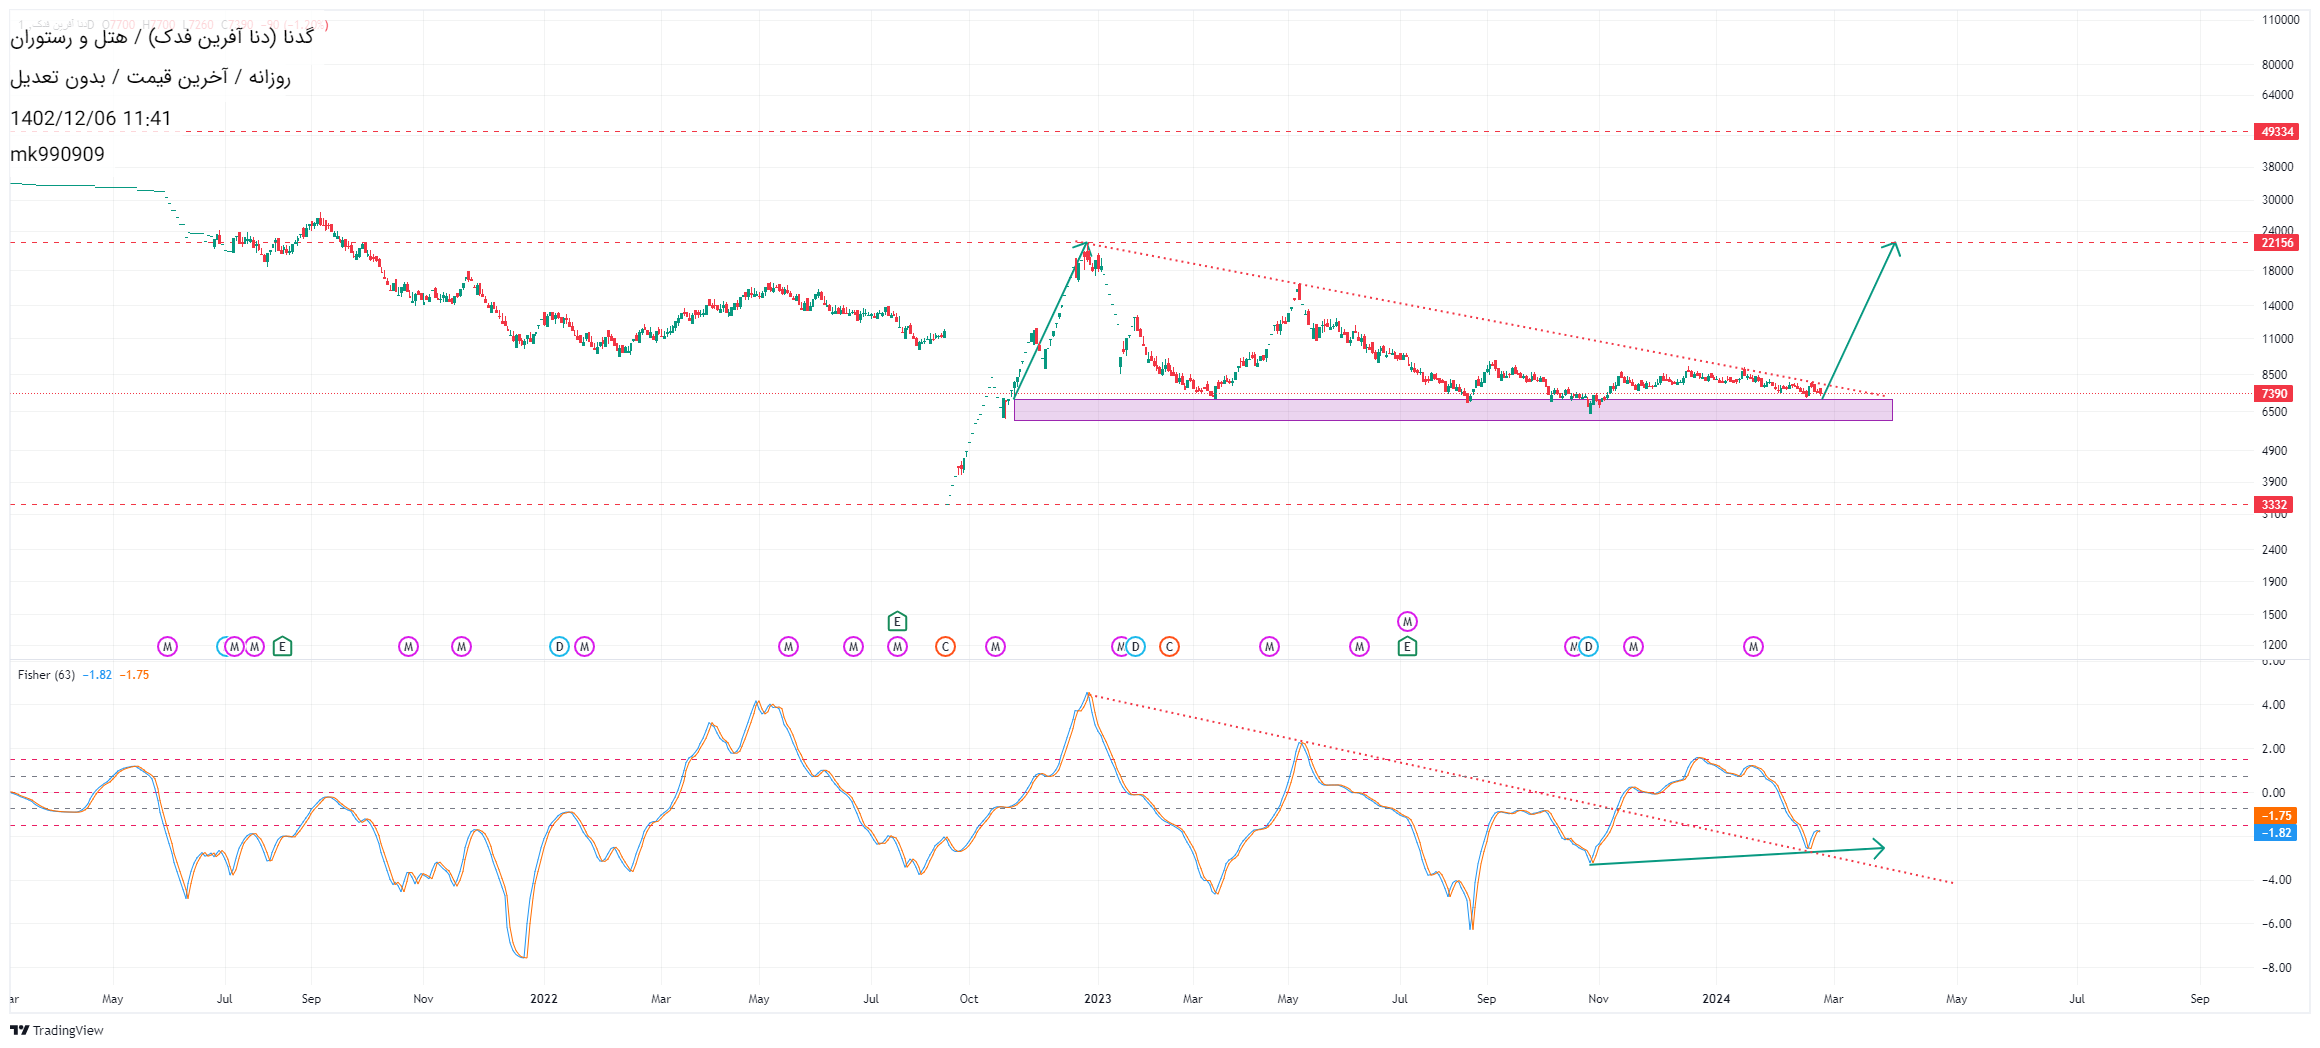
This share has a good purchasing power behind it (real purchasing power is about 12). Its 9-month profitability this year is better than 9 months last year. Its seasonal profit growth for the first and second quarter of the year is ahead. Therefore, in my opinion, price growth should reach 22,900, 28,800 and 38,500. Although around 22900 is suitable for saving profit. Weekly positive divergence is also in the chart. Of course, the signal has not yet entered, but I think a staircase can be entered.
Rahavardmk990909

The indicator is in an important position. A condition that is simultaneously on dynamic and static support. The Elder Force indicator (with corrected values) also shows that it stands above the zero line in 90% of the time and clearly shows a hidden positive divergence. In the conditions of closed indicators like Femli and Shepna, minerals like Kegel and Kechad can raise the index alone. I think sooner or later we should see a positive fluctuation. If both dynamic and static support breaks, the index will probably go up to 1.8m, although not for a long time. At least in terms of modified Eldar power, 10% of the time this indicator remains below the zero line. All symbols performed the same in this condition. It is necessary to observe the limit of loss and caution.
Rahavardmk990909

The spread chart is on support, has a positive divergence, has good volume, and has a twin bottom pattern with a target of 22,000. I hope the next process will confirm this.
RahavardDisclaimer
Any content and materials included in Sahmeto's website and official communication channels are a compilation of personal opinions and analyses and are not binding. They do not constitute any recommendation for buying, selling, entering or exiting the stock market and cryptocurrency market. Also, all news and analyses included in the website and channels are merely republished information from official and unofficial domestic and foreign sources, and it is obvious that users of the said content are responsible for following up and ensuring the authenticity and accuracy of the materials. Therefore, while disclaiming responsibility, it is declared that the responsibility for any decision-making, action, and potential profit and loss in the capital market and cryptocurrency market lies with the trader.