
alimobarak
@h_alimobarak

What symbols does the trader recommend buying?
Purchase History
پیام های تریدر
Filter
Signal Type
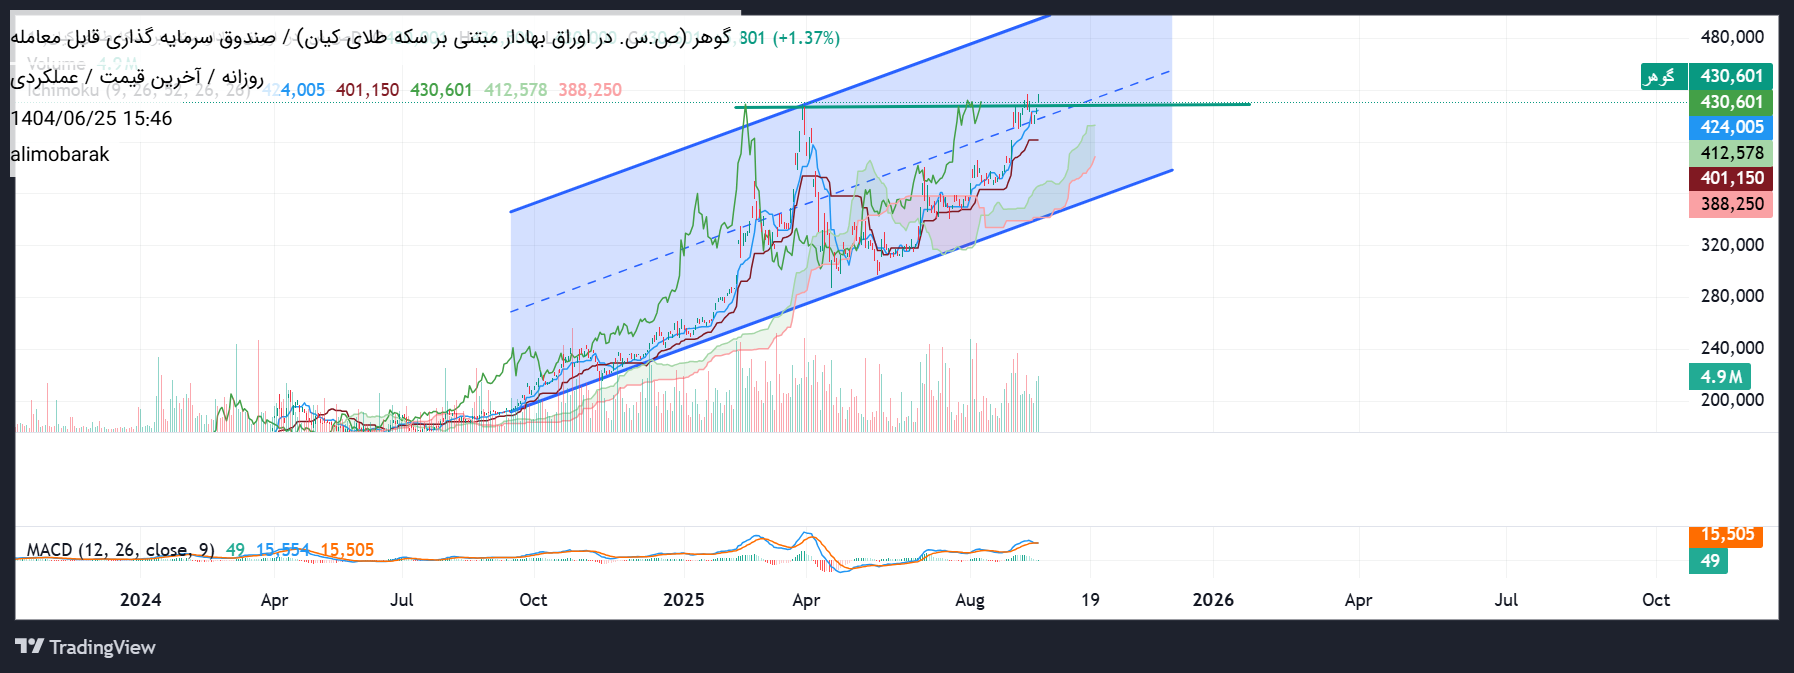
The technical analysis of the Gohar Gold Fund chart shows that the price trend in the last year has been associated with positive fluctuations and strong performance, and recent support and resistance areas have been created for traders. • One -month and three -month return: The fund has grown by 15% over the past month and 32.6% in the last quarter. Trends • From April 26 to June 6, the fund experienced a 17 % fall and took about five and a half months to return to the initial price. • Recent fluctuations show that the price of the fund is moving in coordination with the world gold fluctuations and the Iranian dollar, and especially the days when there is a positive price bubble, traders should be cautious. • Technical indicators of reputable sites show that current transactions are mainly close to the intrinsic value of the fund (NAV) and there is no signal of divergence or severe exit signal. • General trend: An ascending with short -term fluctuations is still evaluated, but any achievement of the main resistance levels or passing support can be a redirection signal. • Trading targets: Price passing through the first resistance is a sign of continuing growth, and falling to the second support was a sign of increased caution in the purchase. Overall, medium -term Gem Gold Gold Fund units still have the potential to grow and risk management is recommended based on support and resistance levels.
RahavardDisclaimer
Any content and materials included in Sahmeto's website and official communication channels are a compilation of personal opinions and analyses and are not binding. They do not constitute any recommendation for buying, selling, entering or exiting the stock market and cryptocurrency market. Also, all news and analyses included in the website and channels are merely republished information from official and unofficial domestic and foreign sources, and it is obvious that users of the said content are responsible for following up and ensuring the authenticity and accuracy of the materials. Therefore, while disclaiming responsibility, it is declared that the responsibility for any decision-making, action, and potential profit and loss in the capital market and cryptocurrency market lies with the trader.