agah3365
@h_agah3365

What symbols does the trader recommend buying?
Purchase History
پیام های تریدر
Filter
Signal Type
agah3365
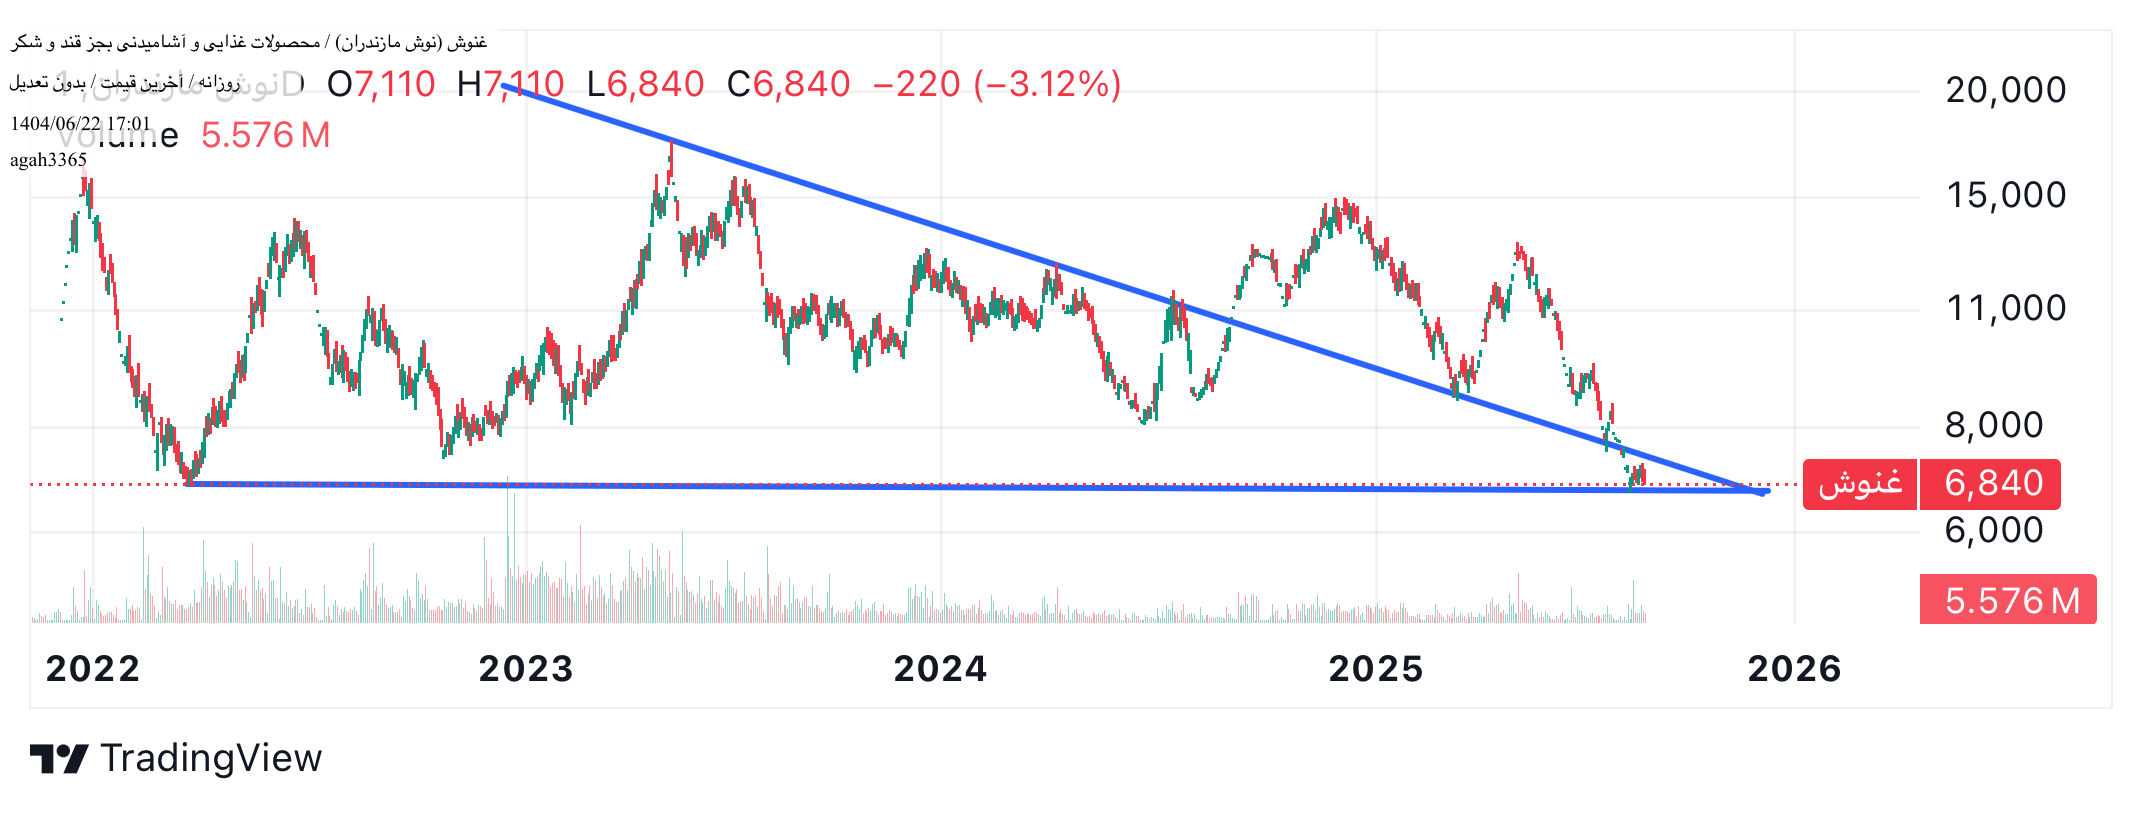
Good time friends Logarithmic chart The share is at the end of the triangle corner, and to begin the uptrend, one must first cross the dynamic descending line and break the line, the growth of the share can begin. Slide this line of downtrend from the last peak to the static support line. I think and other friends here can be the best shopping point, of course, technically, or else the actor's game does not know. This share of stocks can be considered by the code before the code share the code to their real codes and codes. Friends tomorrow, first and foremost, the volume of trading should be registered compared to the previous days, especially the previous month, which means the positive thing is to buy the best support point. If you intend to buy or reduce average, be sure to buy a step Selling your share at this point and in this wrong price Thank you for your attention Be profound
Rahavardagah3365
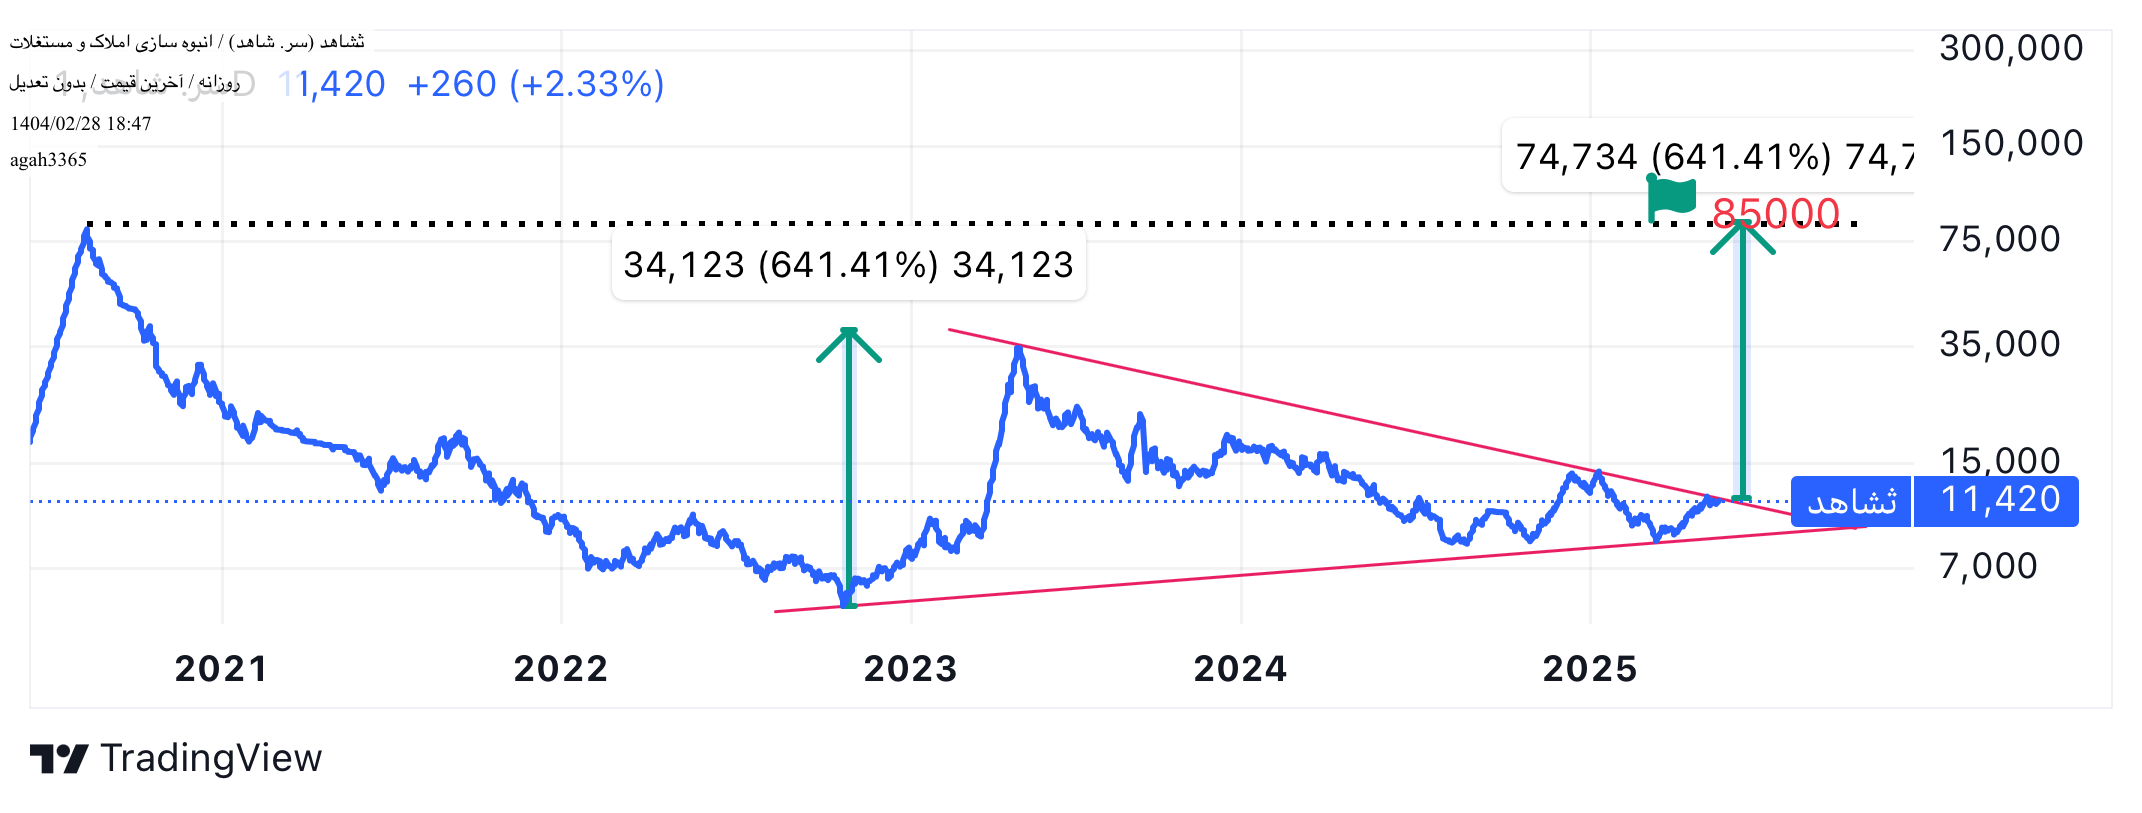
Hi dear friends Logarithmic chart Daily frame time One of the most widely used patterns of technical analysis is an incremental symmetrical triangle that, as you can see in the analysis, is being built at this pattern and is at the end of the triangle and tomorrow it can be reduced by the power of this dynamic process. Friends will not be confirmed until this resistance line is broken up. If you intended to buy or add stocks after breaking the line in the coming days at the time of money to buy When the line of transactions is crossed and broken, the volume of transactions increases tomorrow's volume of transactions tomorrow I specified the goal of growing price in the medium term in these patterns with a flash mark Thank you for your attention Be profound
Rahavardagah3365
Hi dear friends Logarithmic chart Daily frame time The code icon has passed through his own dynastic process And the negative today is the share to complete the money on this line If the share of the market was supported in the morning and came from negative to positive or to the queue, you will know the actor's intention was to complete and carry out the money -free process. The first support is 5800 USD if modified Thank you for your attention Be profound
Rahavardagah3365

Hi dear friends Logarithmic chart Daily frame time Today, despite the high power of the buyer than the seller and $ 1.5 billion in share The actor offered the shopping queue If you see the technique of Zedasht, it has been overwhelmed by its dynamic resistance line and right on the line. (Open the chart right on the image. If the market is positive tomorrow, if the queue was to know, the actor is working. I will not see much of the share if the queue was not the possibility of correction up to 1 in the first move and if the market falls in the coming days, the ultimate correction will be 3000 Tomans. Not buy and sell Be profound
Rahavardagah3365

Hi Logarithmic chart Daily frame time We are not satisfied to the harm of someone. If the actor agrees and reforms, if the intention is to have this pattern, it will have twelve to fall. Be careful not to get stuck. Be profound
Rahavardagah3365
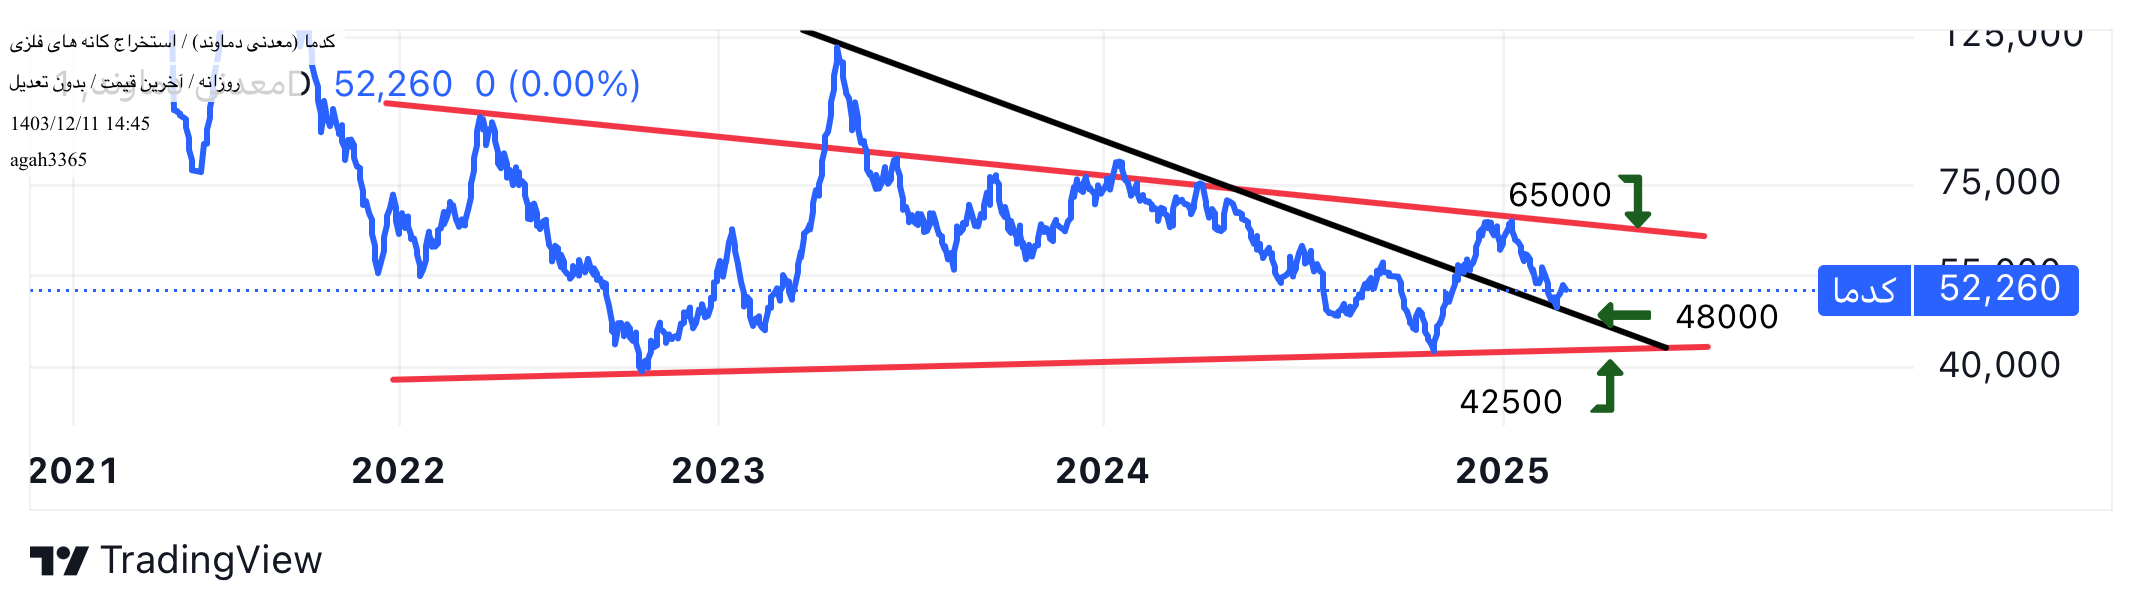
Hi Good time friends Logarithmic chart Daily frame time The long -term chart of the code you see in the picture passes through its black descending line, and the money is made to the sub -black line and will be supported. In the event of a war or bad news, the symbol of the red support trend can fall, which you know, given the growth of the dollar and the conditions of the region we see, the likelihood of such a slump is very low. And lastly, if the market situation and the growth of stocks want to start its own sharp movements, it must first cross the resistance line and price, and then the main share of the share occurs. Thank you for your attention Be profound
Rahavardagah3365

Hi Good time friends Logarithmic chart Daily frame time Share in a downtrend moving channel Price reaction to the black uptrend in the channel colored in the symbol of dynamic support in the symbol As you can see, the low price is of no particular price and it will be the end to the price of two hundred tomans, which I am unlikely to know. The status of the indicators is not good and reform Today had nearly six billion of these symbols of money entry Move this share after breaking the channel resistance line after crossing the price of 235 USD Today's fall was a technically collided with the resistor of the Moying Origra EMA indicator, which in the picture characterized that is not a concern In my opinion, this is not a more positive actor's mischief to collect the share Or can be code to legal code before climbing Because the three -day company is the Financial Development Group From that four -day Arya City Service Institute is buying Inside the coding you can view the major shareholder In any case, do not worry about the share of the game, according to the last analysis Thank you for your attention Be profound
Rahavardagah3365

Hi Good friends time According to the analysis I had on this page yesterday, the end of the money was on the downtrend line. Yesterday I said that the type of candle that is formed at the end of the market in the Bank Di icon. The red hammer candy formed right on the downtrend line, indicating the end of the correction Although the red hammer candy is a weaker purchase signal than the green hammer candlestick again indicates the upward price of the price Overall Tomorrow Bank Transactions, although the status of the indicators is not yet ready for climb, it depends on the marketplace of the market that is either low -line or can be a balanced price on the process of a couple of days and, as the famous saying is, is ready to grow for growth. Thank you for your attention Be profound
Rahavardagah3365

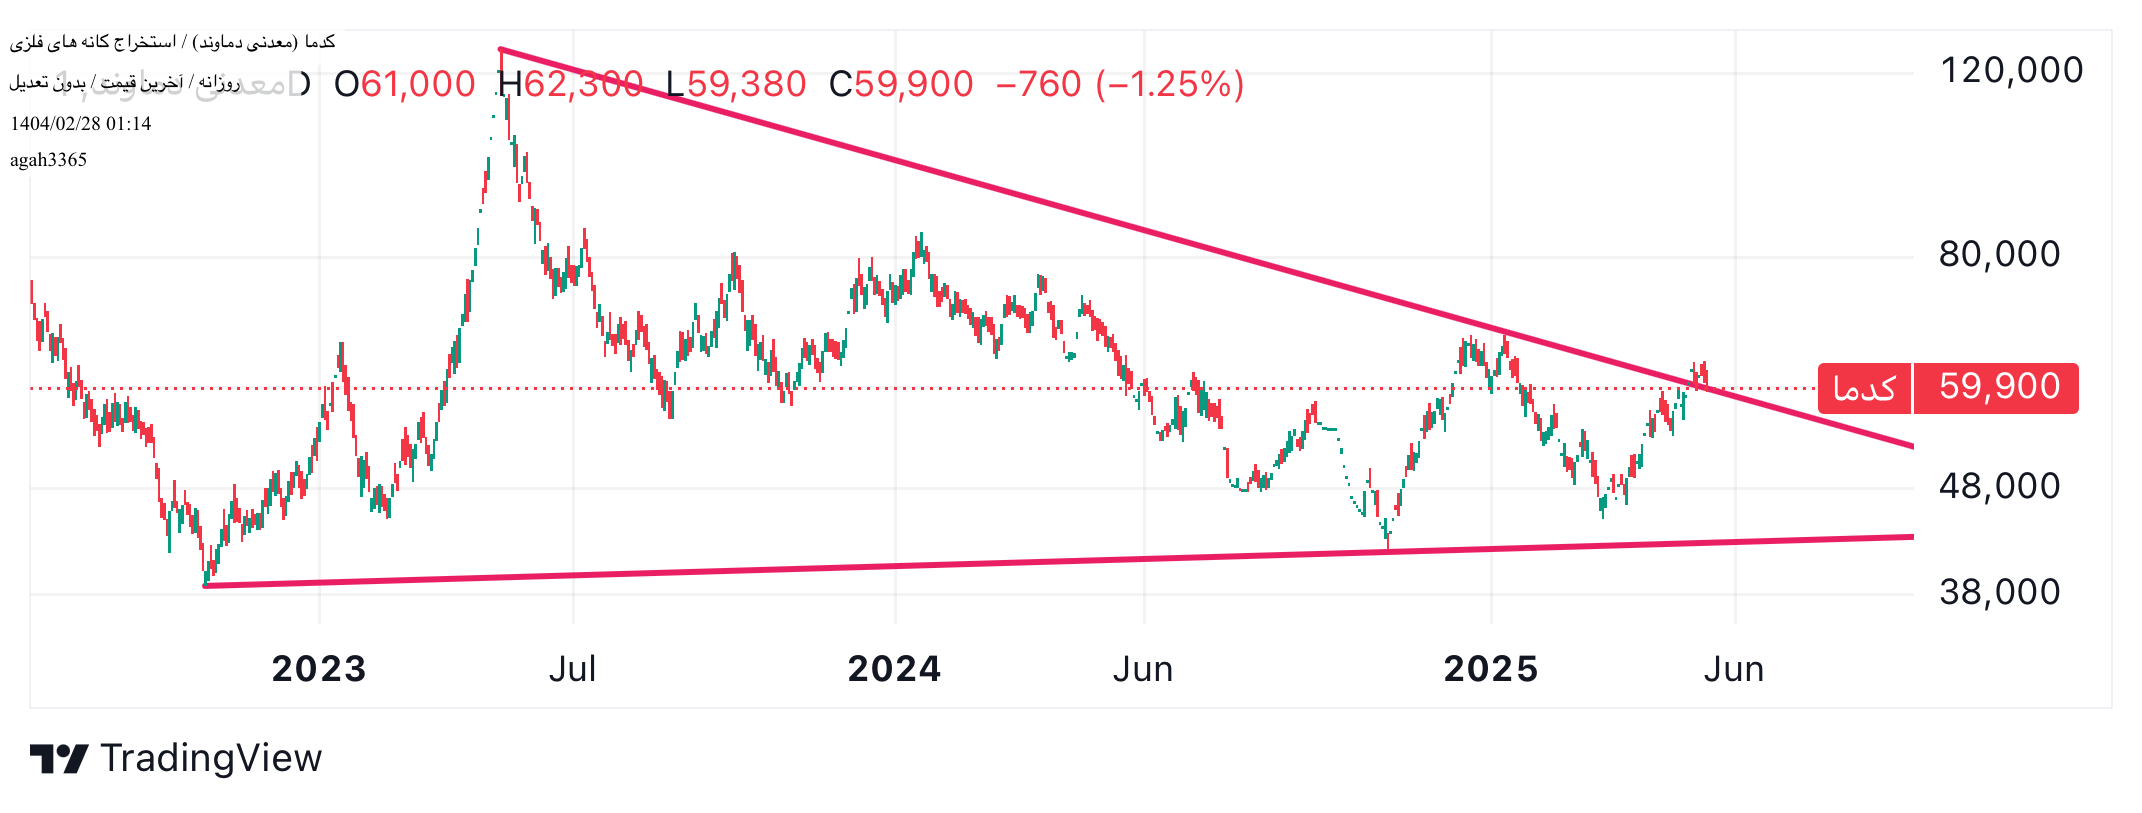
Hi Good friends time As you can see in the picture, the share at the end of the triangle's corner has gone through its downward trend line and is completing the money in the downward trend line. Tomorrow can be the last day of sharing correction Notice the type of candle that will be made tomorrow or tomorrow, as well as purchasing and legal support
Rahavardagah3365

Hi Logarithmic chart Daily frame time As you can see in the chart, a share on an upstream channel with the support and dynamic resistance is moving. At the bottom of the channel, the contribution was supported and a meeting queue for loved ones who intended to reduce the average of a good opportunity To reach the first targic I specified by the flag mark (which is both the Midline Channel line and the resistance marked with the blue dotted line), must first pass through its black descending line. Thank you for your attention Be profound
RahavardDisclaimer
Any content and materials included in Sahmeto's website and official communication channels are a compilation of personal opinions and analyses and are not binding. They do not constitute any recommendation for buying, selling, entering or exiting the stock market and cryptocurrency market. Also, all news and analyses included in the website and channels are merely republished information from official and unofficial domestic and foreign sources, and it is obvious that users of the said content are responsible for following up and ensuring the authenticity and accuracy of the materials. Therefore, while disclaiming responsibility, it is declared that the responsibility for any decision-making, action, and potential profit and loss in the capital market and cryptocurrency market lies with the trader.