
StartTrading
@h_StartTrading

What symbols does the trader recommend buying?
Purchase History
پیام های تریدر
Filter
Signal Type
StartTrading

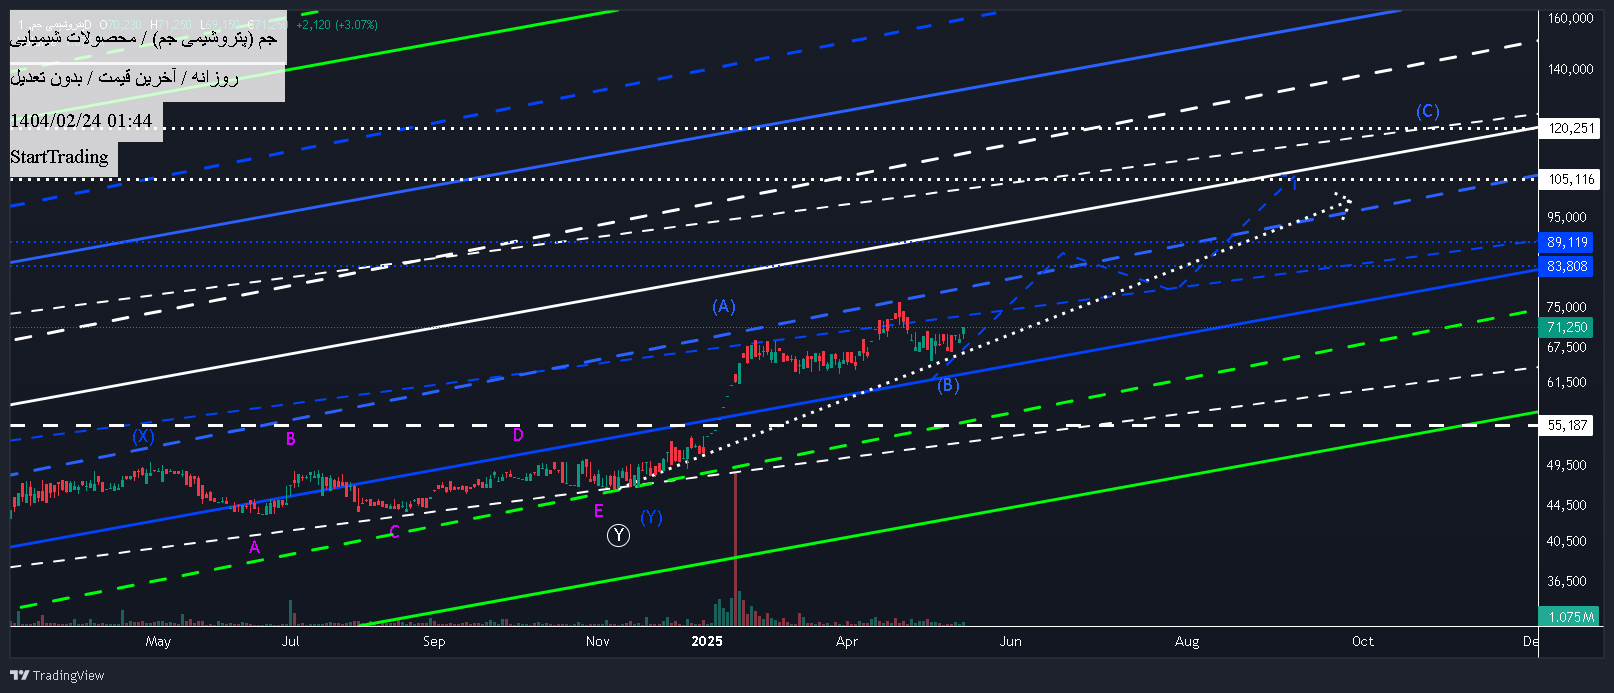
This image shows long -term targets by the end of the year (probably by the end of the fall to 1 to 2 Tomans) and a 5 -year share. Given the risk of investing in the wave floor and being fundamental, it can be an ideal investment option
RahavardStartTrading

The primary purpose of this share is the wave ceiling of the plate, which is 1 to 2 Tomans In terms of wave, we are at the best shopping point for this share, which makes the price of this share in the next 5 years of explosive growth in the next 5 years. **** Next Post Analysis in Time Frame above
RahavardStartTrading

اصلاح سهام ایران خودرو از سال ۱۳۹۹ تا کنون، درگیر یک اصلاح ترکیبی بوده است: ابتدا یک الگوی متقارن (از تابستان ۱۳۹۹ تا پاییز ۱۴۰۱) و سپس یک الگوی مثلث (از بهار ۱۴۰۲ تا زمستان ۱۴۰۳). با توجه به این تحلیل، به نظر میرسد اصلاح ایران خودرو در زمستان گذشته، در محدوده قیمت حدود ۴۰ تومان به پایان رسیده و پس از آن، شاهد آغاز یک روند صعودی جدید بود. صعود از ۴۰ تومان تا ۷۲ تومان در ۱۷ اردیبهشت امسال، در قالب موج A رخ داده است و حرکت از ۷۲ تومان تا به امروز، به عنوان اصلاح این موج تلقی میشود. توضیح مهم: از نظر قیمتی، این اصلاح میتواند تا محدوده ۵۰ تا ۵۵ تومان ادامه یابد. هرچند، با توجه به رسیدن به خط میانی کانال، احتمال حفظ محدوده ۶۰ تومان نیز وجود دارد. با این حال، صعود تا محدوده ۱۰۰ تا ۱۲۰ تومان در قالب موج C قطعی به نظر میرسد. از نظر زمانی نیز، احتمال ادامه این اصلاح تا هفته سوم خرداد ماه وجود دارد.
RahavardStartTrading

با فرض حفظ حمایت در سطح ۱۴ هزار تومان، حداقل انتظار صعود برای این سهم تا ۲۰ هزار تومان وجود دارد. این تحلیل بر چند دلیل استوار است: اولاً، قیمت سهم در هر دو بازه زمانی هفتگی و روزانه بالاتر از ابر ایچیموکو قرار دارد. ثانیاً، اصلاح موج قبلی از نوع پیچیده و زمانبر بوده است. ثالثاً، بر اساس موجشماری، سهم احتمالاً در موج ۳ کوتاهمدت و میانمدت قرار دارد. از آنجا که این سهم بنیادی است، اگر نوسانگیر نیستید، میتوانید به رشد ۲۵ تا ۳۰ درصدی آن امیدوار باشید.
RahavardStartTrading
به نظر میرسد موج اصلاحی b به شکل فلت گسترده در حال شکلگیری است، به این معنی که نباید خیلی پایینتر از این محدوده برود. محدوده ۱۰ تومان میتواند نقطه خوبی برای ذخیره سود باشد، اما با توجه به اینکه این شرکت جزو پتروشیمیهای خوب است و بازار هم وضعیت خوبی دارد، رسیدن به قیمتهای ۱۲ و ۱۳ تومان چندان دور از انتظار نیست. در صورتی که قیمت به زیر ۶ تومان برسد، این تحلیل نقض میشود.
RahavardStartTrading

با توجه به بنیاد قوی سهم و اصلاح قیمتی قبلی، در کوتاهمدت انتظار میرود سهم به راحتی از محدوده ۲۰ هزار تومان عبور کند. هدف قیمتی ۲۵ هزار تومان و سود تقریبی ۷۰ درصدی برای سهام مارون در میانمدت کاملاً دستیافتنی به نظر میرسد. تا پایان سال، هدف بلندمدت قیمتی بین ۳۰ تا ۳۳ هزار تومان برای سهم متصور است. همچنین، با توجه به اینکه ابر ایچیموکو با ضخامت مناسب در پایین قیمت دیده میشود، احتمالاً کف قیمتی اخیر در محدوده ۱۵ هزار تومان به عنوان یک حمایت قوی عمل کرد (حتی اگر قیمت تا محدوده ۱۳ و ۱۴ هزار تومان هم کاهش یابد، جای نگرانی نیست، هرچند این اتفاق بعید به نظر میرسد).
RahavardStartTrading

تا زمانی که در کانال بنفش به حرکت خود ادامه دهیم و با در نظر گرفتن محدوده ۲۵۰، انتظار میرود سهام بانک ملت طی یک حرکت سریع تا محدوده ۴۰۰-۴۵۰ رشد کند.
RahavardStartTrading

Probably 400 USD is good support for the share and in step C this share can move to 700 or even 900 Tomans.
RahavardStartTrading

Assumptions: 1- The end of Hormuz's first ascending wave in summer; 2- Corrective wave can be as follows: ️ ️ WXY Combined correction wave: W Triangle X zigzag Y zigzag In this case we can assume the end of the correction wave in November. ️ ️ ABC (extensive plate) A triangle B Zigzag ۲ wavy c In this scenario the end of the correction wave cannot be considered November 1 🔆 If we consider the fifth wave of down the wave of C shortened, late April can be considered the end of the downward trend. Condition: Before it comes down 1, it can stabilize above 2 🔅 In the most pessimistic scenario if Hormuz's shares cannot be between the range. Stabilization up to 1 and reaches the bottom of 2 Tomans earlier, which means the descending wave. It's not over yet and can continue until the end of the year
RahavardStartTrading

Assumptions: 1- The end of Hormuz's first ascending wave in summer; 2- Corrective wave can be as follows: ️ ️ WXY Combined correction wave: W Triangle X zigzag Y zigzag In this case, we can assume the end of the correction wave in November and at the price of 1 Toman ️ ️ ABC (extensive plate) A triangle B Zigzag ۲ wavy c In this scenario the end of the correction wave cannot be considered November 1 🔆 If we consider the fifth wave of a wave of C shortened, the end of April and the price of 2 USD will be the end of the downward trend. Condition: It should be able to consolidate the range of 1 to 2 USD 🔅 If the price fails to stabilize above 1 and 2 and reach the bottom of 2 Tomans, that is, the downward trend has not yet finished and this correction can continue until the end of the year and start growing from 1 to 2 (pessimistic scenario).
RahavardDisclaimer
Any content and materials included in Sahmeto's website and official communication channels are a compilation of personal opinions and analyses and are not binding. They do not constitute any recommendation for buying, selling, entering or exiting the stock market and cryptocurrency market. Also, all news and analyses included in the website and channels are merely republished information from official and unofficial domestic and foreign sources, and it is obvious that users of the said content are responsible for following up and ensuring the authenticity and accuracy of the materials. Therefore, while disclaiming responsibility, it is declared that the responsibility for any decision-making, action, and potential profit and loss in the capital market and cryptocurrency market lies with the trader.