
SahamTavanmand
@h_SahamTavanmand

What symbols does the trader recommend buying?
Purchase History
پیام های تریدر
Filter
SahamTavanmand
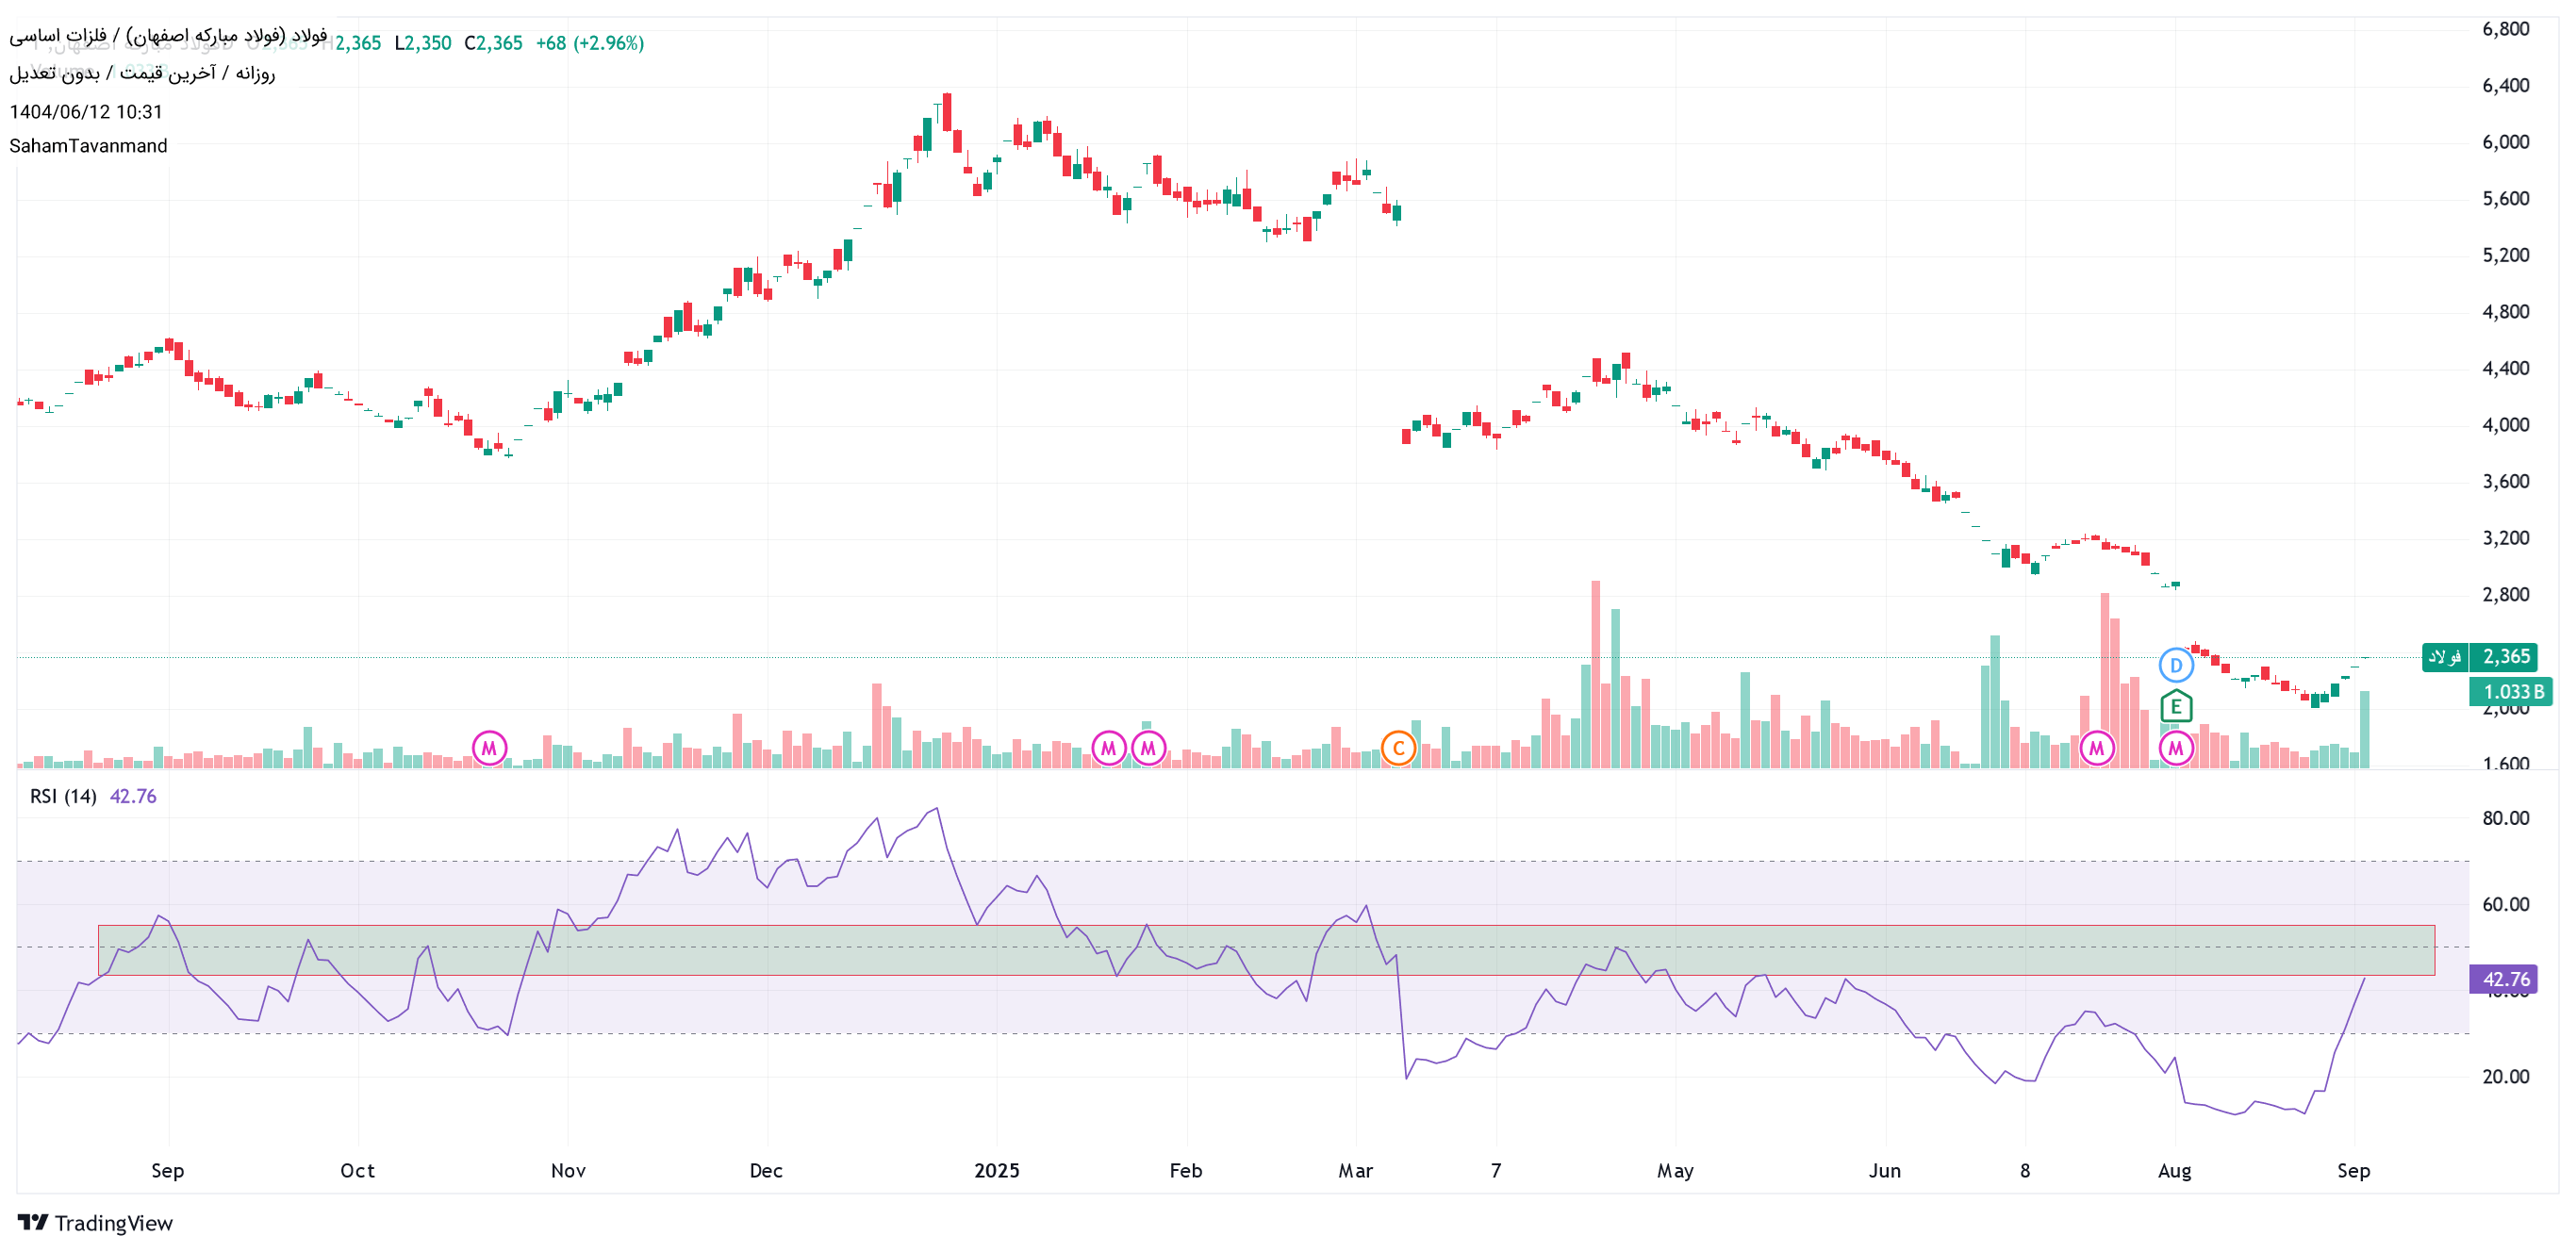
The modified chart requires RSI resistance and resistance to today's volume, according to today's volume.
SahamTavanmand
Is there an event again? Trigger and need for dollars of stock companies and increased Nima rates
SahamTavanmand
Another end. Go for a move upward.
SahamTavanmand
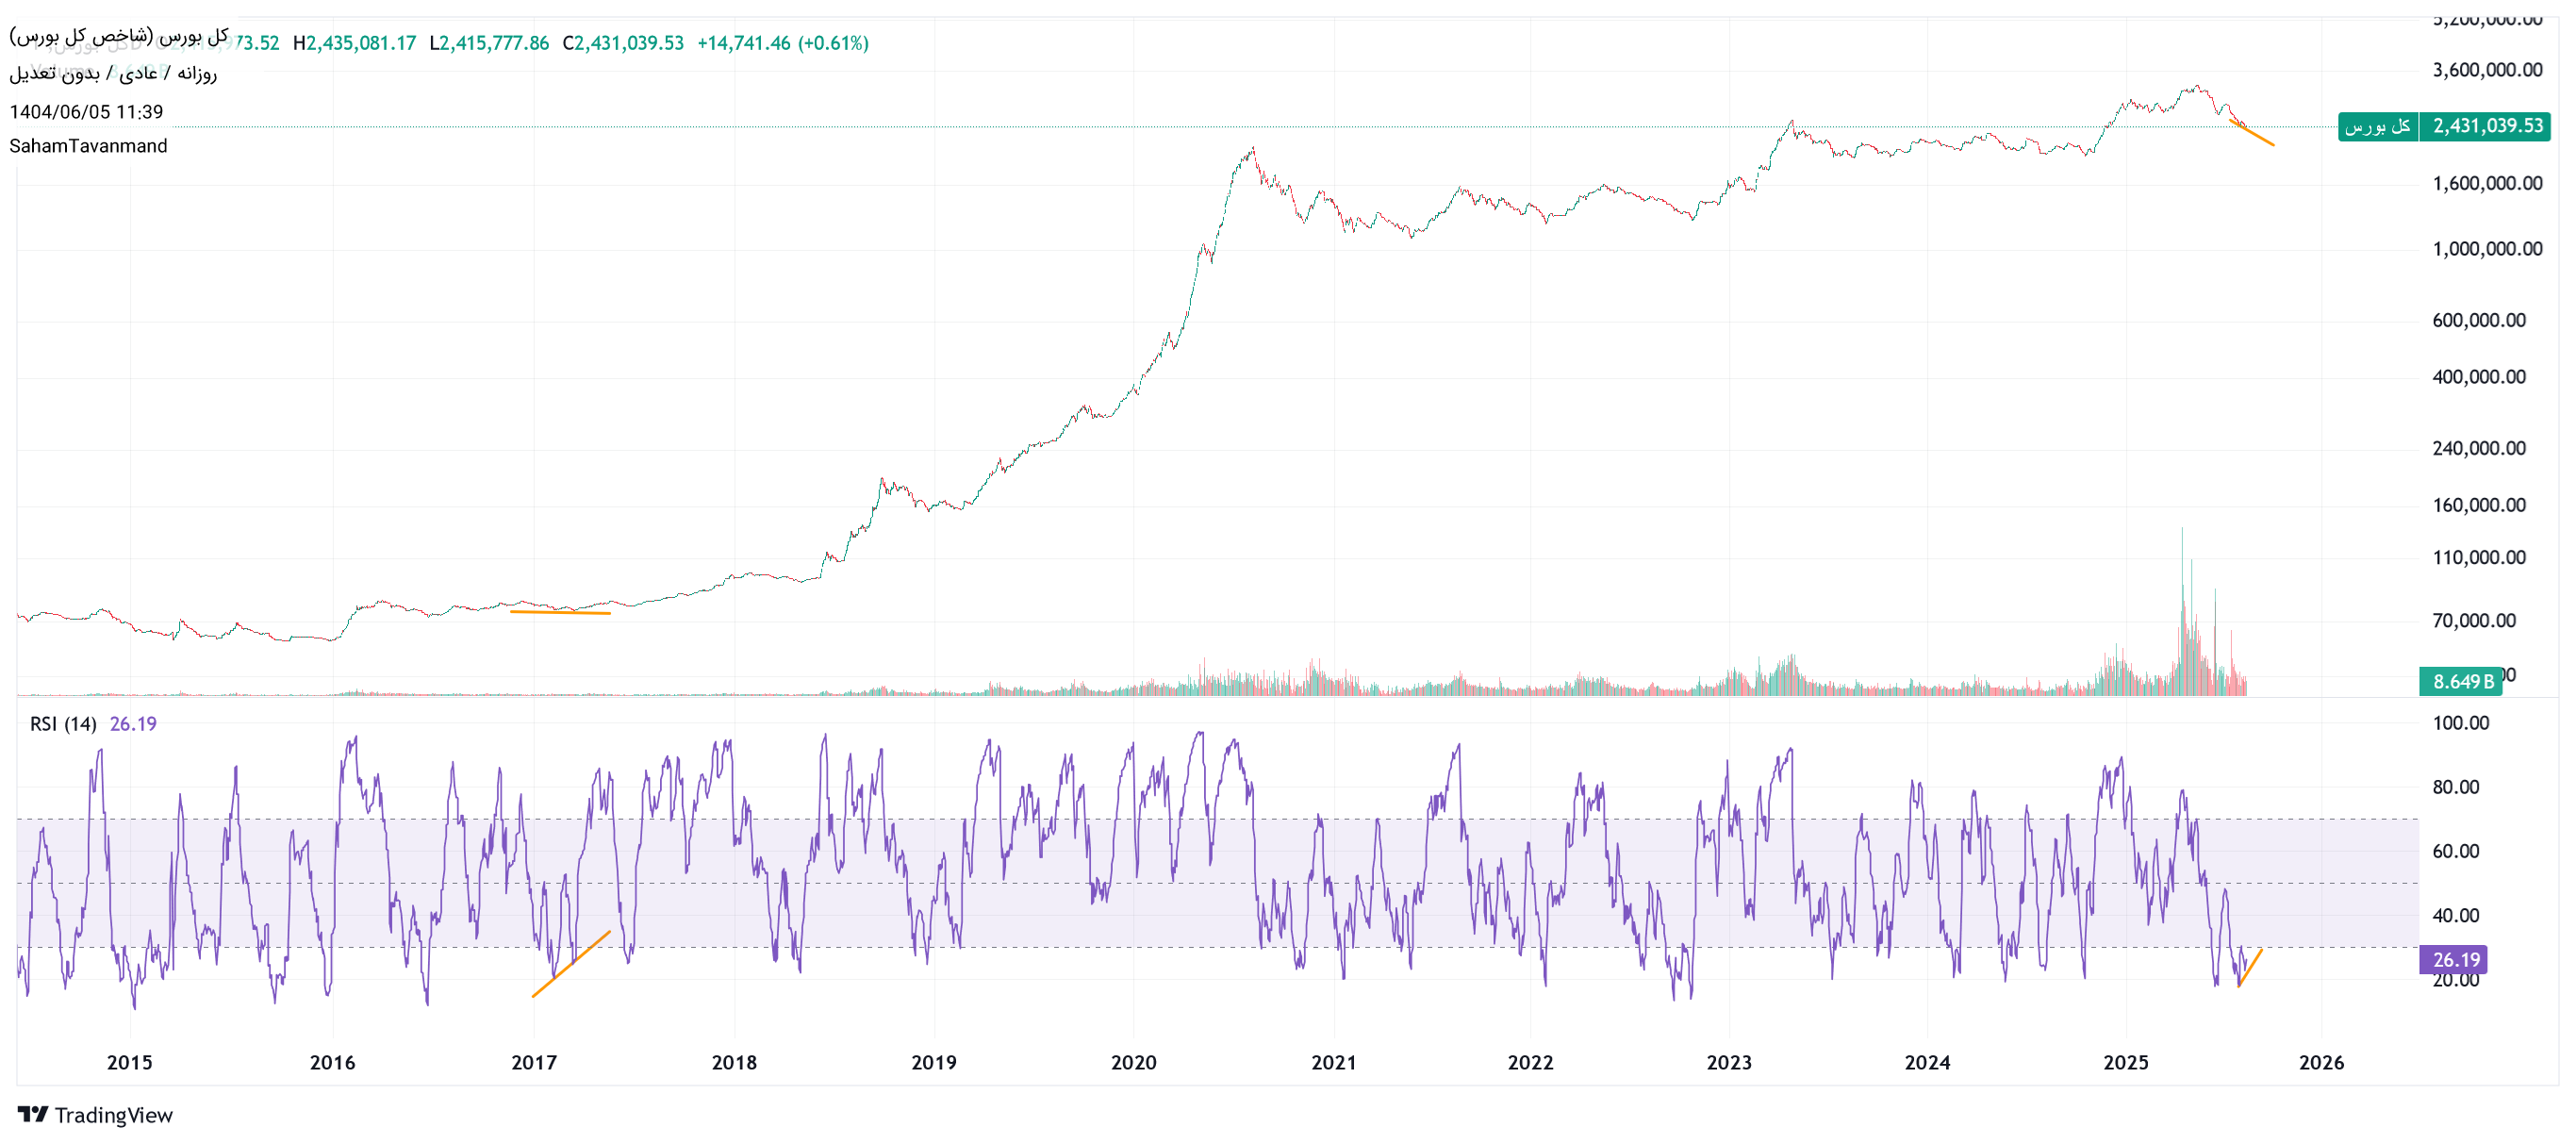
In the formation of multiple divergence in RSI in the overall index
SahamTavanmand
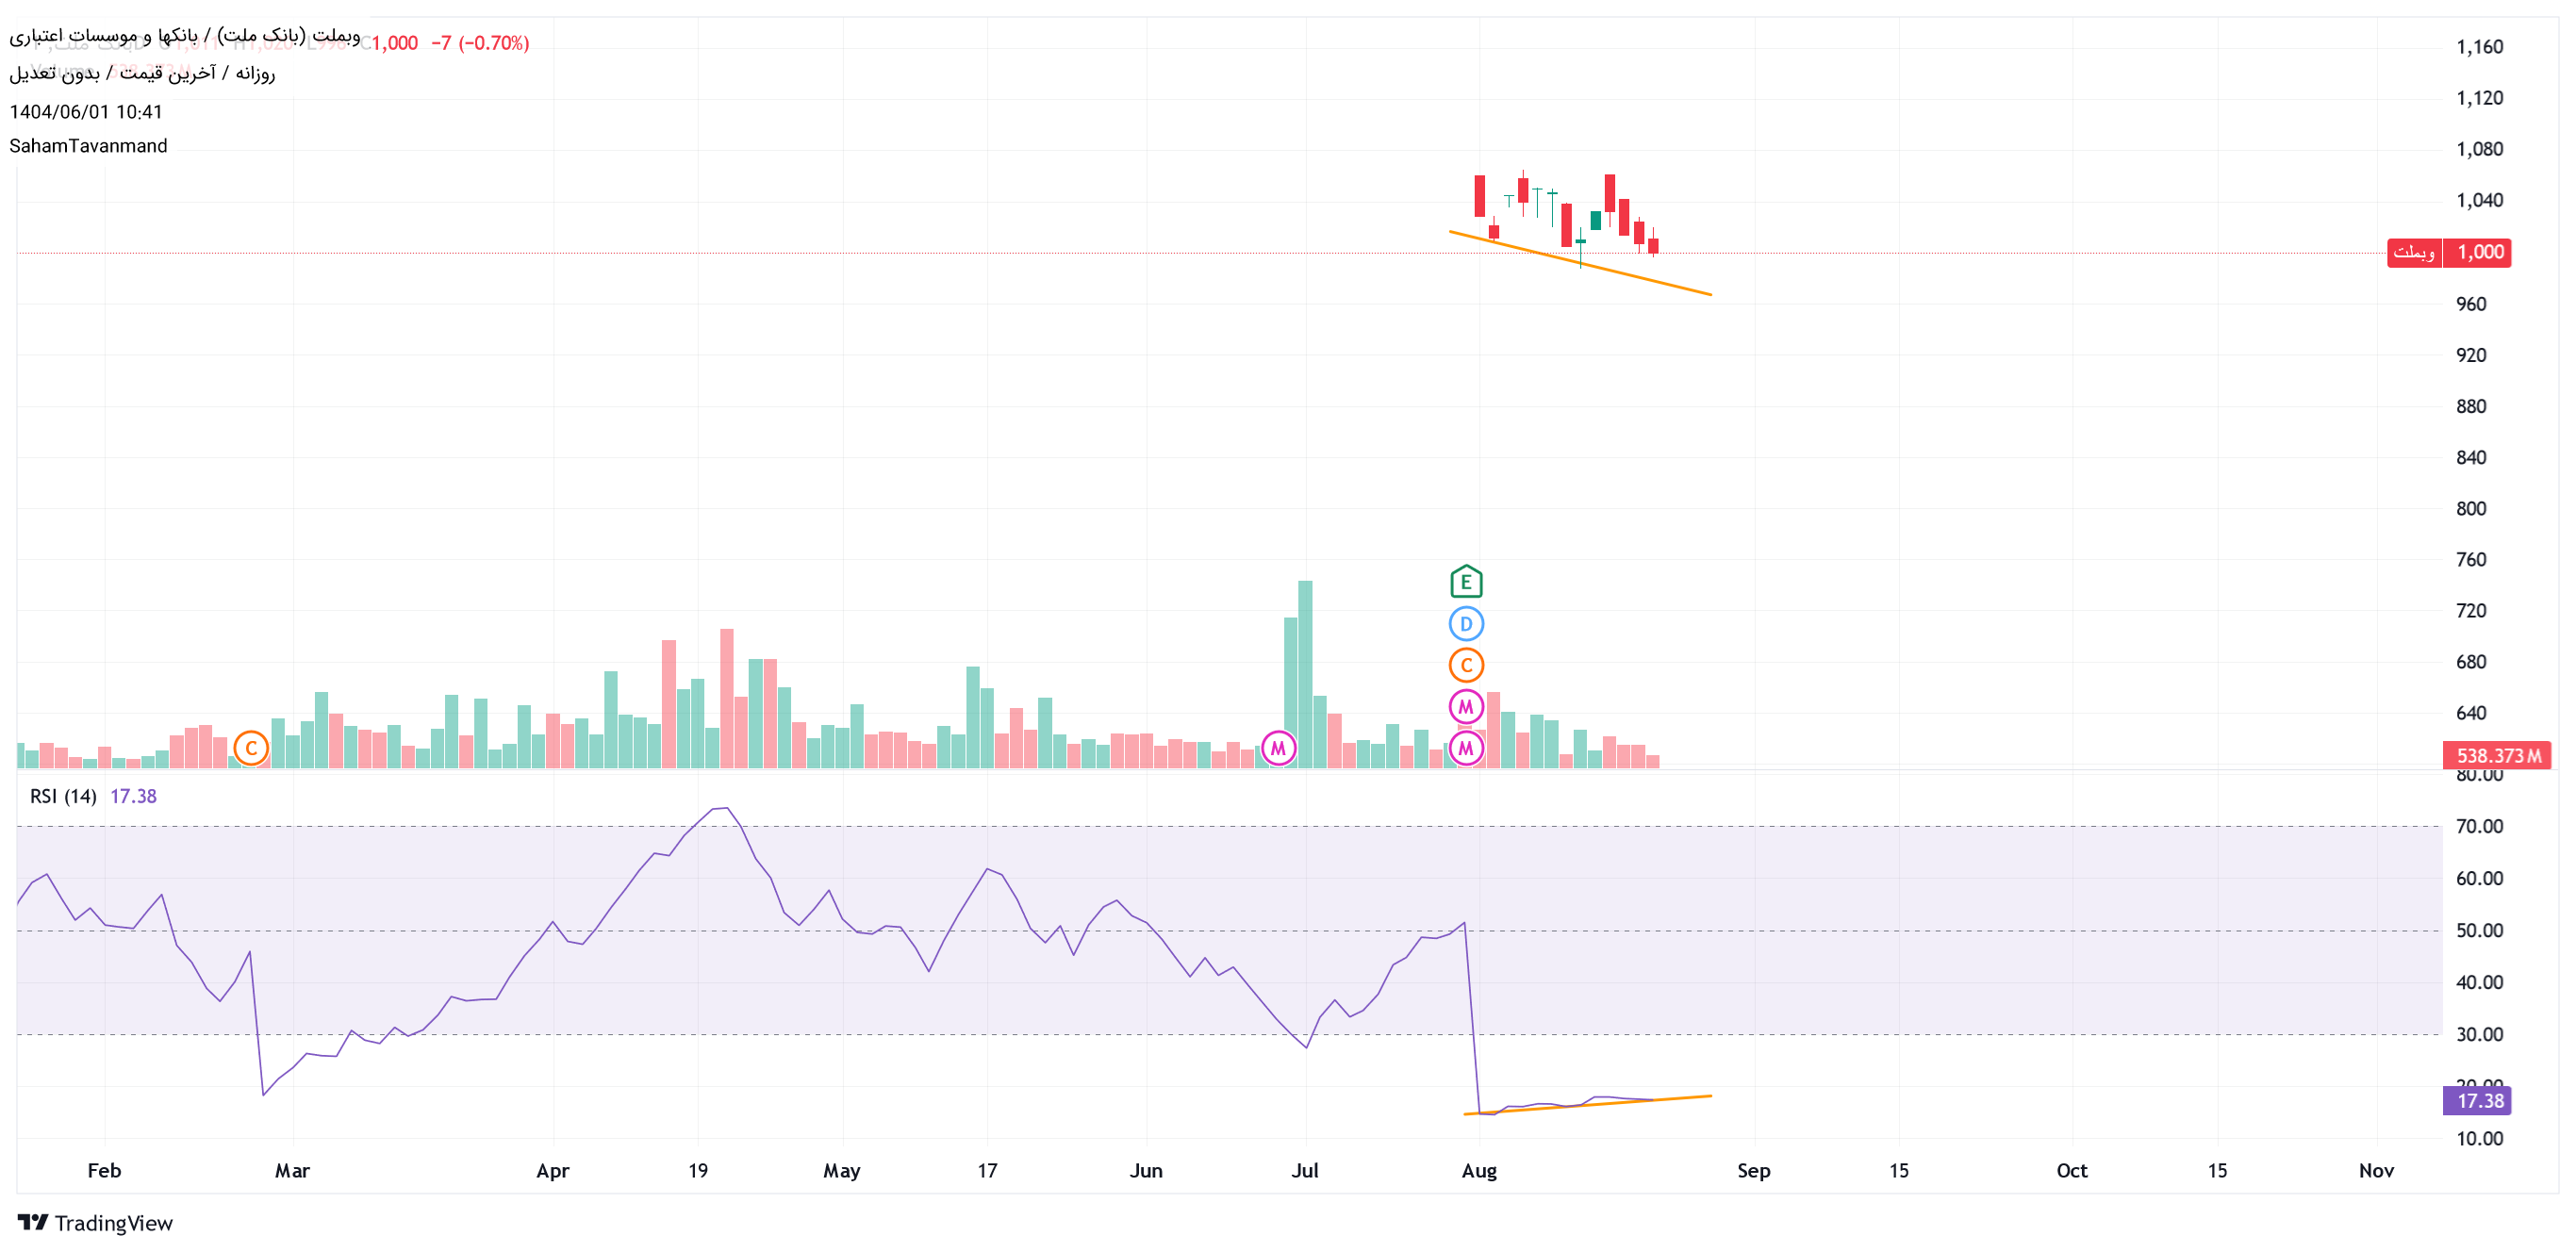
Mellat Bank 100 Tomans and Find 1.37 !!!!
SahamTavanmand
Good growth is awaiting the market.
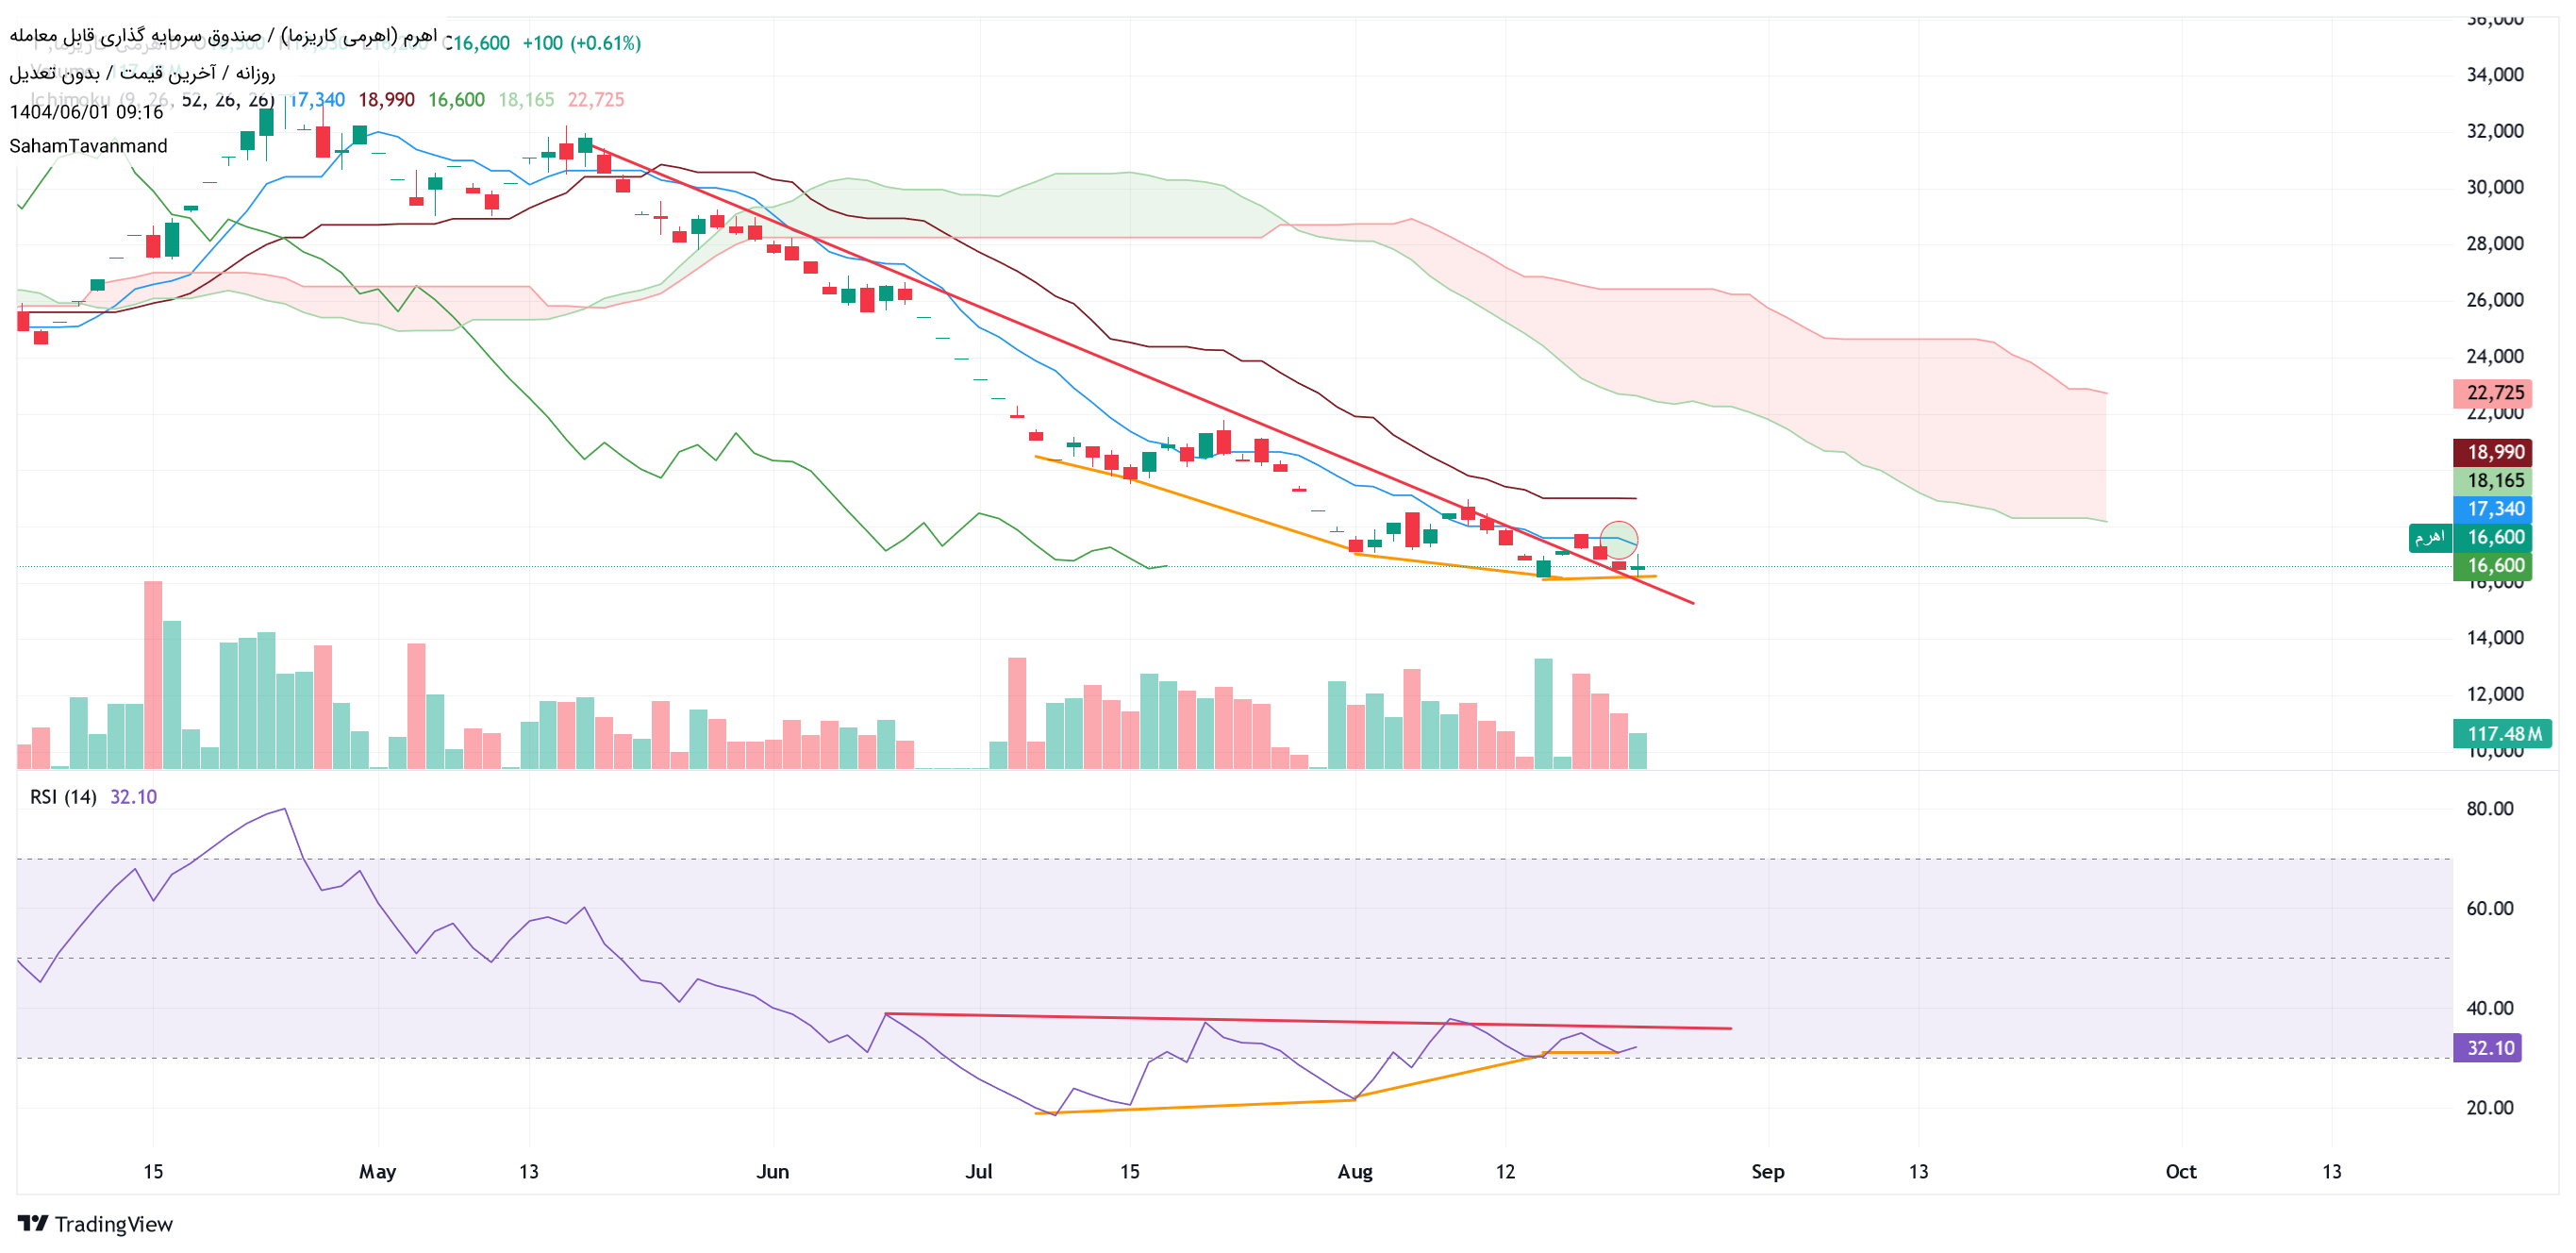
SahamTavanmand
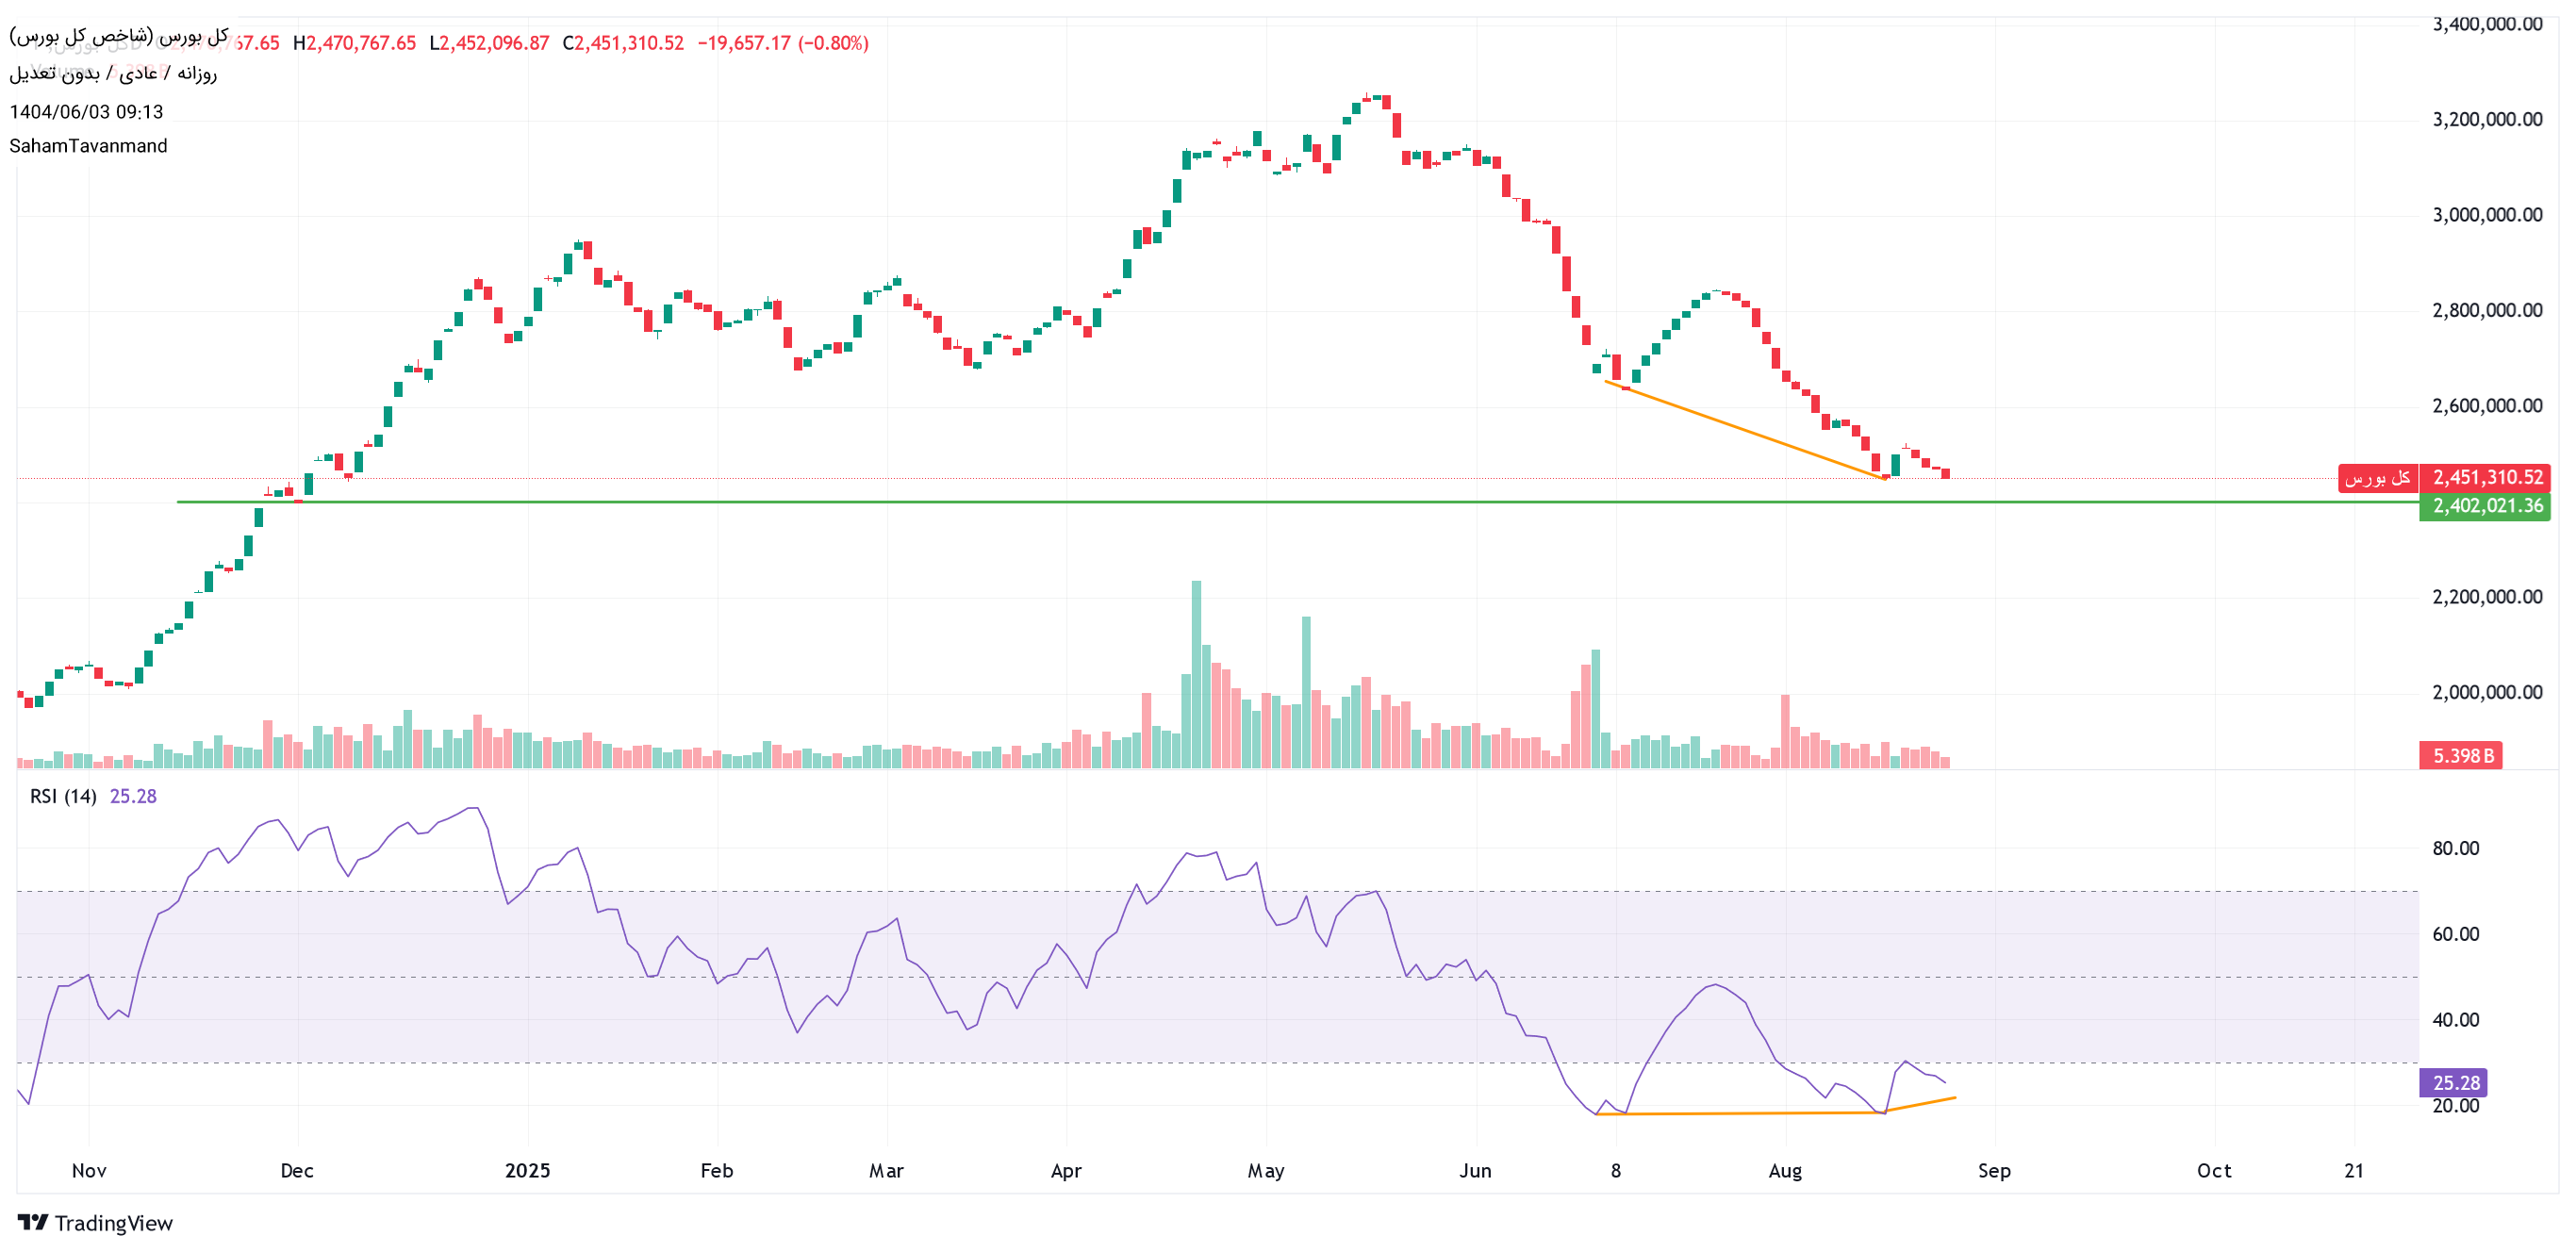
At the bottom of the channel adjusted with good conditions of the indicators and talk of Paul for a good growth for the whole market.
SahamTavanmand
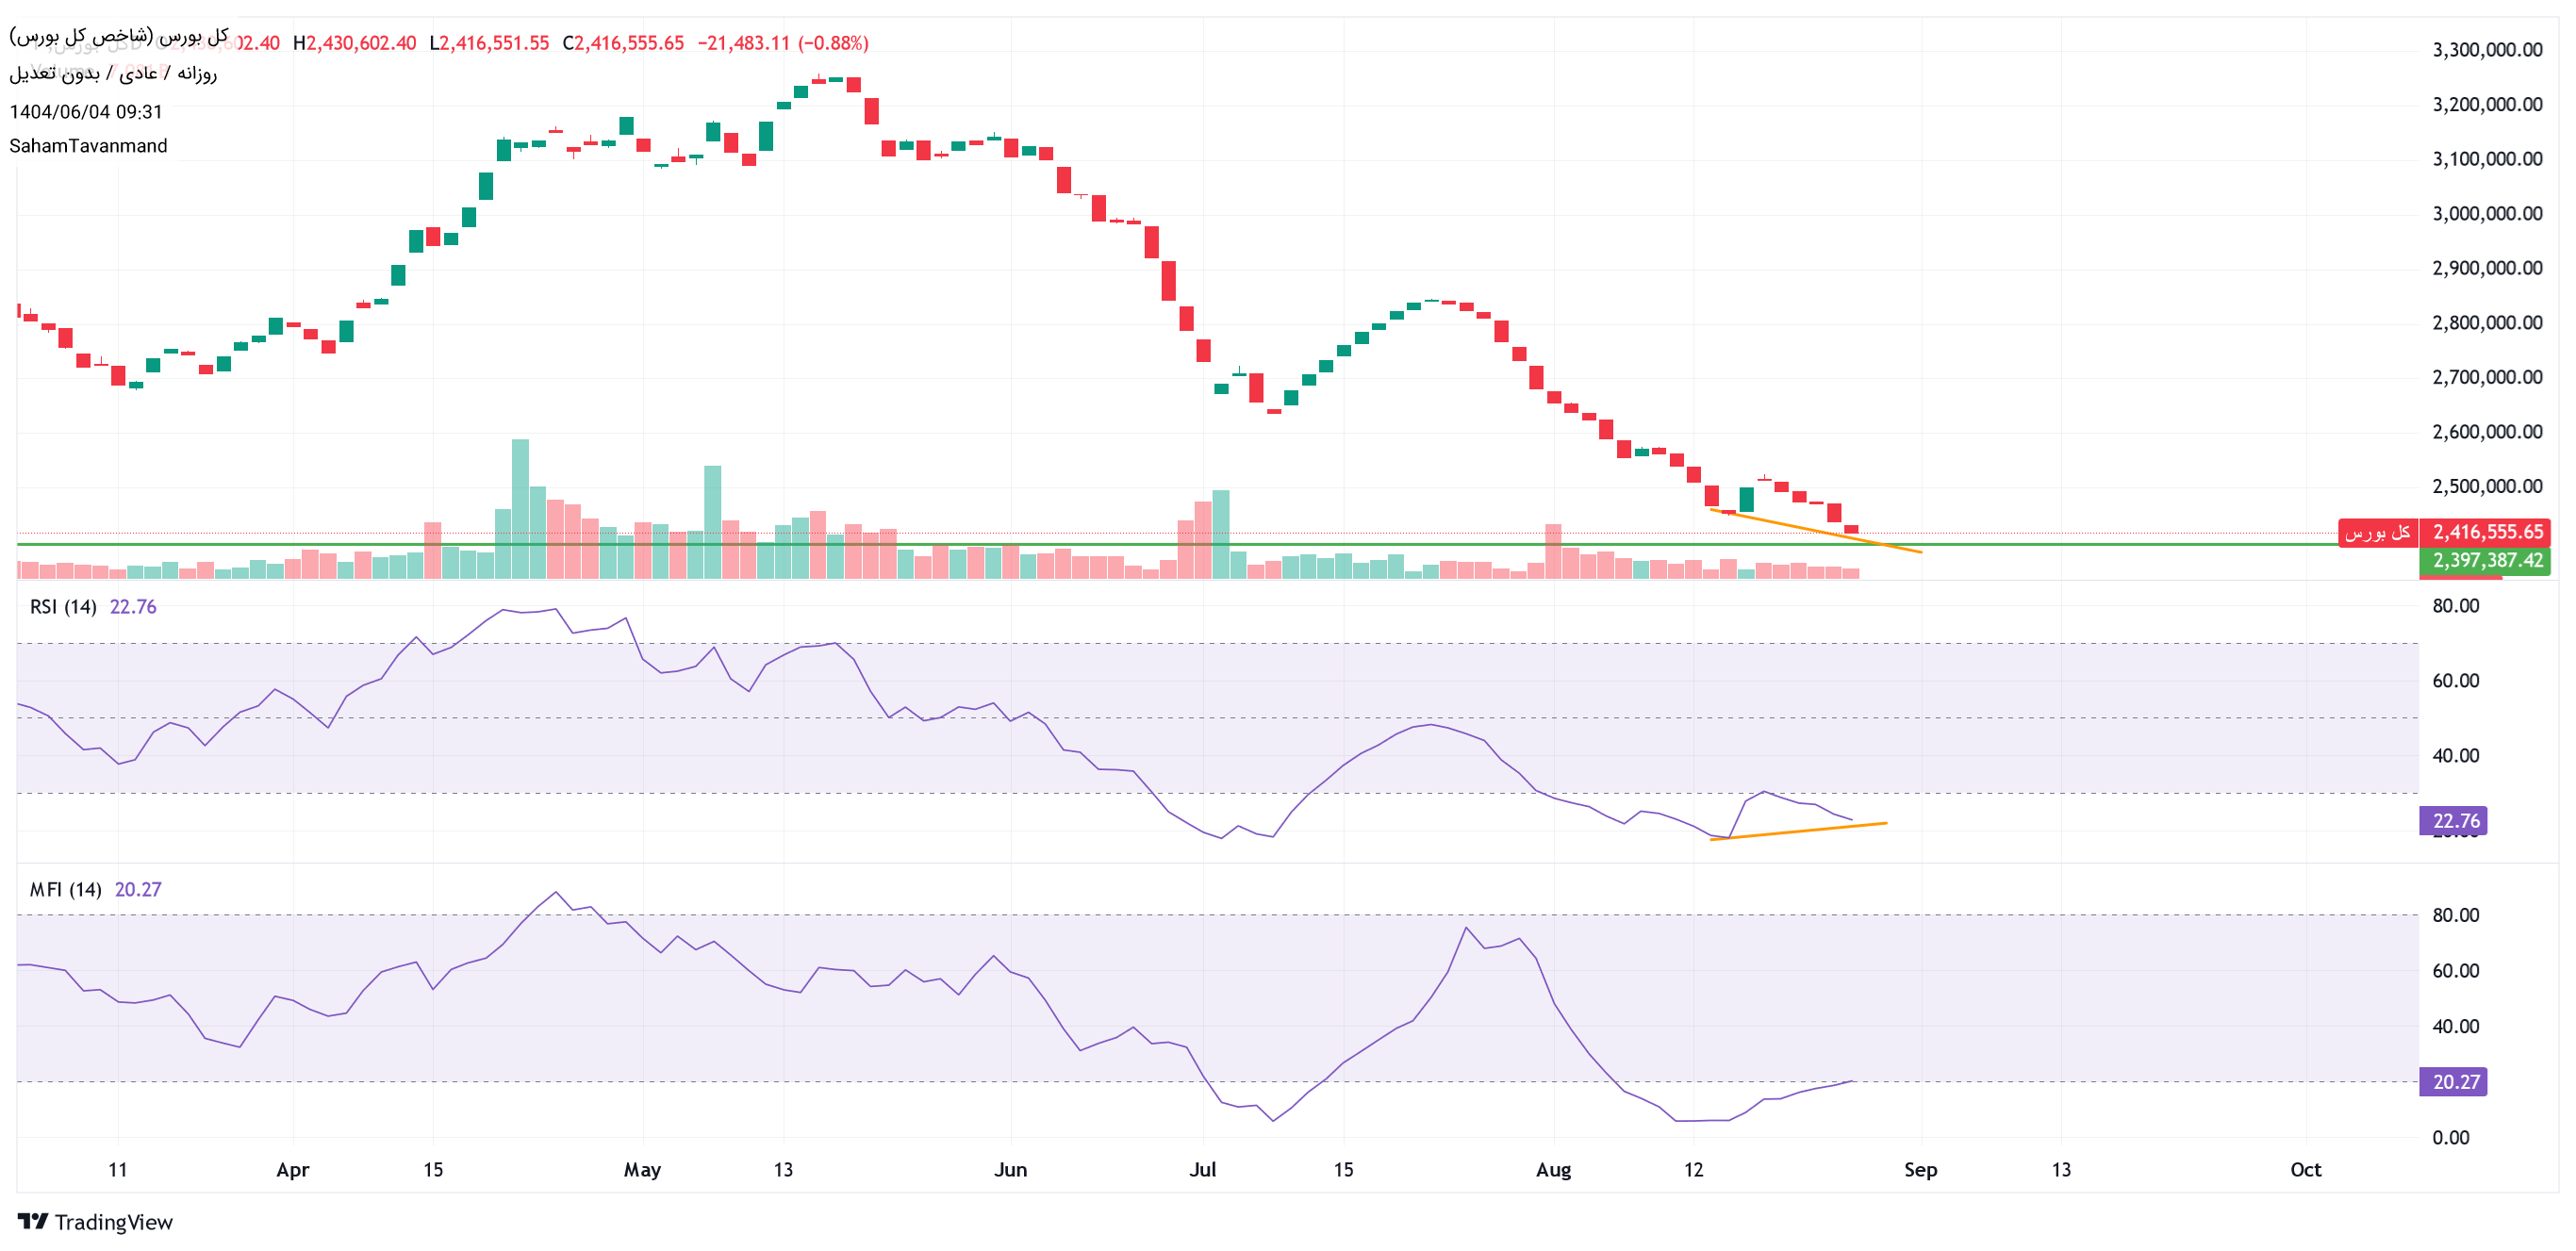
Divergence in Rsi for a good growth
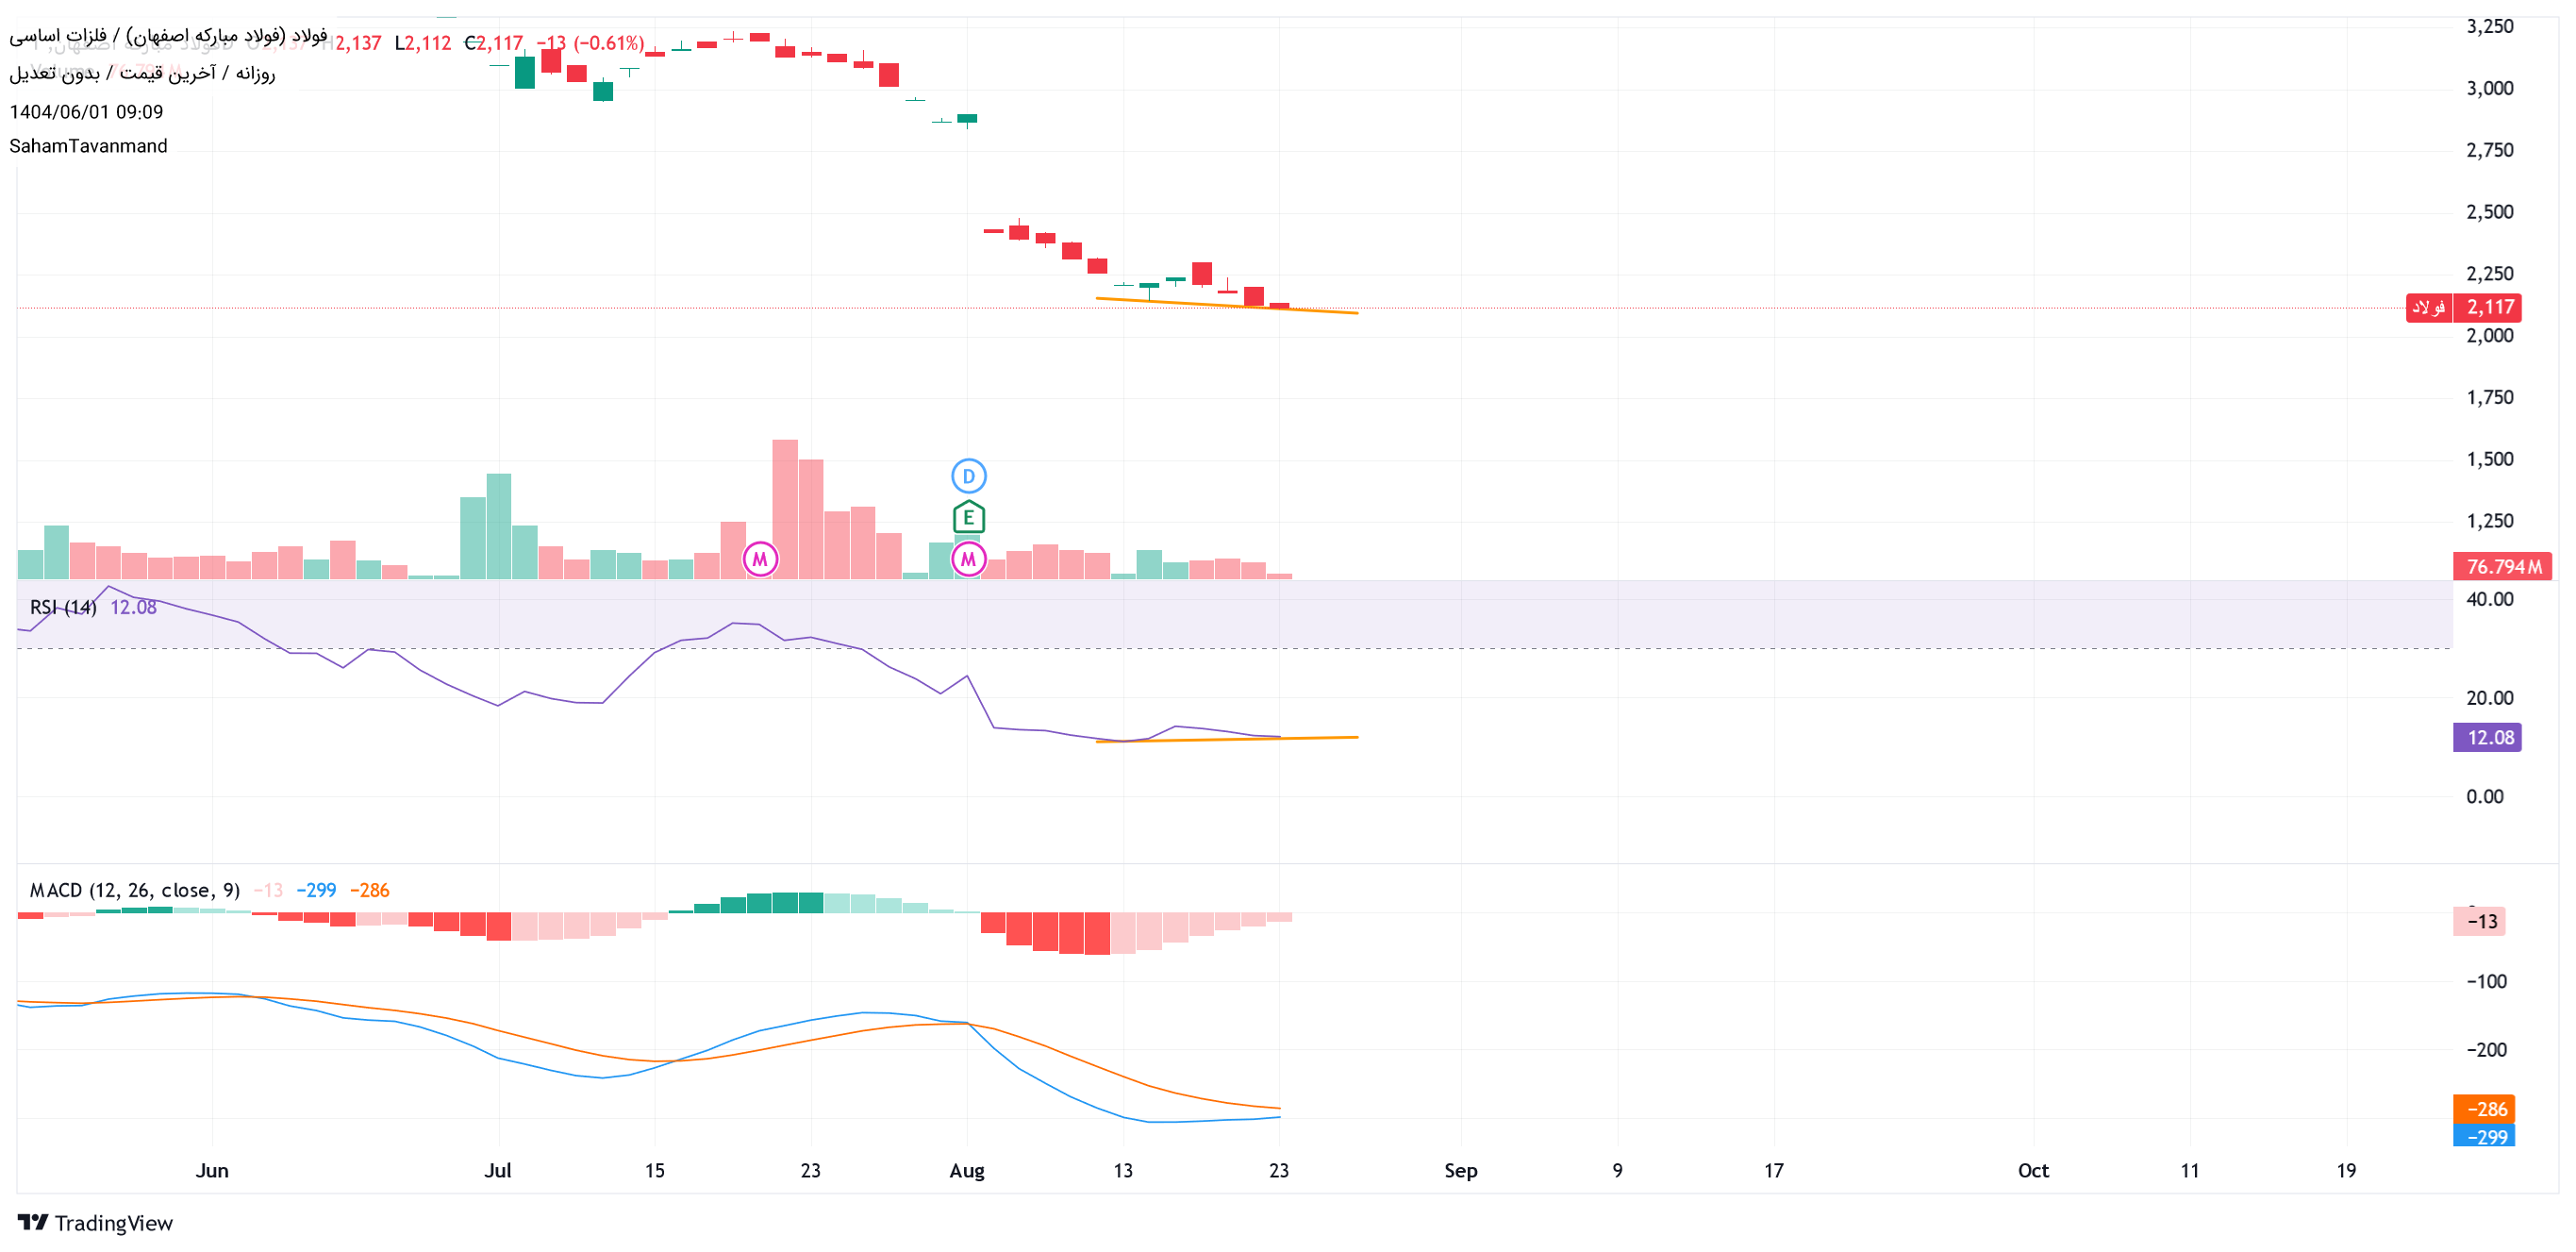
SahamTavanmand
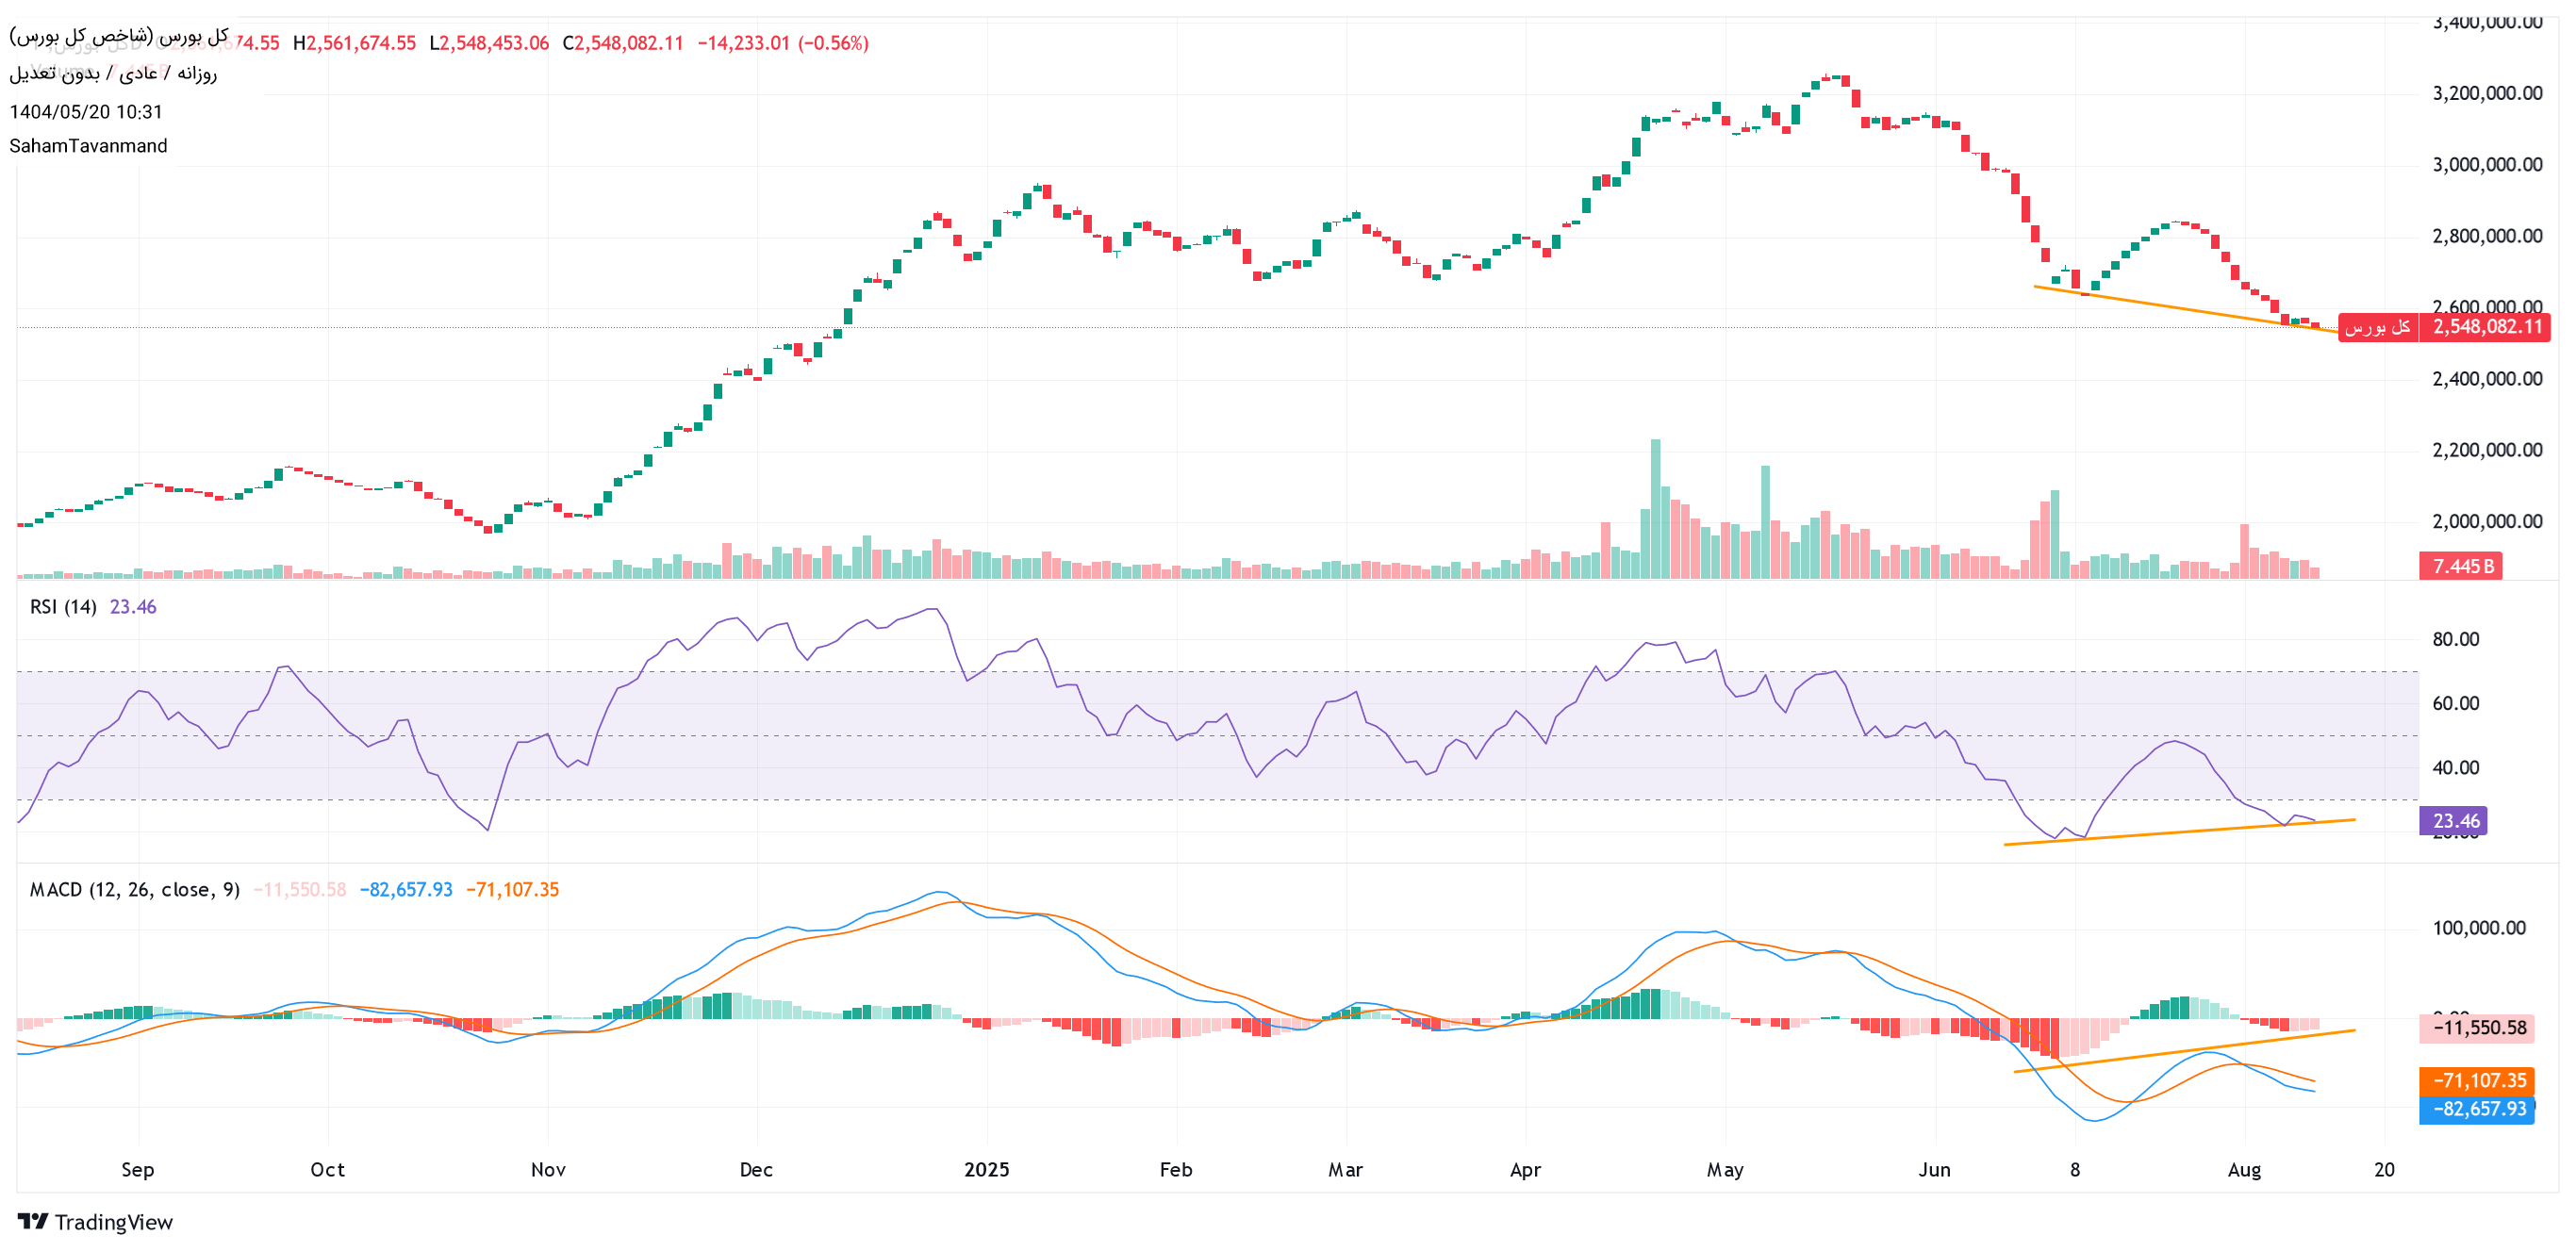
With these divergences the best time to buy.
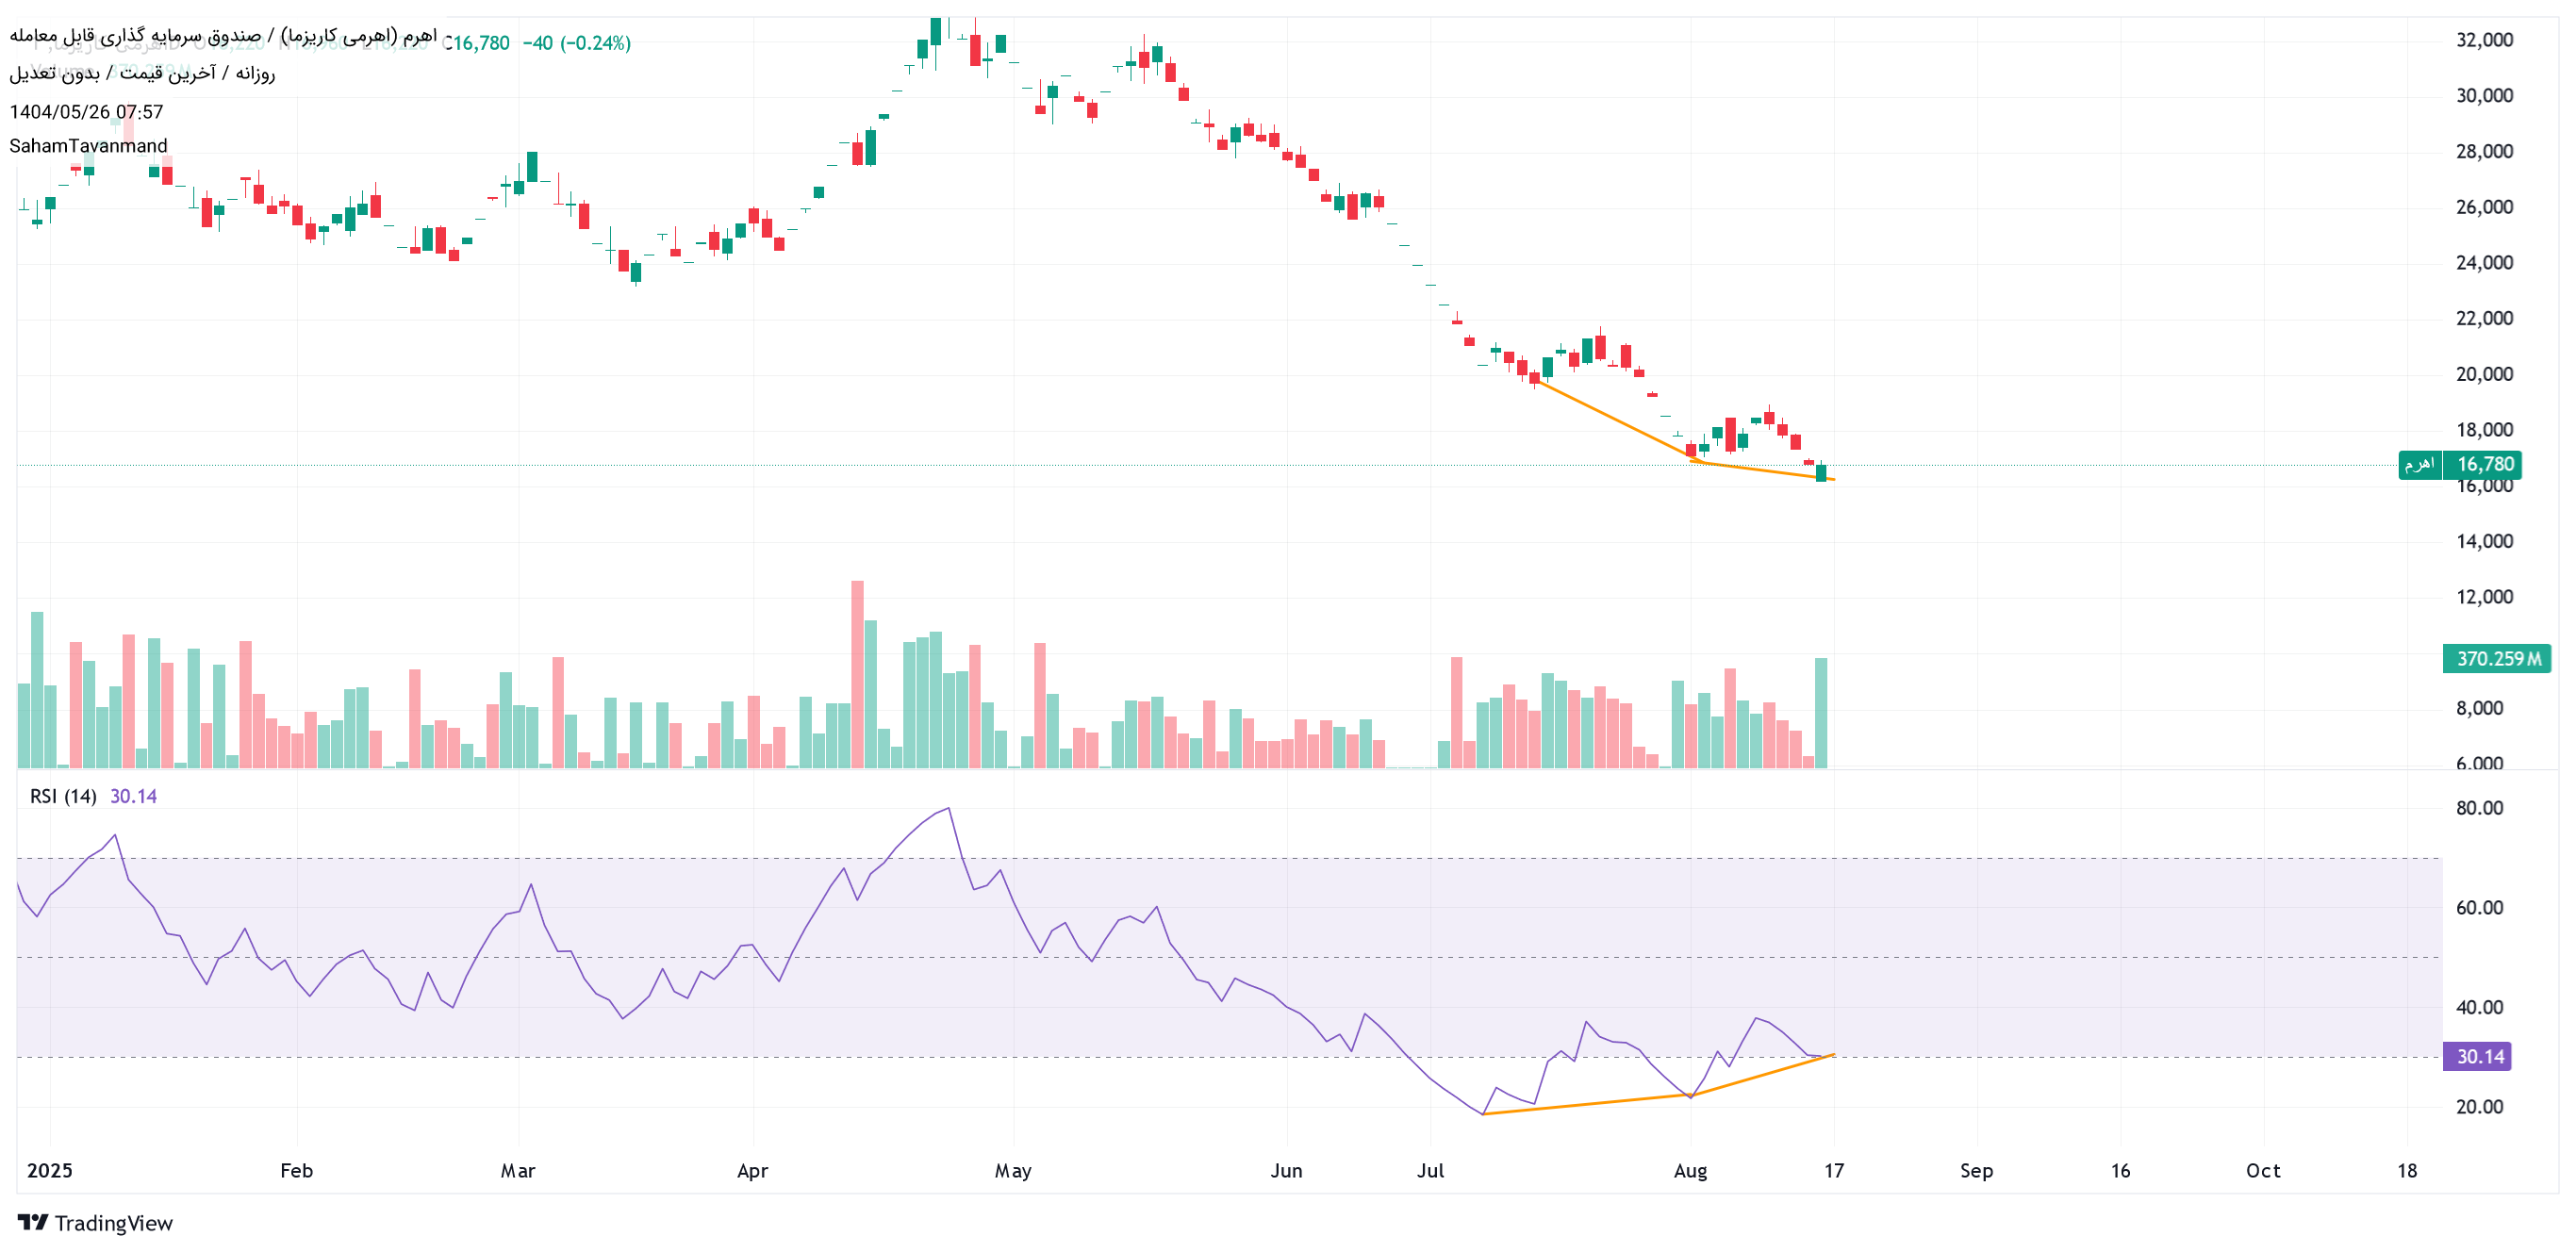
SahamTavanmand
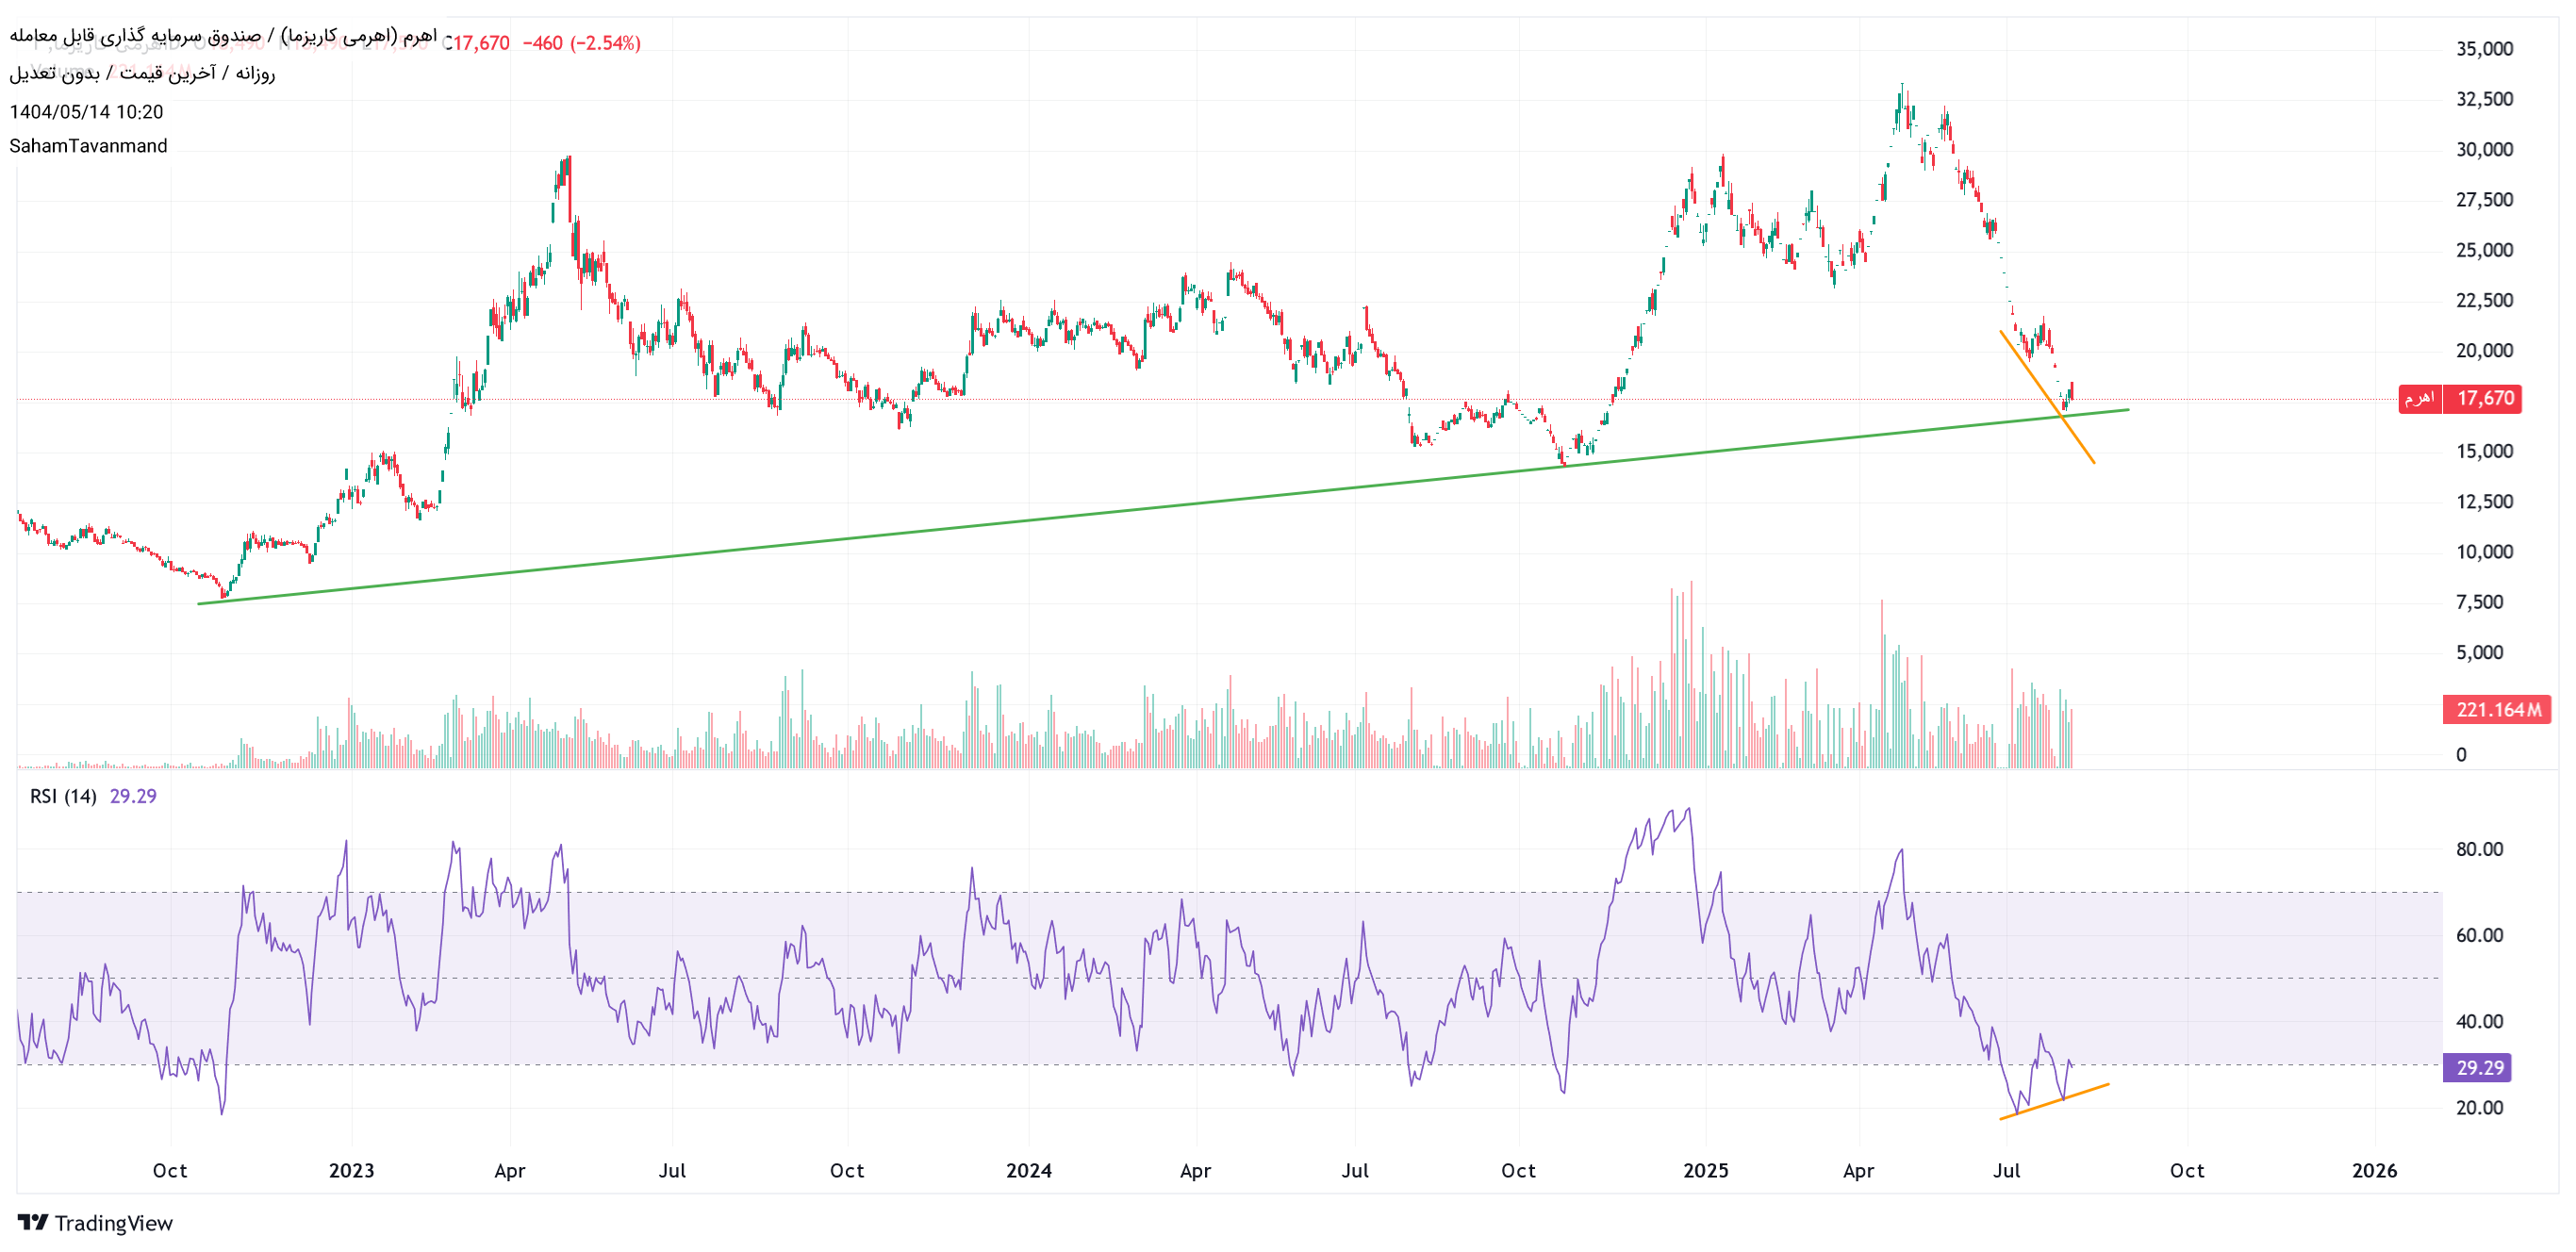
Divergence in RSI Channel floor Bubble -11 % Gold asset of the lever fund is getting expensive rest in very cheap conditions
Disclaimer
Any content and materials included in Sahmeto's website and official communication channels are a compilation of personal opinions and analyses and are not binding. They do not constitute any recommendation for buying, selling, entering or exiting the stock market and cryptocurrency market. Also, all news and analyses included in the website and channels are merely republished information from official and unofficial domestic and foreign sources, and it is obvious that users of the said content are responsible for following up and ensuring the authenticity and accuracy of the materials. Therefore, while disclaiming responsibility, it is declared that the responsibility for any decision-making, action, and potential profit and loss in the capital market and cryptocurrency market lies with the trader.