Nabi33113311
@h_Nabi33113311

What symbols does the trader recommend buying?
Purchase History
پیام های تریدر
Filter
Nabi33113311
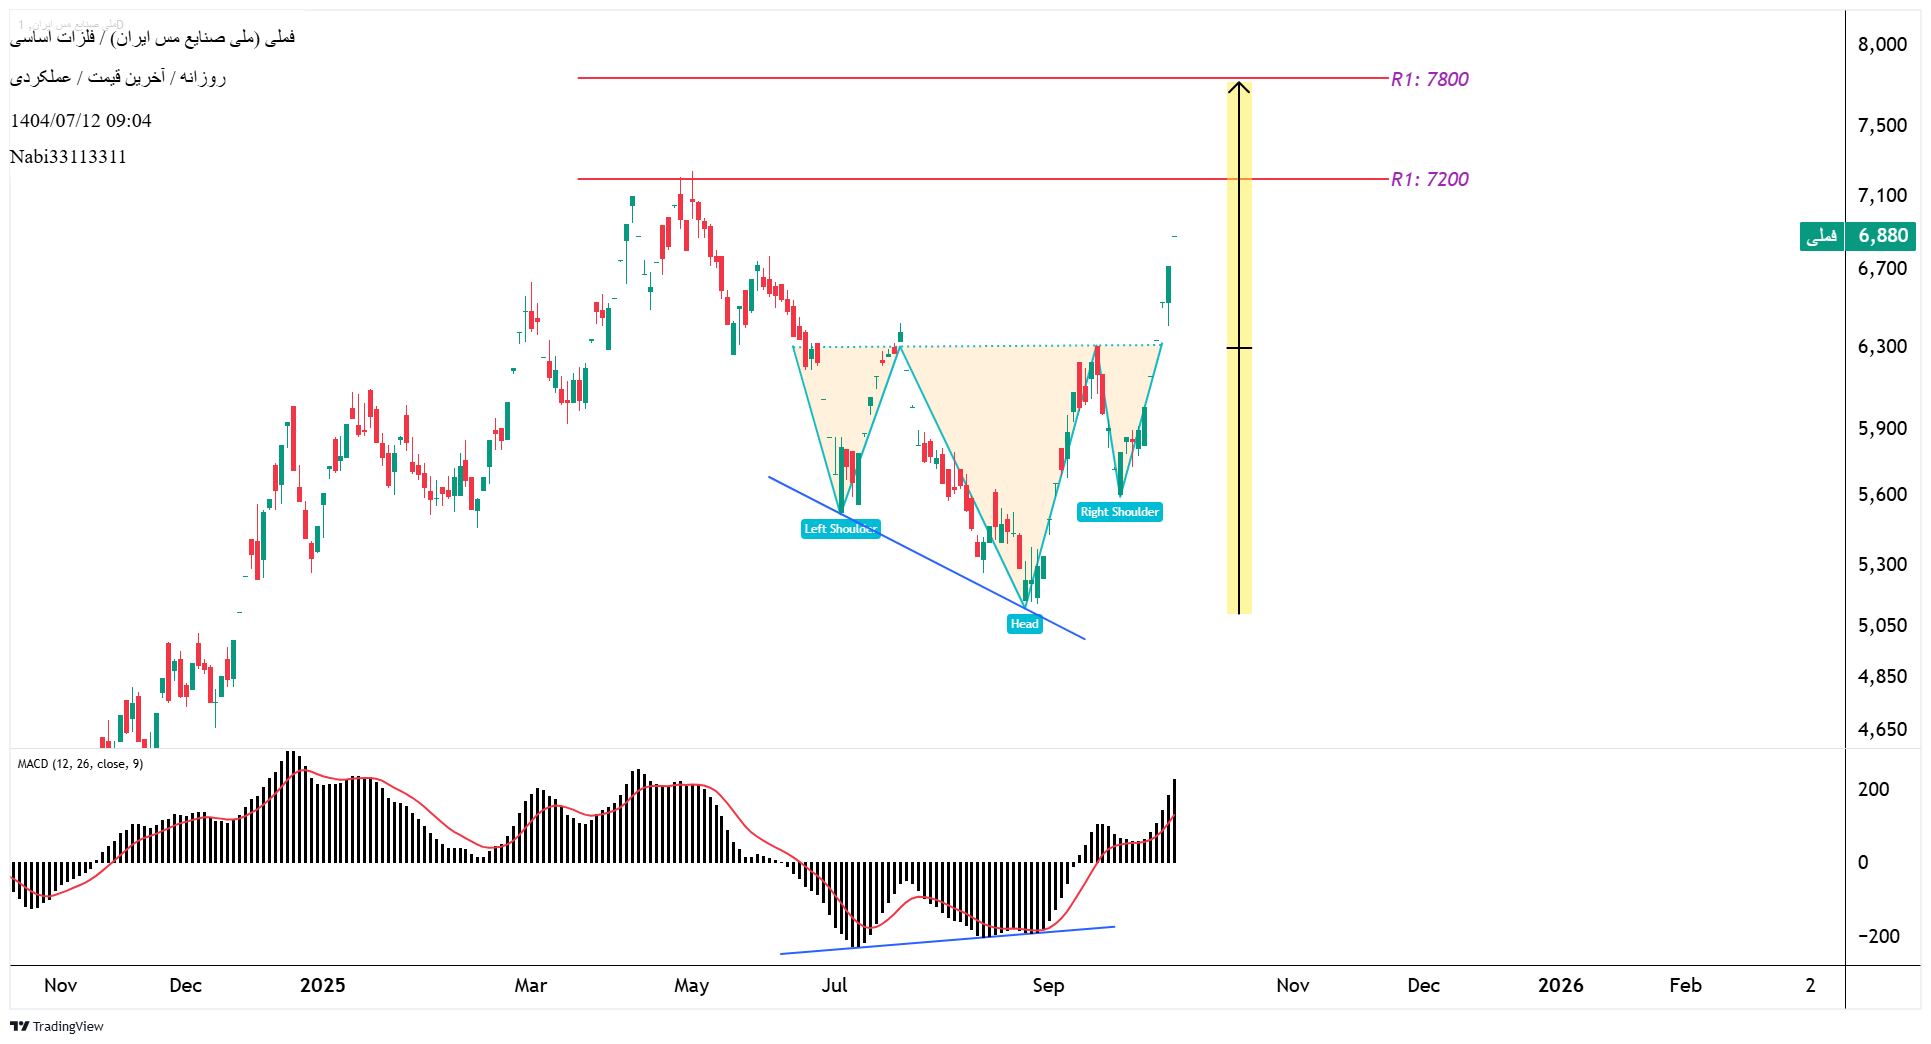
#Family 1404/07/12 #Time_Frem_ Day (D) In the National Copper Industry Chart with the #Famly symbol, we see the formation of #Soroush_caf (reverse). Positive divergence (RD+) on the left shoulder can confirm the formation of the pattern. The price dark can be considered as the width of the head to the neckline. #Hadge - Depending on the risk of individuals, the price can be re -penetrated below the neck line or the right shoulder floor can be placed as a harm. Current Price of Share of 6720 Rials
Nabi33113311
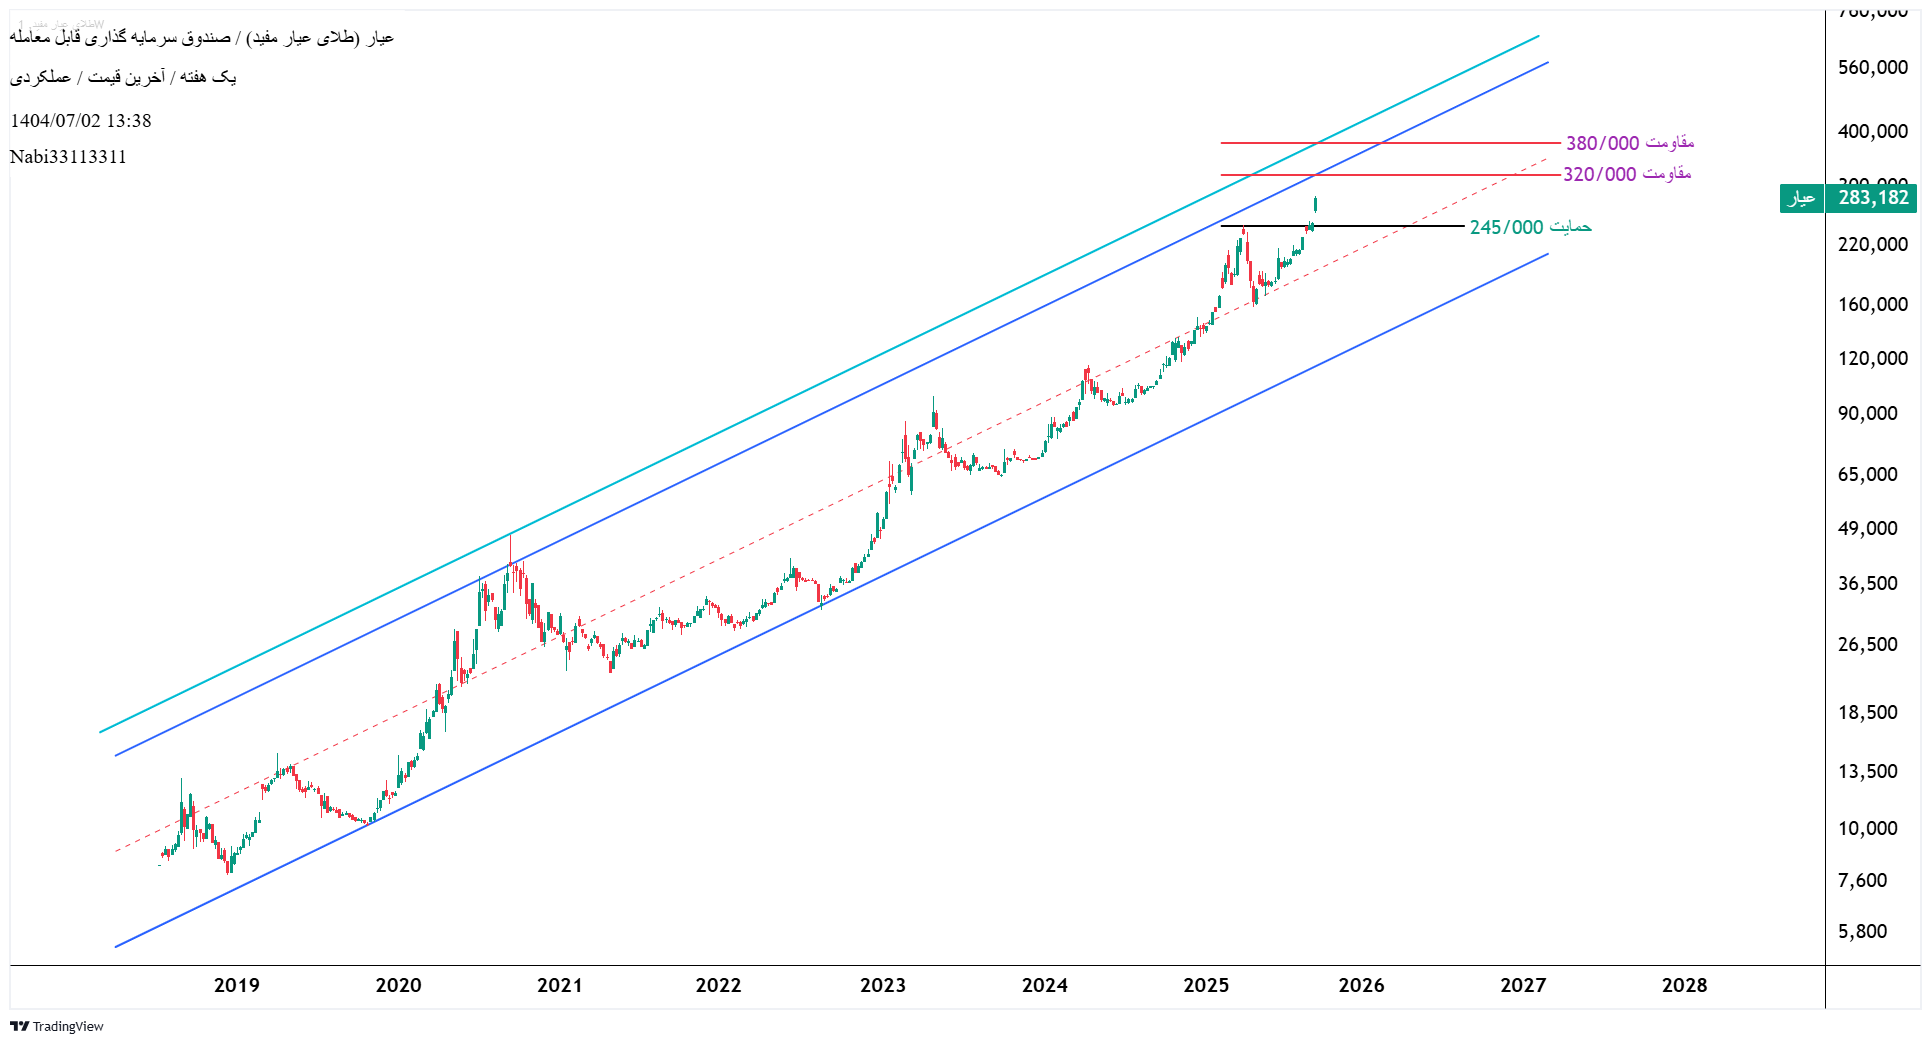
#Ayat 1404/07/02 #Time_Frem_Complete (W) In the useful gold fund chart with the #carment symbol as long as the price is above 245/000 Rials, the potential targets can be 320/000 and 380/000 Rials, respectively. ⚠️ #Hadar -Haddar can be re -entry and price stabilization under the broken resistance around 245/000 Rials Price at the time of analysis 283/182 Rials
Nabi33113311
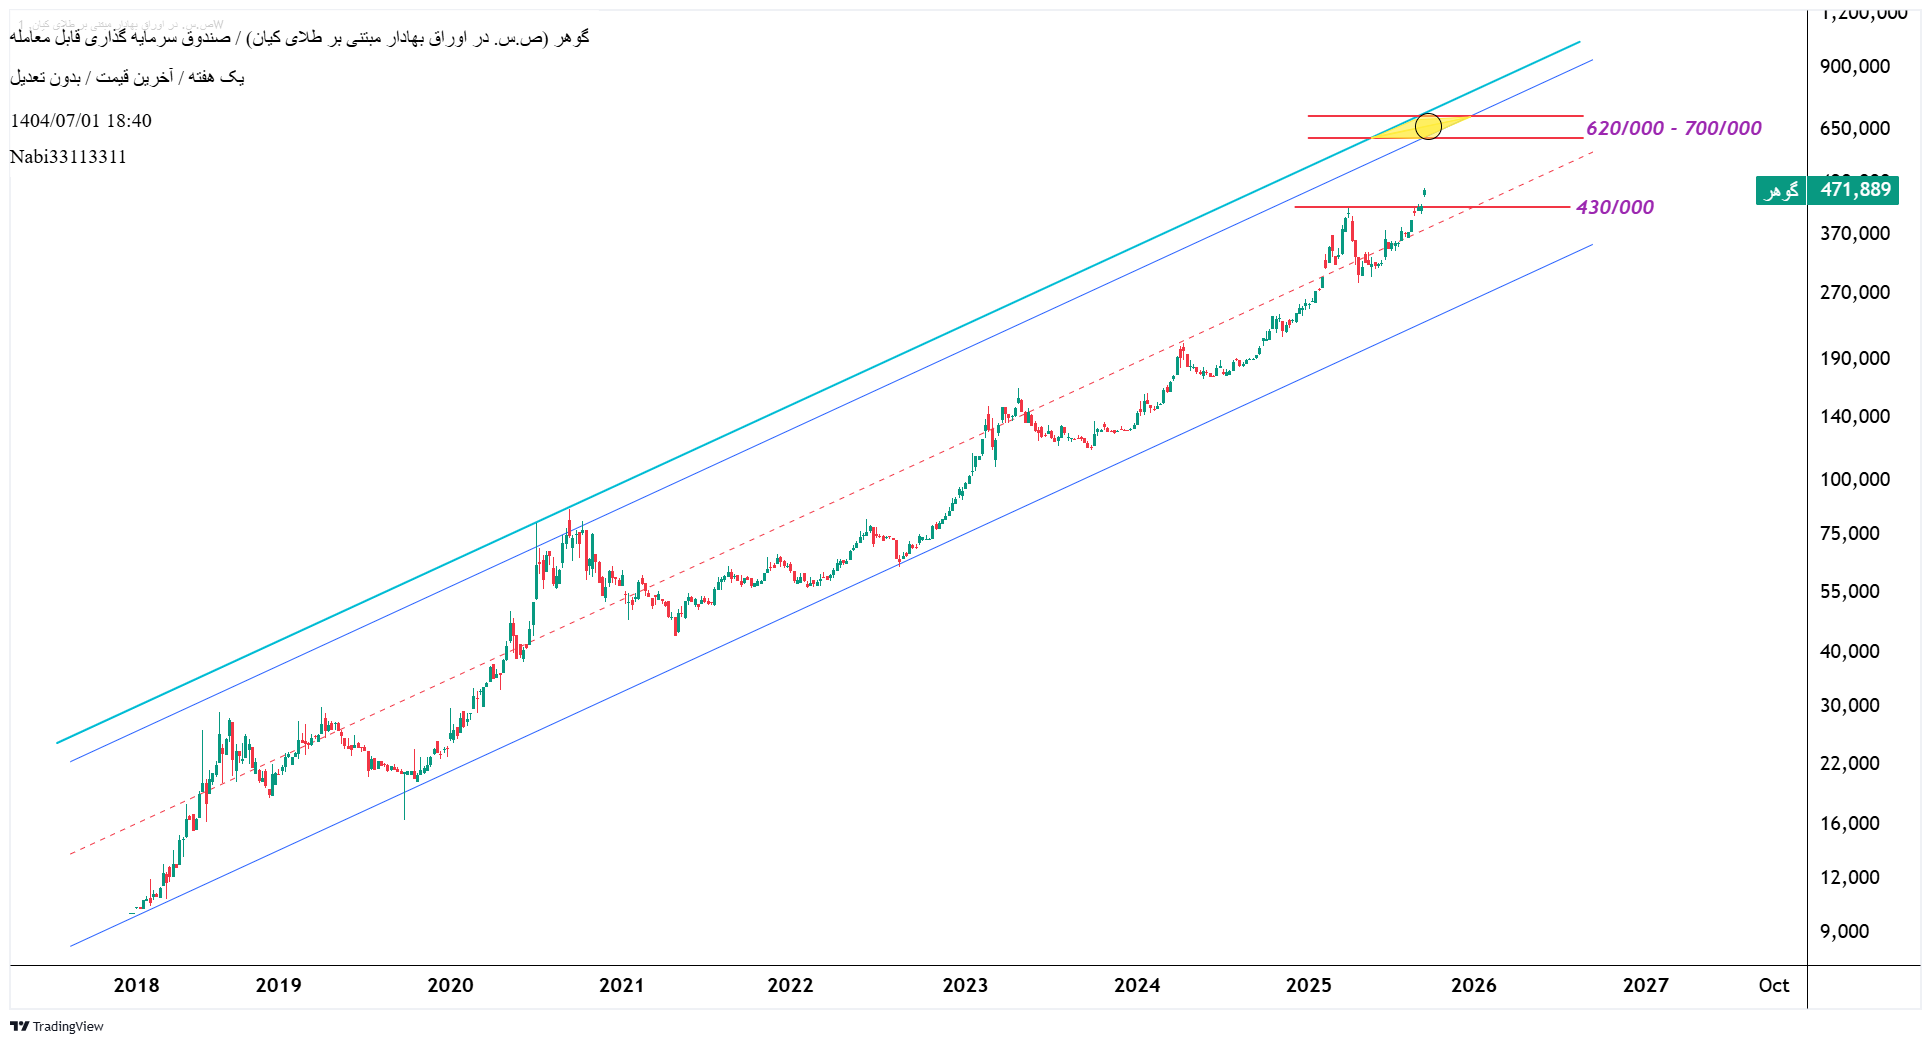
#Gems 1404/07/01 #Time_Frem_Complete (W) In the Qian Gold Fund chart with #Gems as long as the price is traded at 430/000 Rials, the next possible goal can be the roof range of 620,000 to 700/700 Rials. ⚠️ #Haddar can be considered as the entry and reinforcement of the price under the broken resistance. Share price at the time of analysis of 471/889 Rials
Nabi33113311
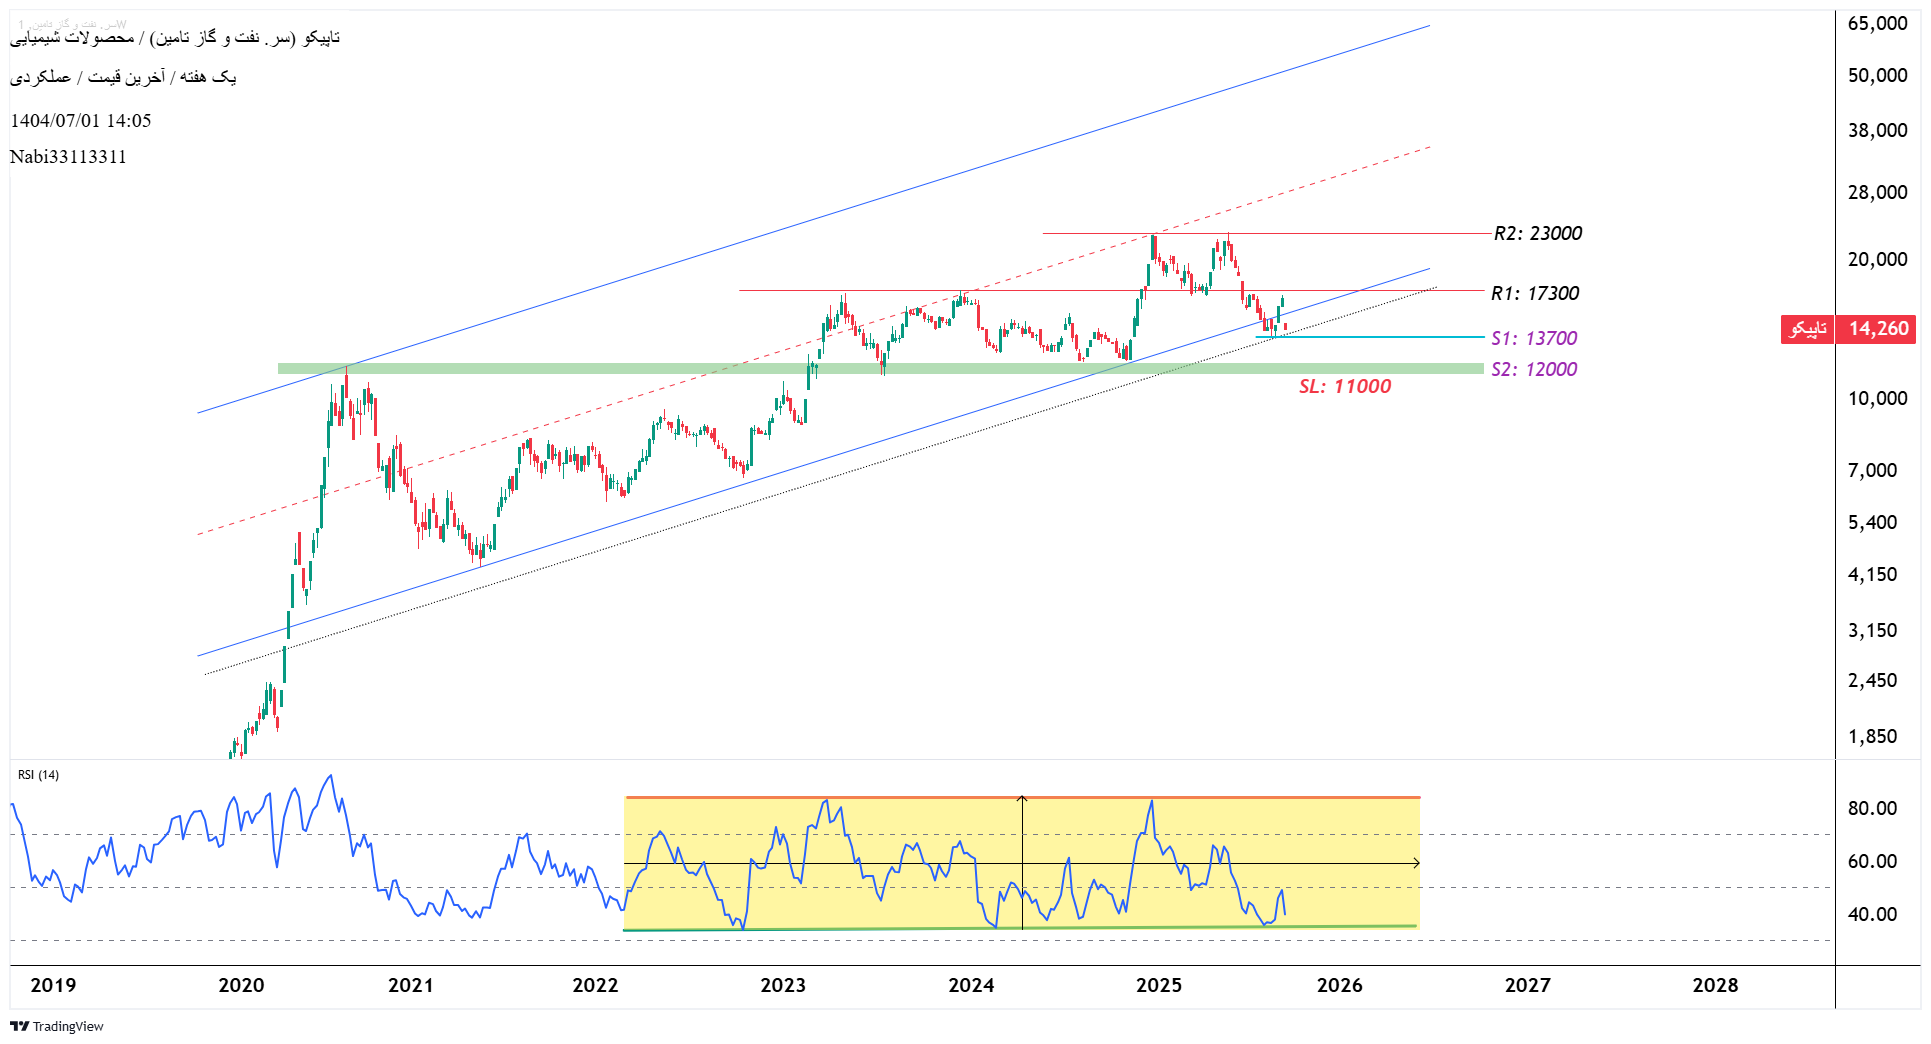
#Tapiko 1404/07/01 #Time_Frem_Complete (W) In the oil and gas chart with the #Tapiko Kendel Weekly, it is on the verge of supporting 13700 Rials. If the price fails to defeat and cross this range, the next support is 11500 to 12,000 Rials. If the price rises, important resistance can be considered 17300 and 23,000 Rials, respectively. ⚠️#Harmary can be slightly lower than the last support level around 11000 📌 One of the highlights of the RSI indicator fluctuation within a channel is now the RSI line approaching the floor. Share price at the time of analysis of 14260 Rials
Nabi33113311
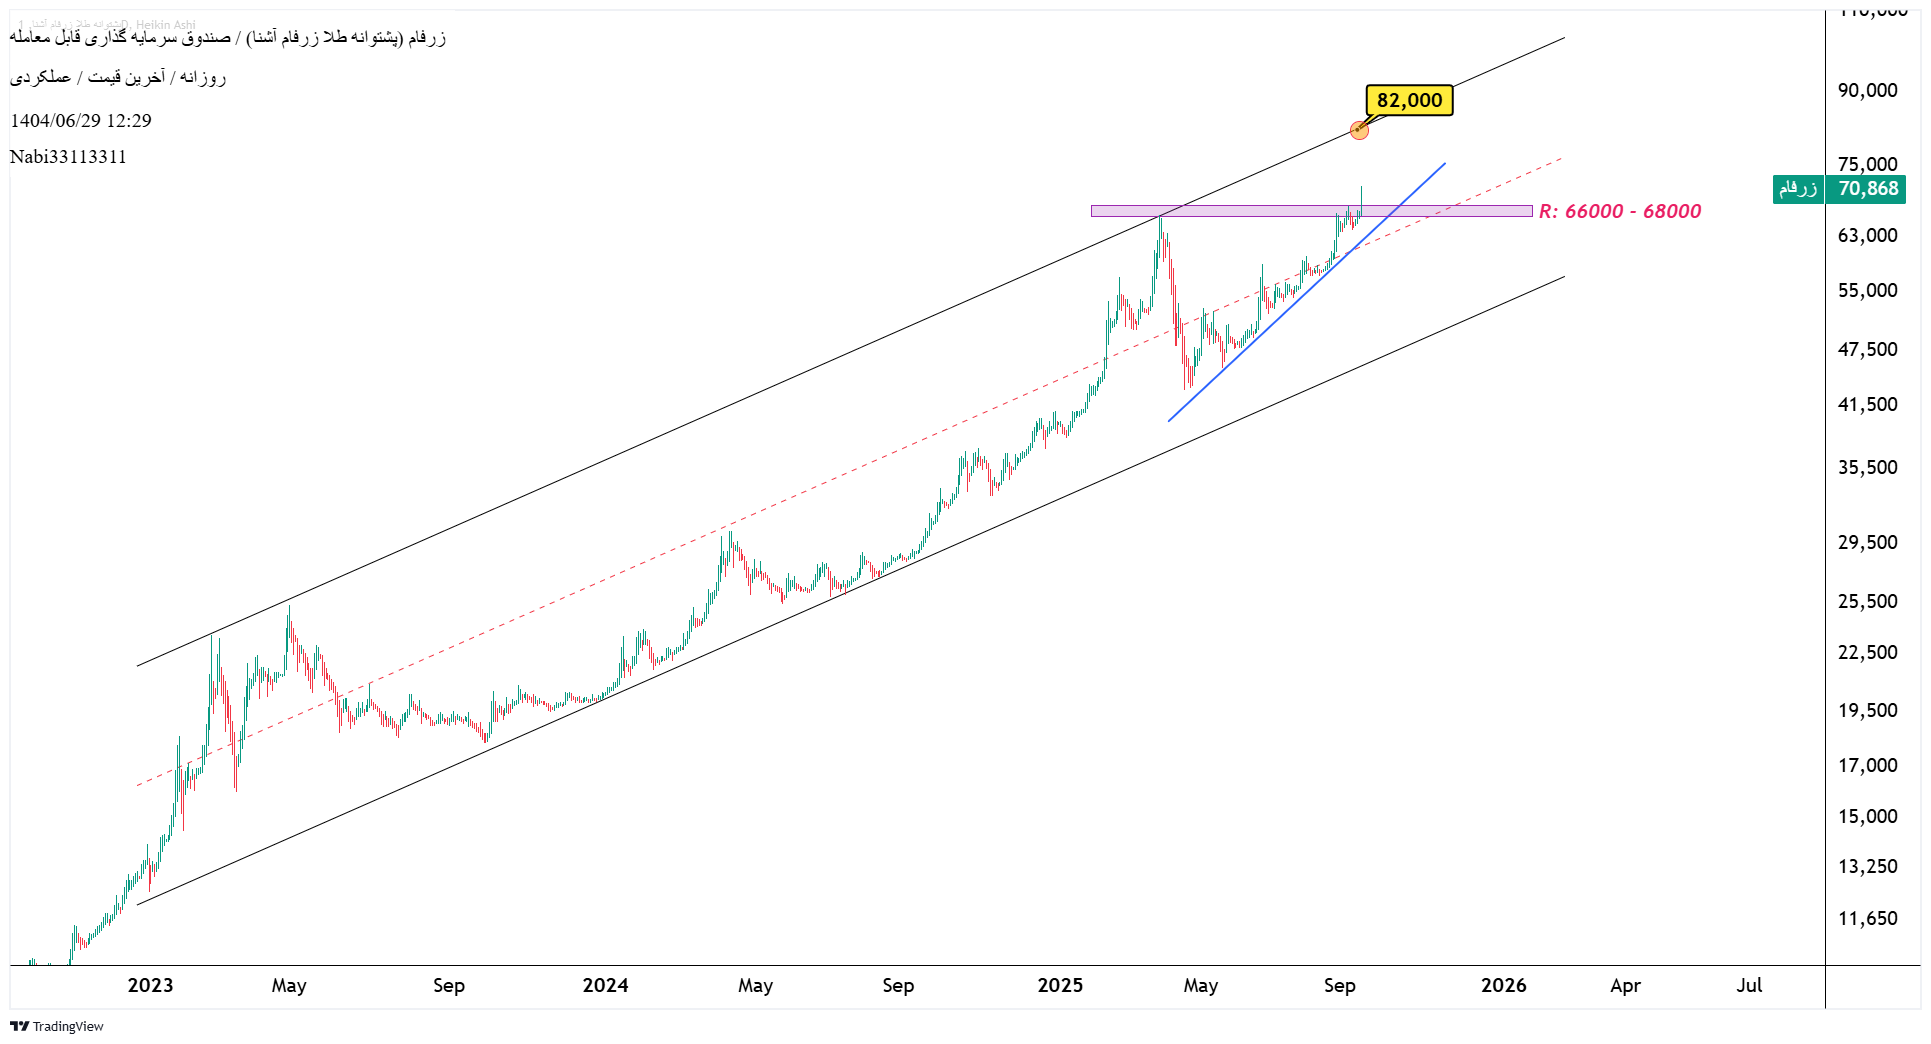
#Zerfam 1404/06/29 #Time_Frem_ Day (D) In the Zerfam Gold Back Investment Fund, the first goal can be considered around 82,000 Rials in the resistance range of 66,000 to 68,000 Rials. ⚠️ In case of breaking the uptrend line marked with blue and the price penetration under the resistive zone shown in the purple image, the analysis will be valid and fail. 📍 If the channel ceiling is broken and the price exits it, the above analysis will be re -updated to determine the next "possible" objectives of the above analysis. Current Price of Zerfam Gold Fund 70912 Rials
Nabi33113311
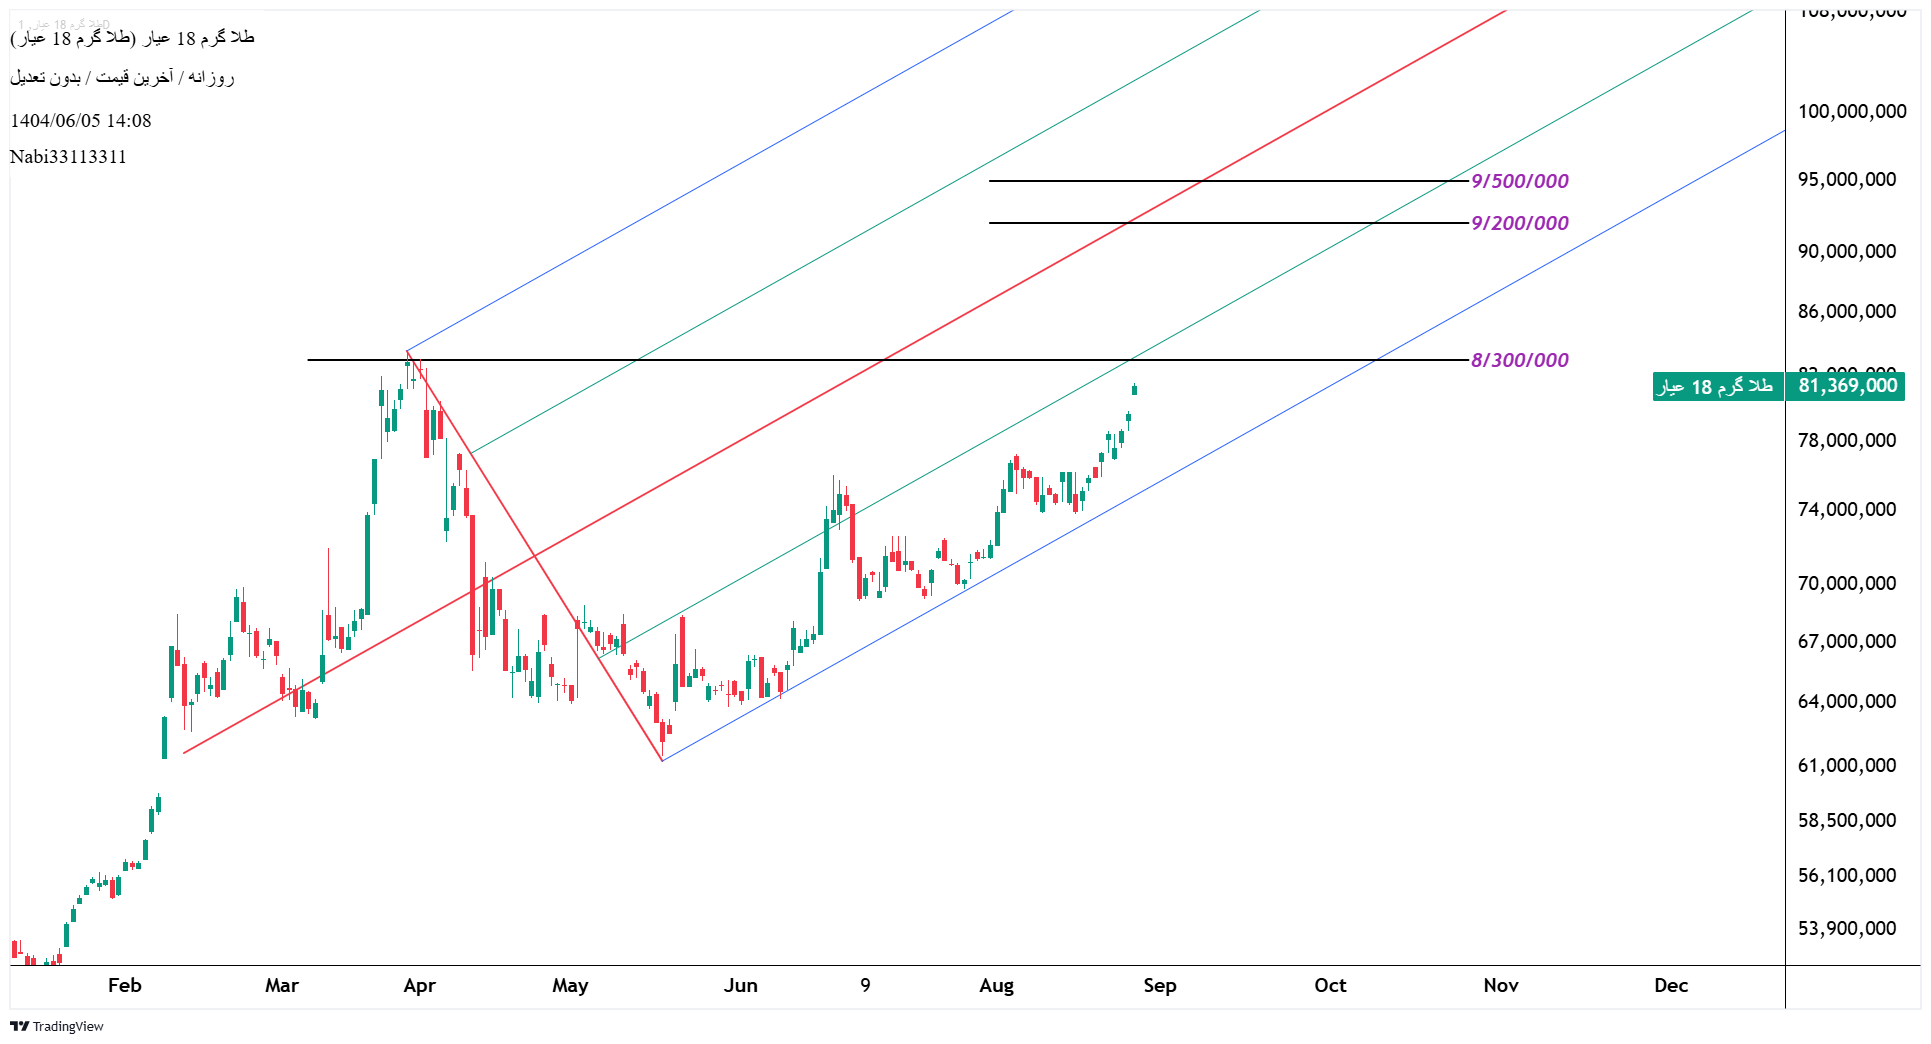
#Gold_18_Ayar 1404/06/05 #Time_Frem_ Day (D) In the event of failure and consolidation on the range of 8/350/000, the next possible target was around 9/200/000 to 9/500/000 Tomans. Current Price 81/369/000 Thousand Rials
Nabi33113311
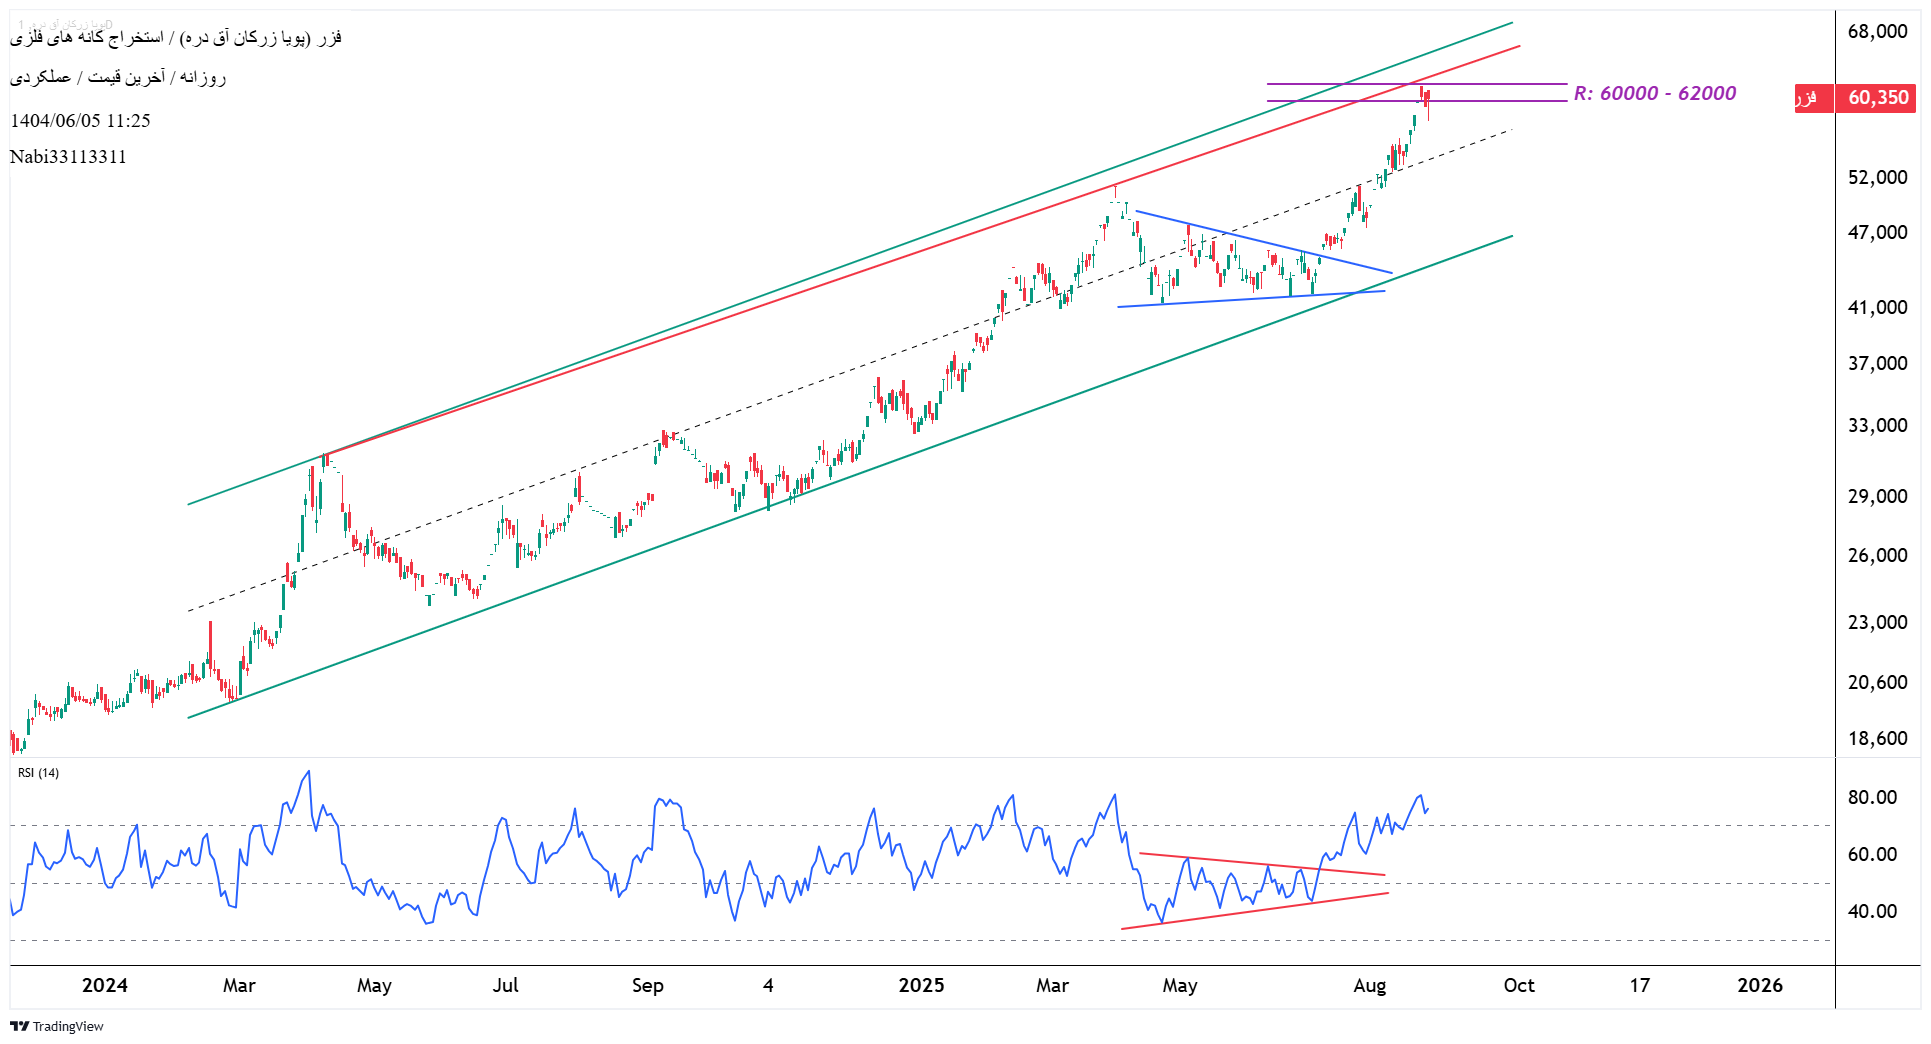
#Fazer 1404/06/05 #Time_Frem_ Day (D) Resistance of 60/000 to 62/000 Rials One of the interesting and remarkable points is the formation of the #Triangle -Triangle pattern on the price chart and the RSI indicator
Nabi33113311
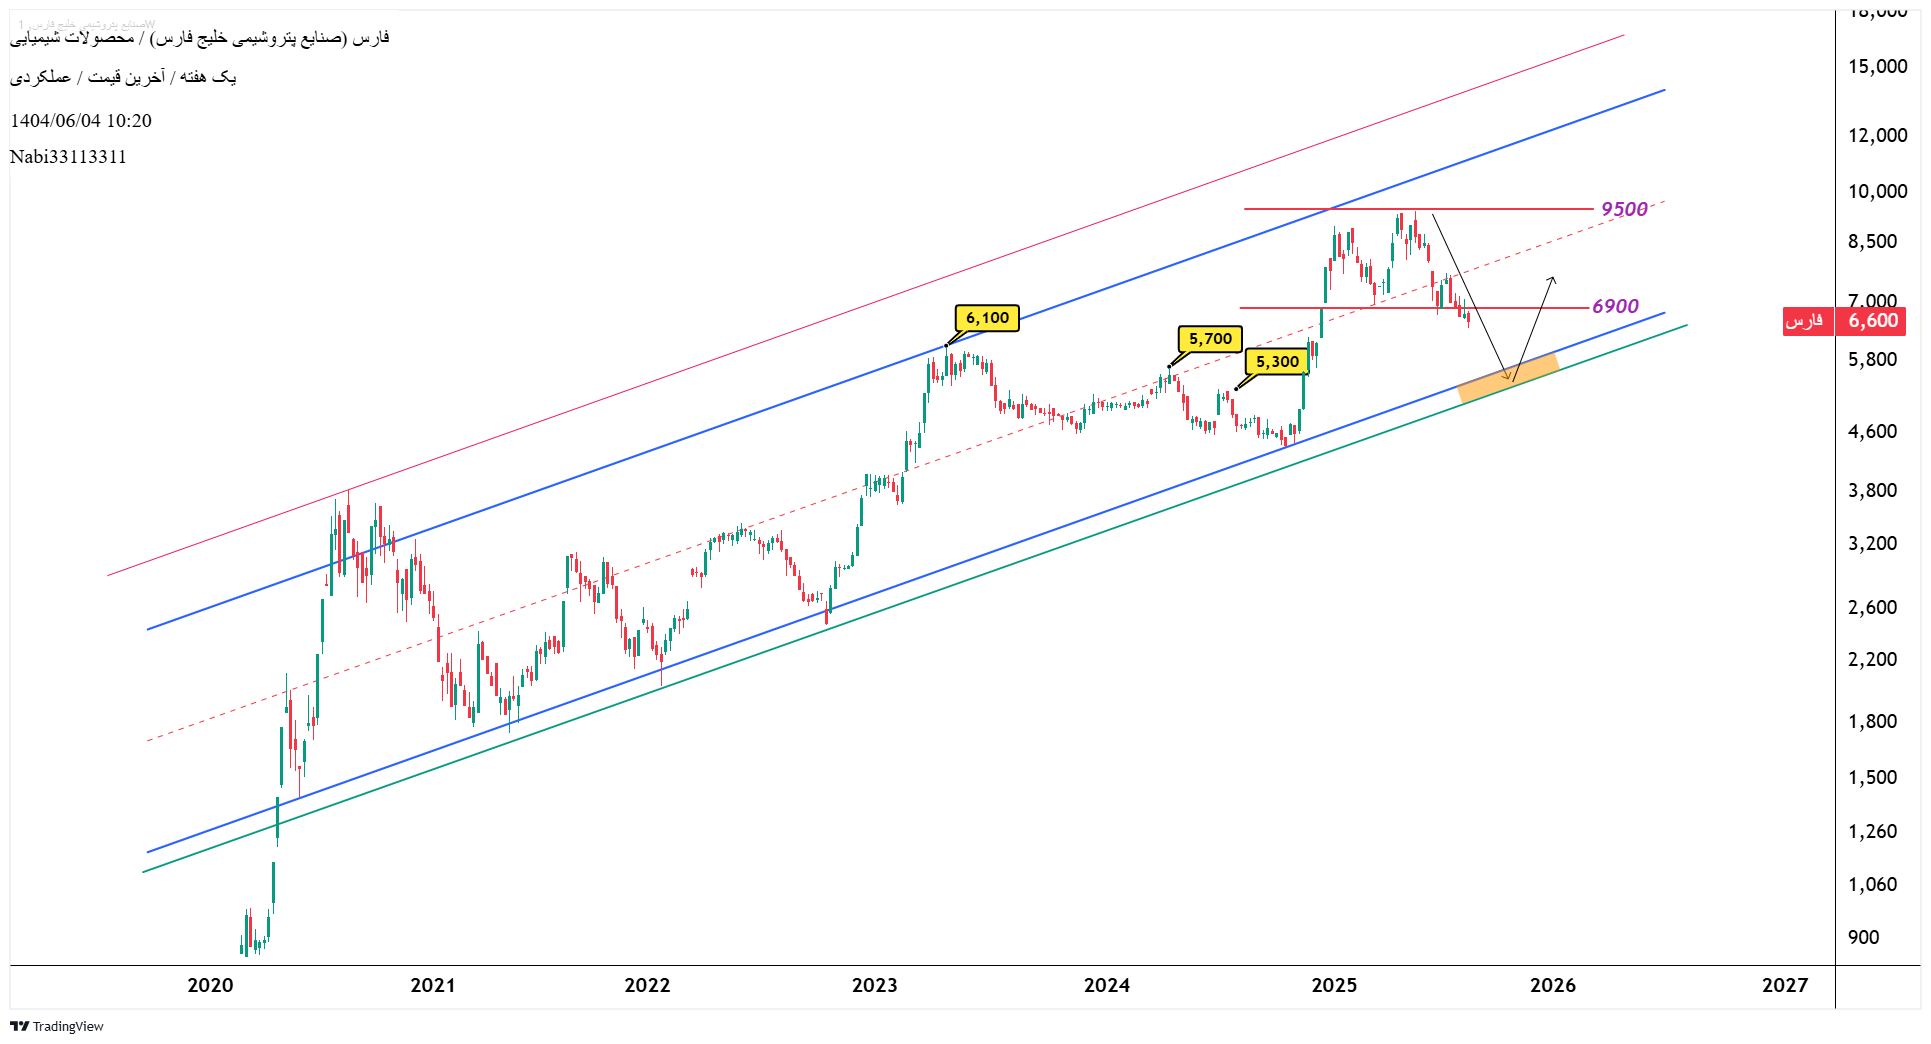
#Fars 1404/06/04 #Time_Frem_Complete (W) Support range of 5300 - 5700 Rials
Nabi33113311
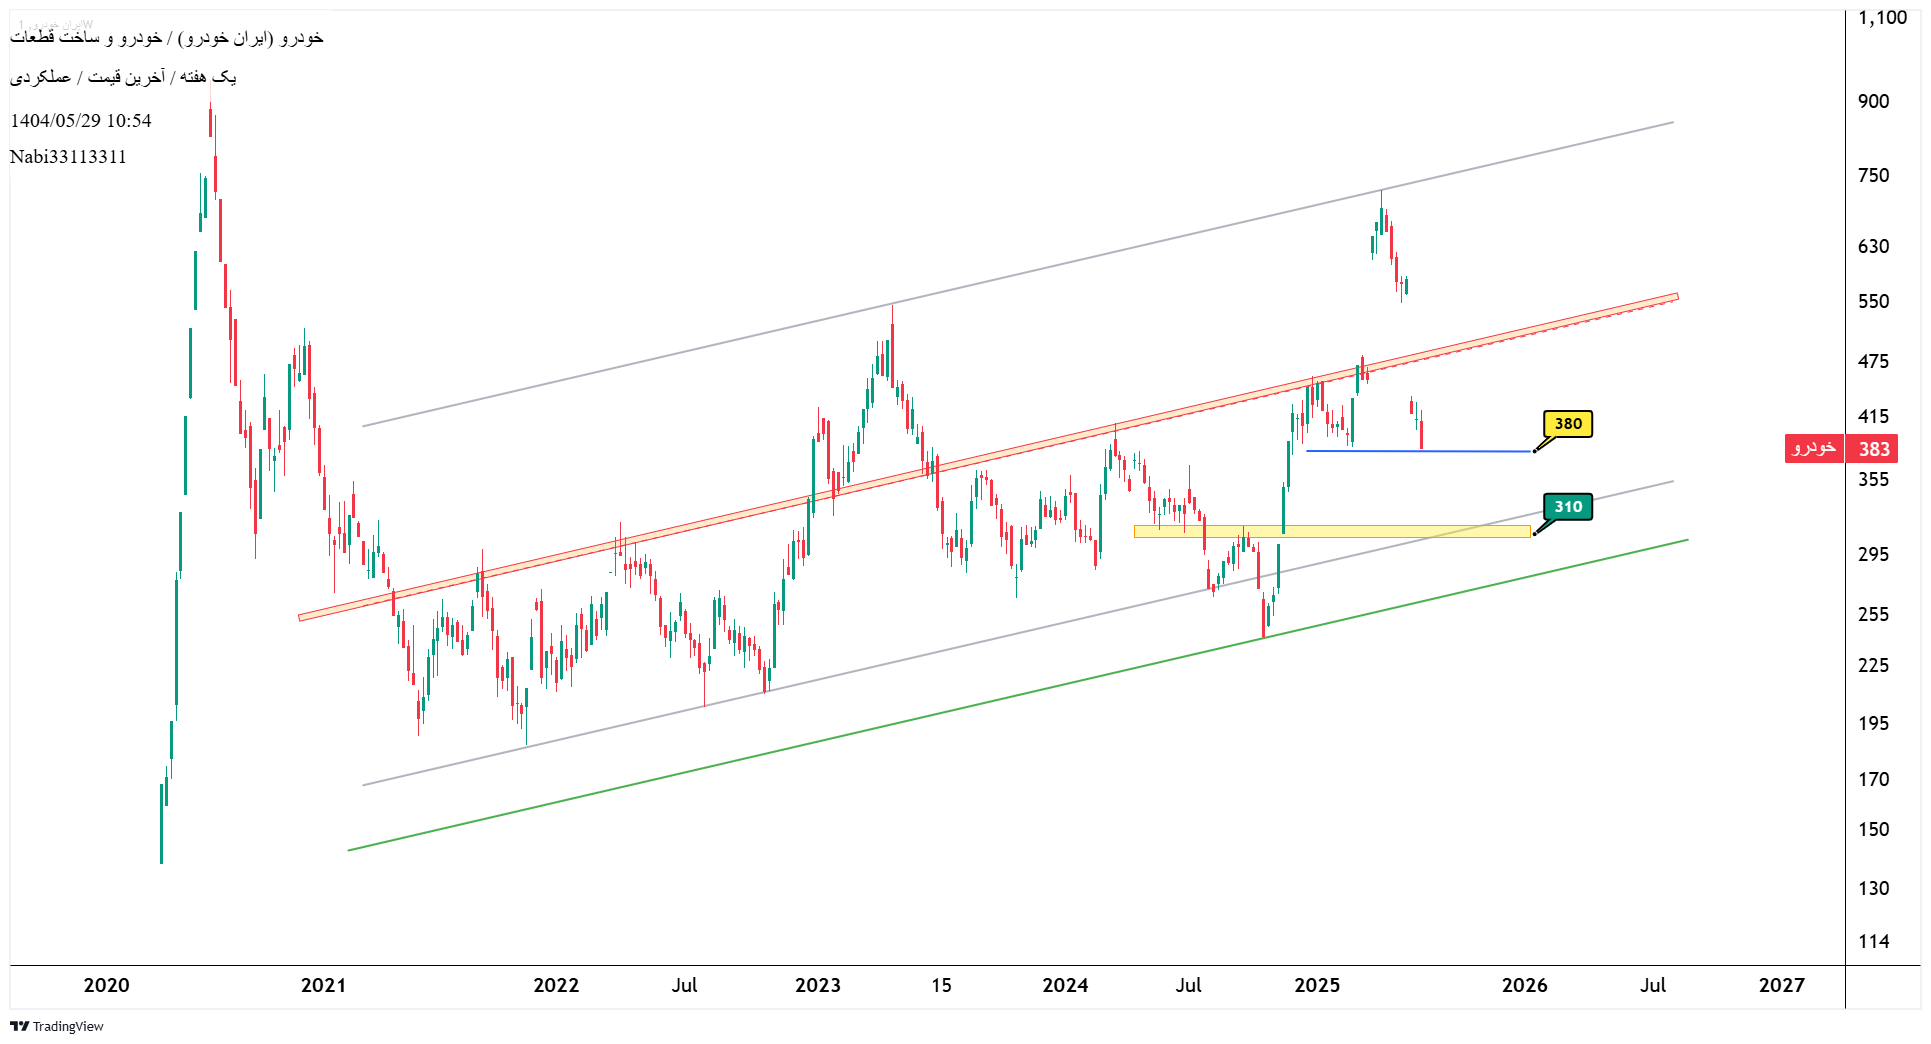
#Car 140405/29 #Time_Frem_Complete (W) The next support was about 380 rials if the support was lost and the price stabilization below the area was 380 Rials.
Nabi33113311
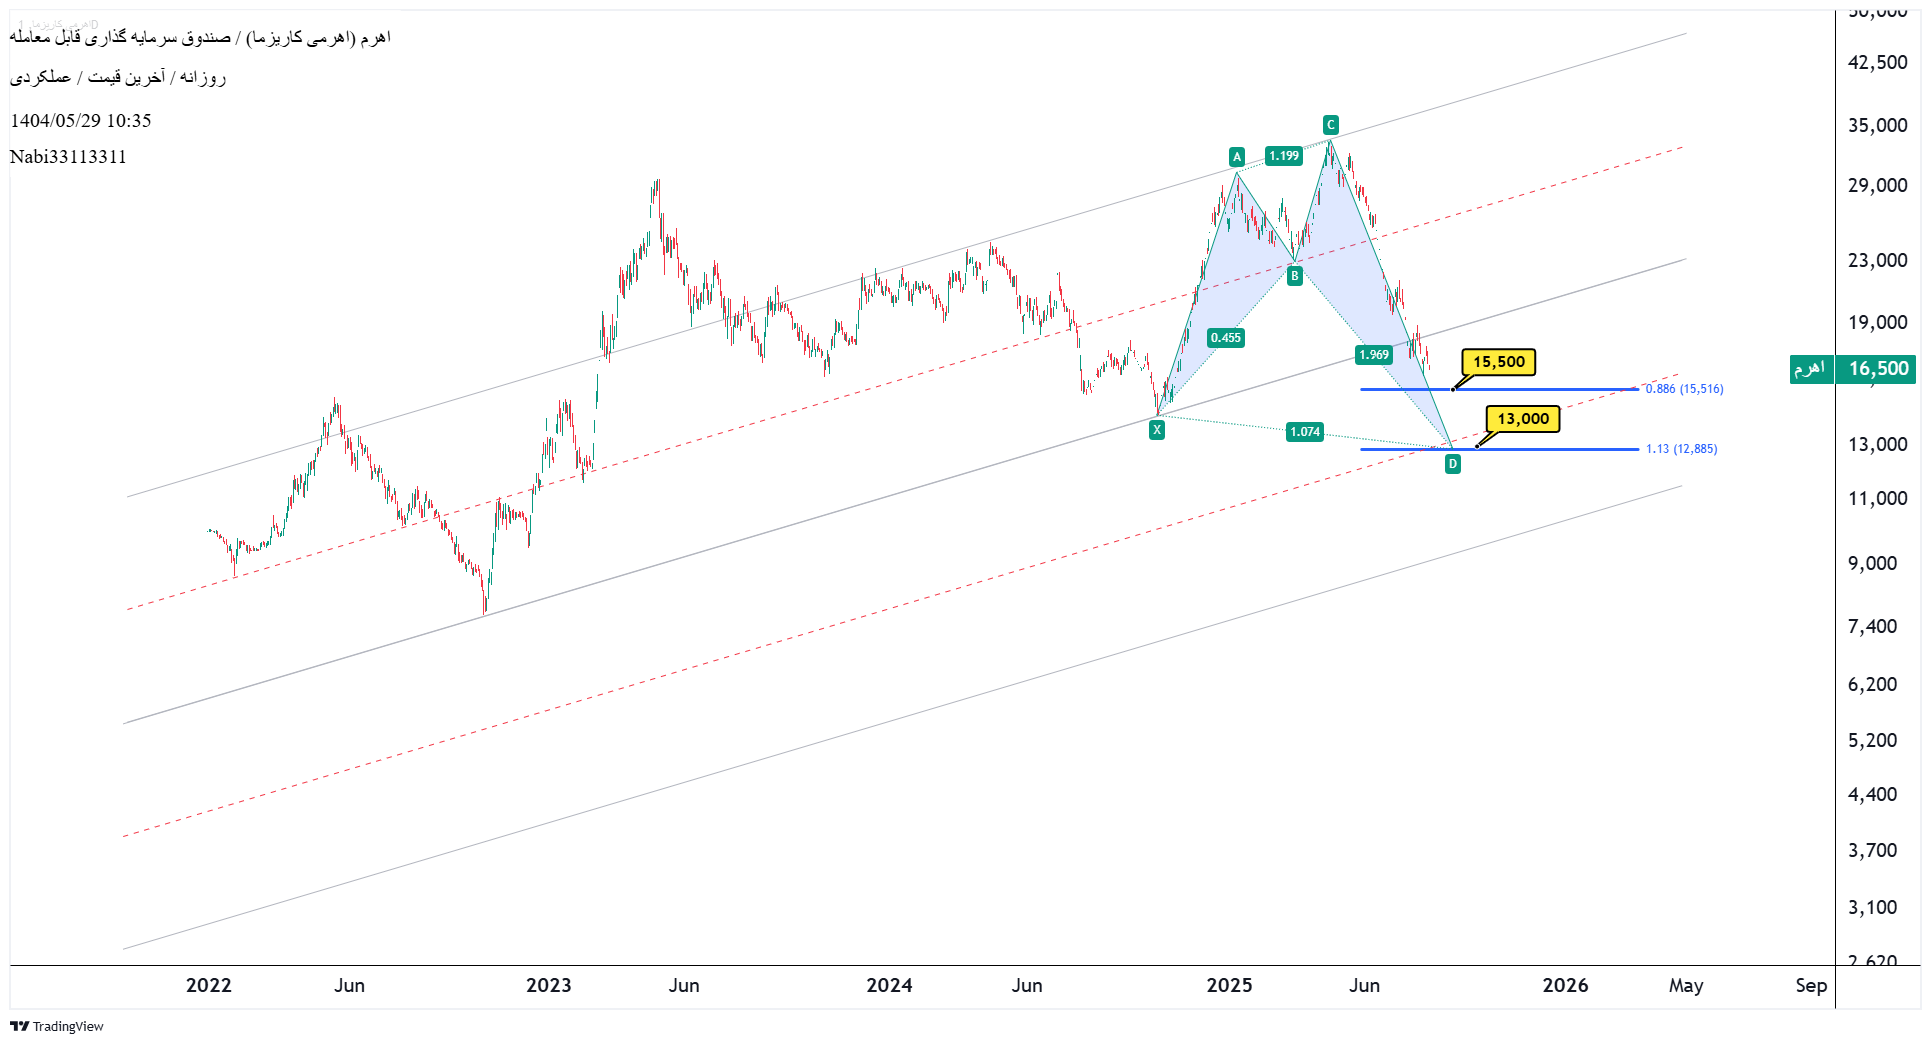
#140405/29 #Time_Frem_Day Forming #caps_consum on the lever icon The Bullish Shark Pattern is a harmonic pattern in the technical analysis that appears at the end of a downward trend, indicating the possibility of a price return to the uptrend. This pattern is seen in the form of the letter M English and consists of four waves: XA, AB, BC, CD Point D in this pattern is considered the point of completing the pattern and the start of the new uptrend. This point is usually in the range of 88.6 to 1.13 % of the XA wave.
Disclaimer
Any content and materials included in Sahmeto's website and official communication channels are a compilation of personal opinions and analyses and are not binding. They do not constitute any recommendation for buying, selling, entering or exiting the stock market and cryptocurrency market. Also, all news and analyses included in the website and channels are merely republished information from official and unofficial domestic and foreign sources, and it is obvious that users of the said content are responsible for following up and ensuring the authenticity and accuracy of the materials. Therefore, while disclaiming responsibility, it is declared that the responsibility for any decision-making, action, and potential profit and loss in the capital market and cryptocurrency market lies with the trader.