Karim67a
@h_Karim67a

What symbols does the trader recommend buying?
Purchase History
پیام های تریدر
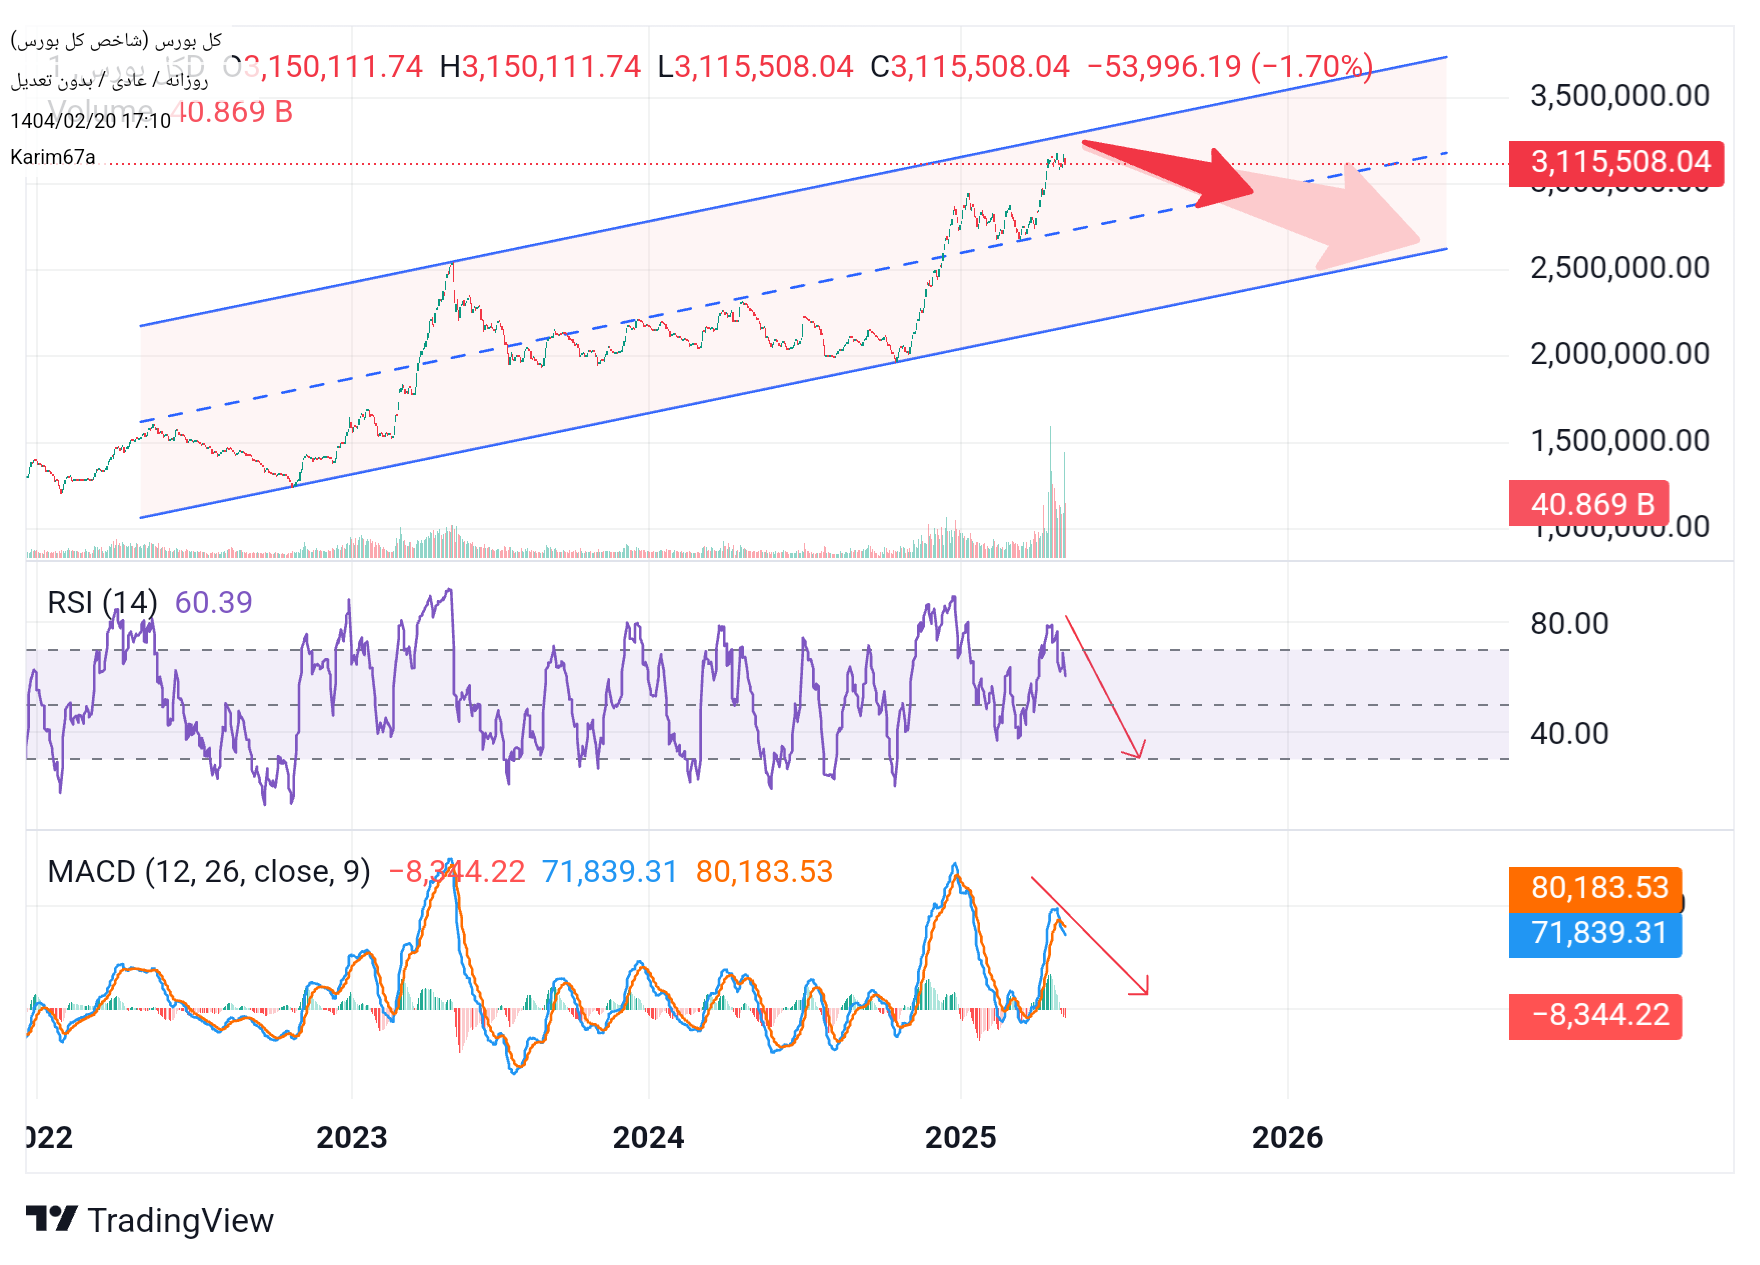
شاخص_کل_بورس

📊 Technical Analysis of the Stock Exchange Index Time Freight: Daily 🕯 Focus on the last candlestick (the right side of the chart) --- Kendel Last Profile: The red candle is relatively short and the upper shade is long. The initial price is close to the highest price of the day, but the market has fallen and closed down. The volume of transactions is relatively similar to the previous day, and there is no significant change in the power of buyers. --- 🧩 Pattern review: The last candlestick can be placed in the category of "Weak Shooting Star", but because the body is slightly larger than usual, the classic shooting pattern is not fully formed. However, the combination of this candlestick with the previous green candle can be a warning of temporary growth or the onset of short -term correction. --- 🔍 Key points: ✅ Sales pressure is evident in the upper area, as the price has not been stabilized at high levels. There is no strong recurrent pattern, but there are signs of weakness in buyers' power. 📌 Today Kendell is a kind of "alert", not a return to return. The market needs approval the next day. --- 🧠 Professional Summary: > Last candlestick with a high shade and a descending body indicate price rejection of resistance and decreased buyers' power. If the next candle is down, one can expect a short -term correction or a rest phase. Otherwise, the re -defeat of the recent ceiling and the continuation of the upward trend is likely.
شاخص_کل_بورس
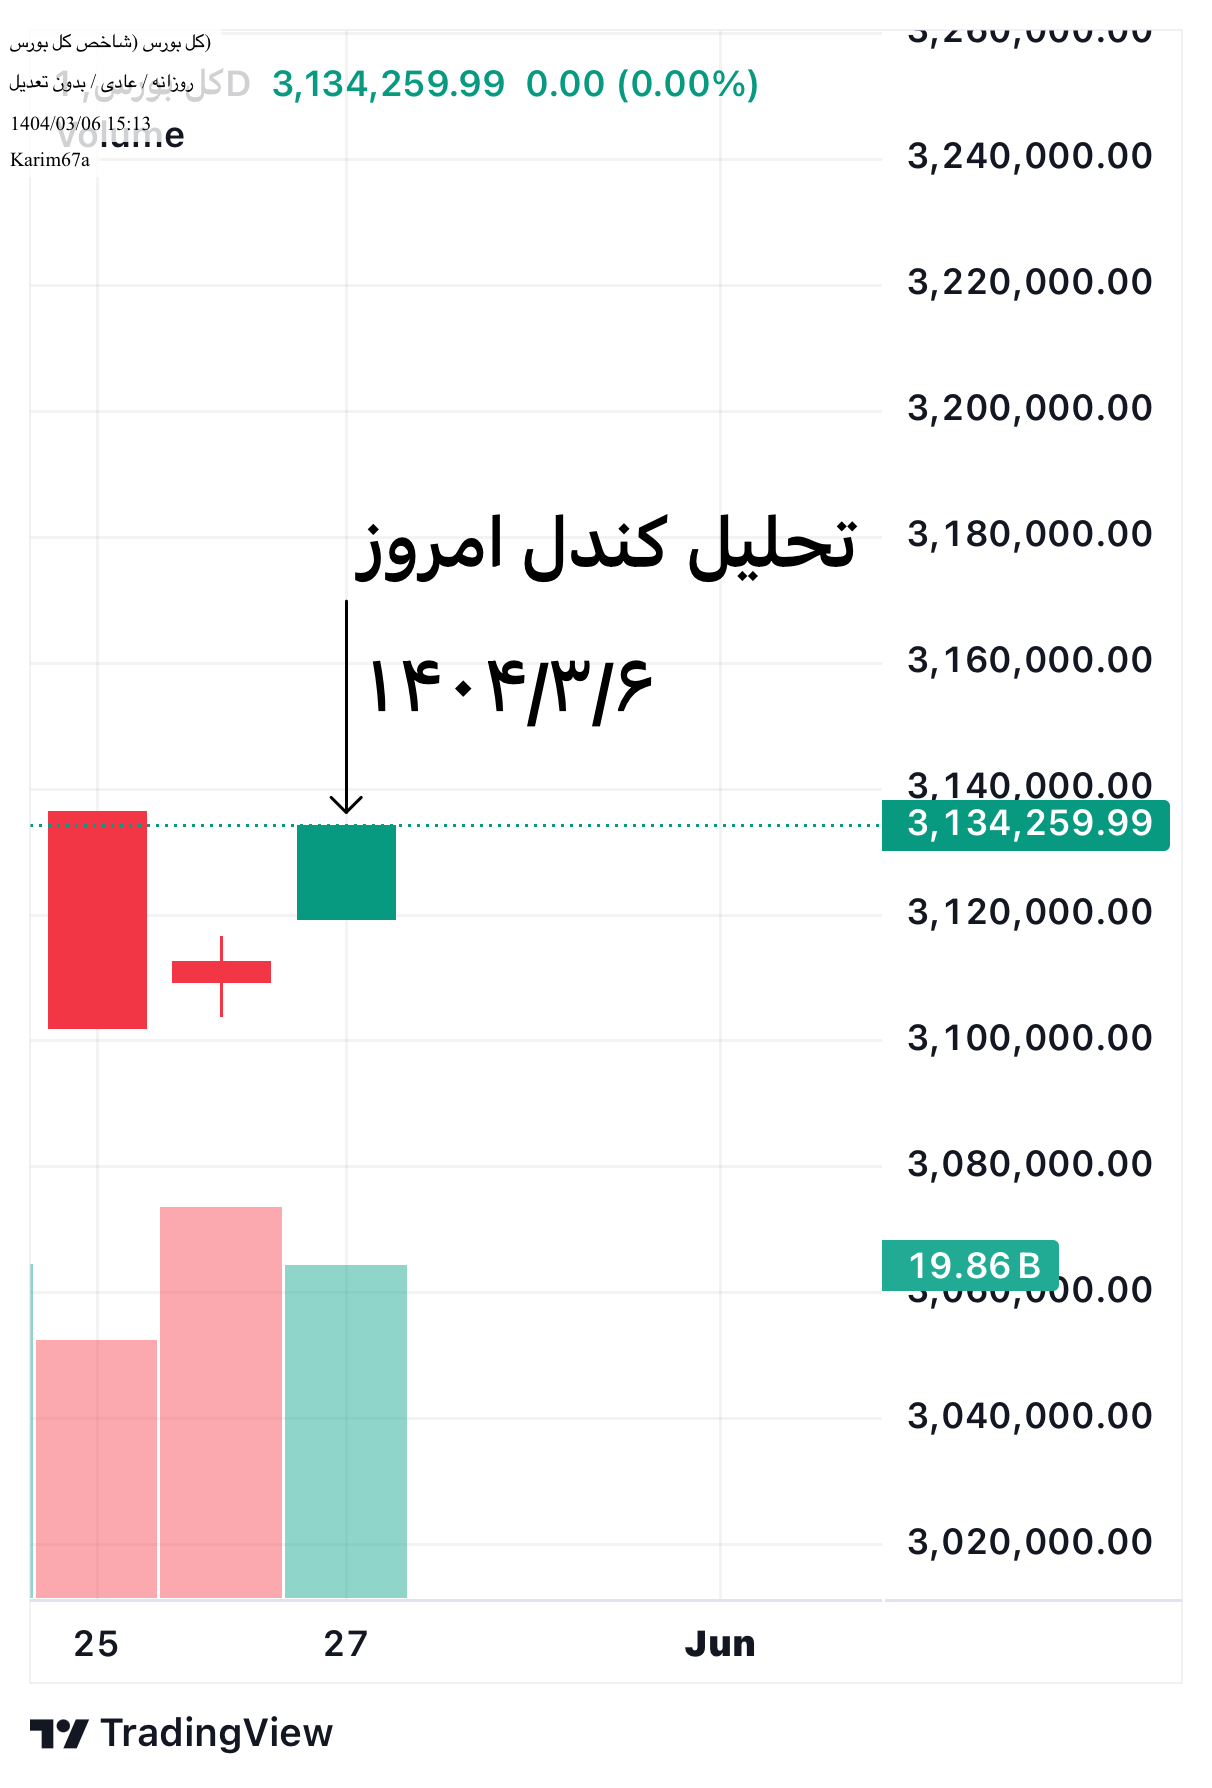
🔍 Analysis of Kendel today June 6: ✅ Kendell Type: Green candle with a small body, which is formed after a Duji candle, can be a sign of market effort to return. ✅ Kendel position: • This candle is formed in the lowest price range (about 0.5 to 2.5 units). • After a heavy red -descending red candlestick, and then Dodie, we now have a green candle; this compound is usually considered as a potential return pattern (especially if the next candle is strong green). ✅ Trading volume: In the last candlestick, the volume of transactions is almost average compared to the previous days, indicating that buyers have not yet fully entered, but sales pressure has decreased. ⸻ 📈 Initial conclusion: The pattern of the Three Kendley formed (a strong descending, duo, and now short green candle) can be a sign of the end of sales pressure and the start of a gentle return; But we still have no definitive confirmation of the upward return. ⸻ When is the definitive signal exported? If tomorrow or one couple of the next day: • Formed a stronger green candle with greater volume • Break the resistance of the range of 1.2.1 Then it can be said that the market has entered the return phase or at least one short -term ascending wave
شاخص_کل_بورس
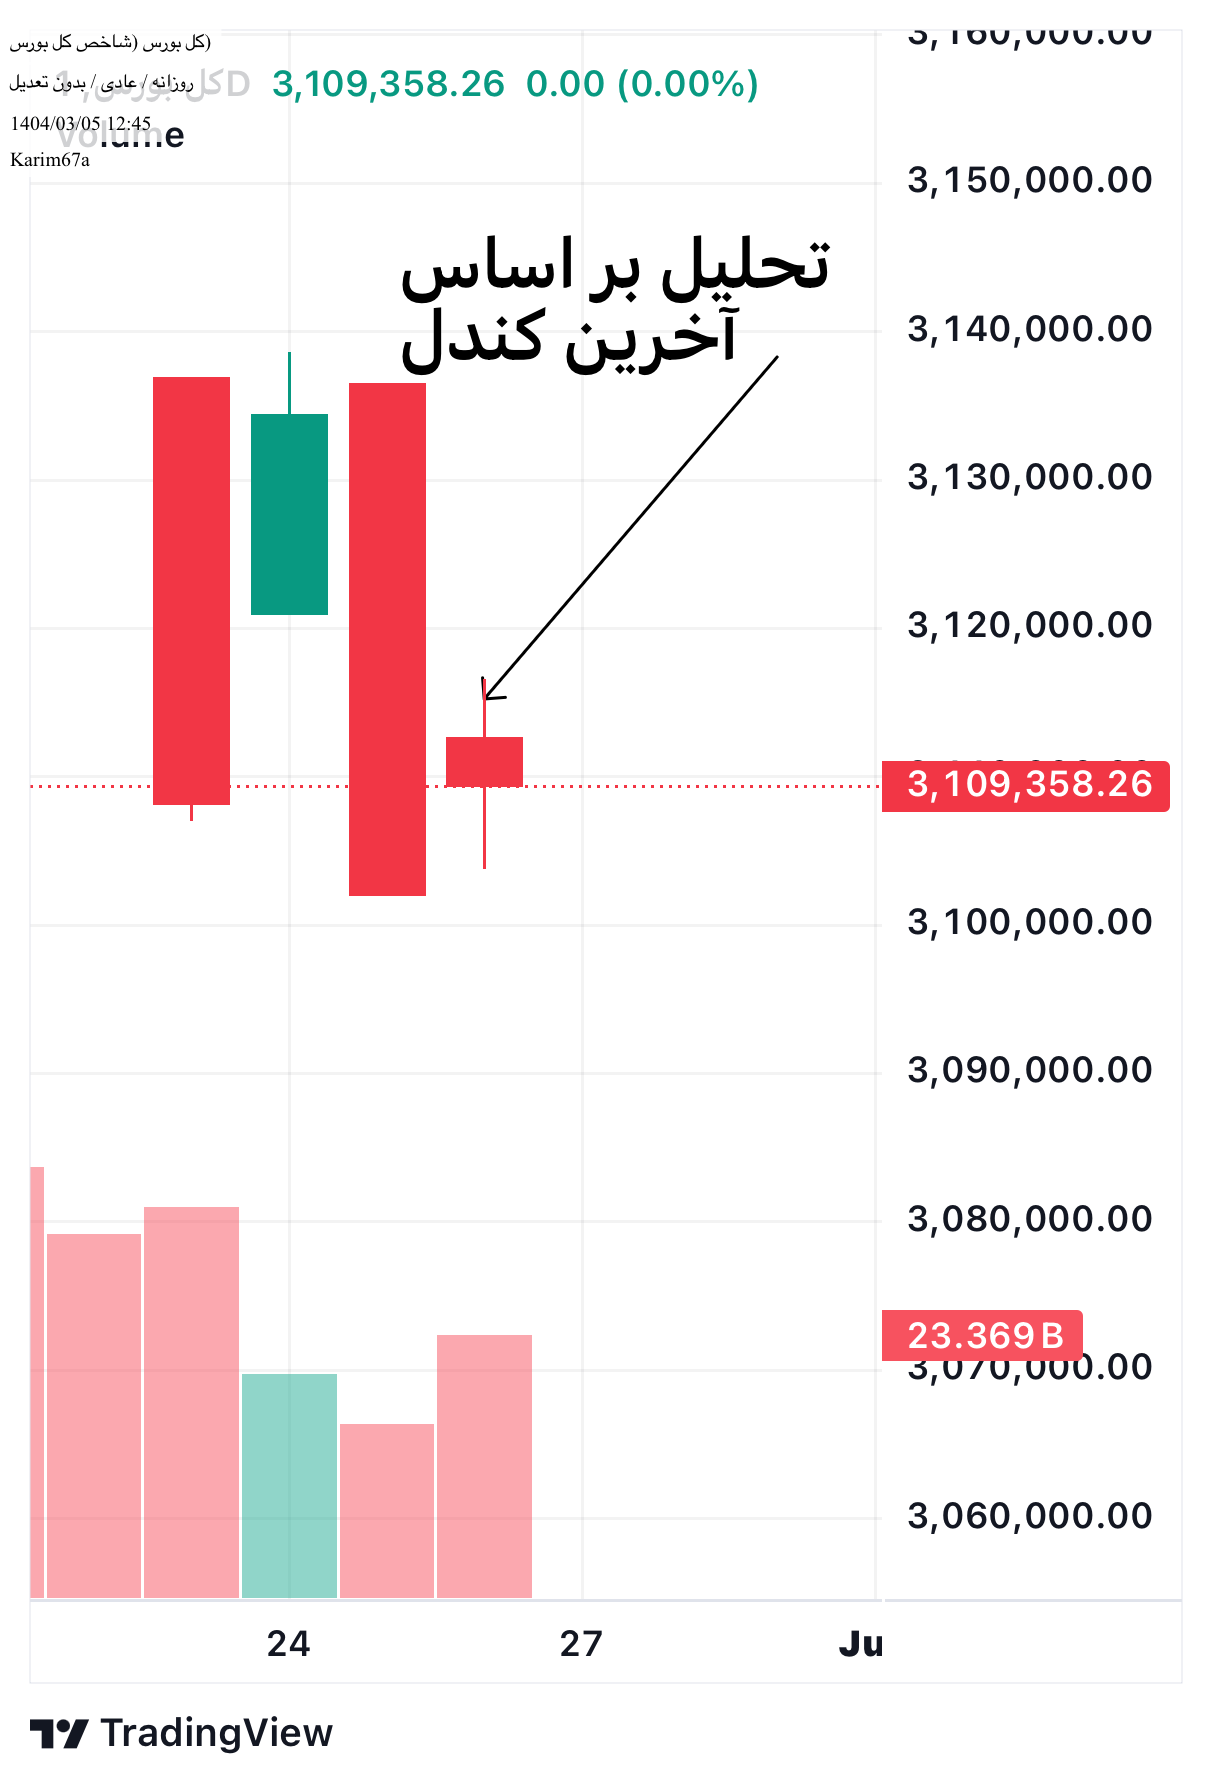
Analysis of the last candlestick: • Kendell Type: Descending (red), with medium body and upper and lower shades. • Position: Kendell is formed in an area with important support around 1.2 ° C. • Low shade taller than above: It shows that the sellers had control during the day, but buyers prevented further. • Transaction volume lower than the average of the previous days: Sellers' power has declined or the market is waiting for important news. ⸻ 🔍 Technical signal: • This candle is similar to a duplicate candle or descending spinning that appears in the support zone; If the next candle is positive and strong, it can be a sign of temporary return. • But if the next candle is also a strong descending with breaking the range of 4.1.1, the likelihood of the downward trend will continue. ⸻ 📉 Conclusion: 1. The sensitive support of the support is in the range of 1.2 to 2.5 units. 2. The next handle is decisive: • If positive and strong is closed → the market is likely to return. • If the negative and below 4.1.1 closes, the likelihood of falling will increase to 4.1 or even lower. 3. The low volume shows that the market is in a doubtful and there is no decision by buyers or sellers.
شاخص_کل_بورس
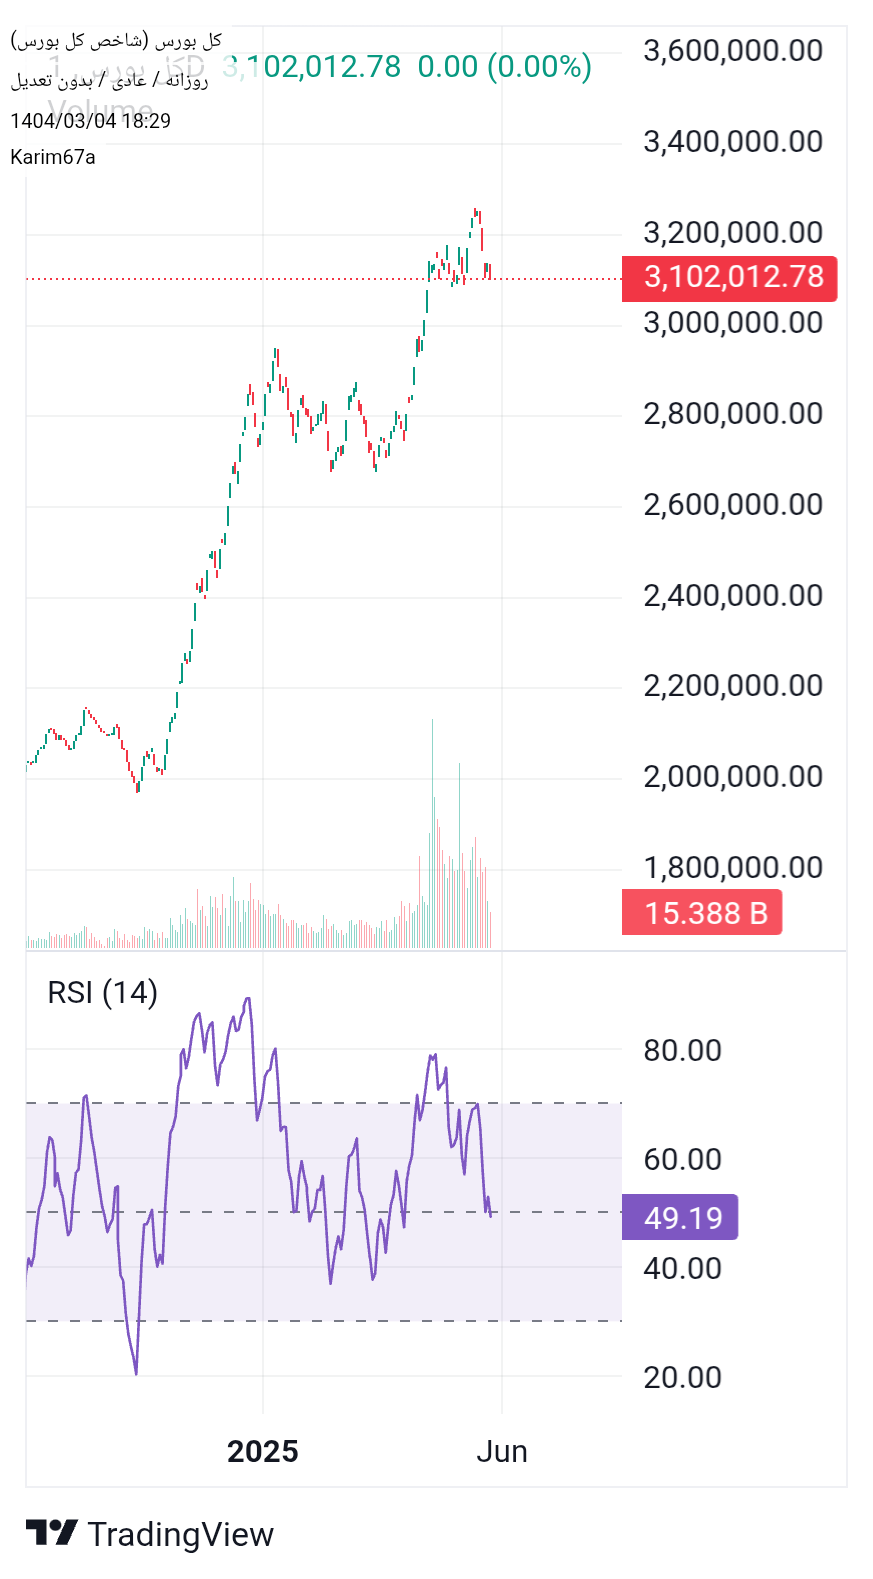
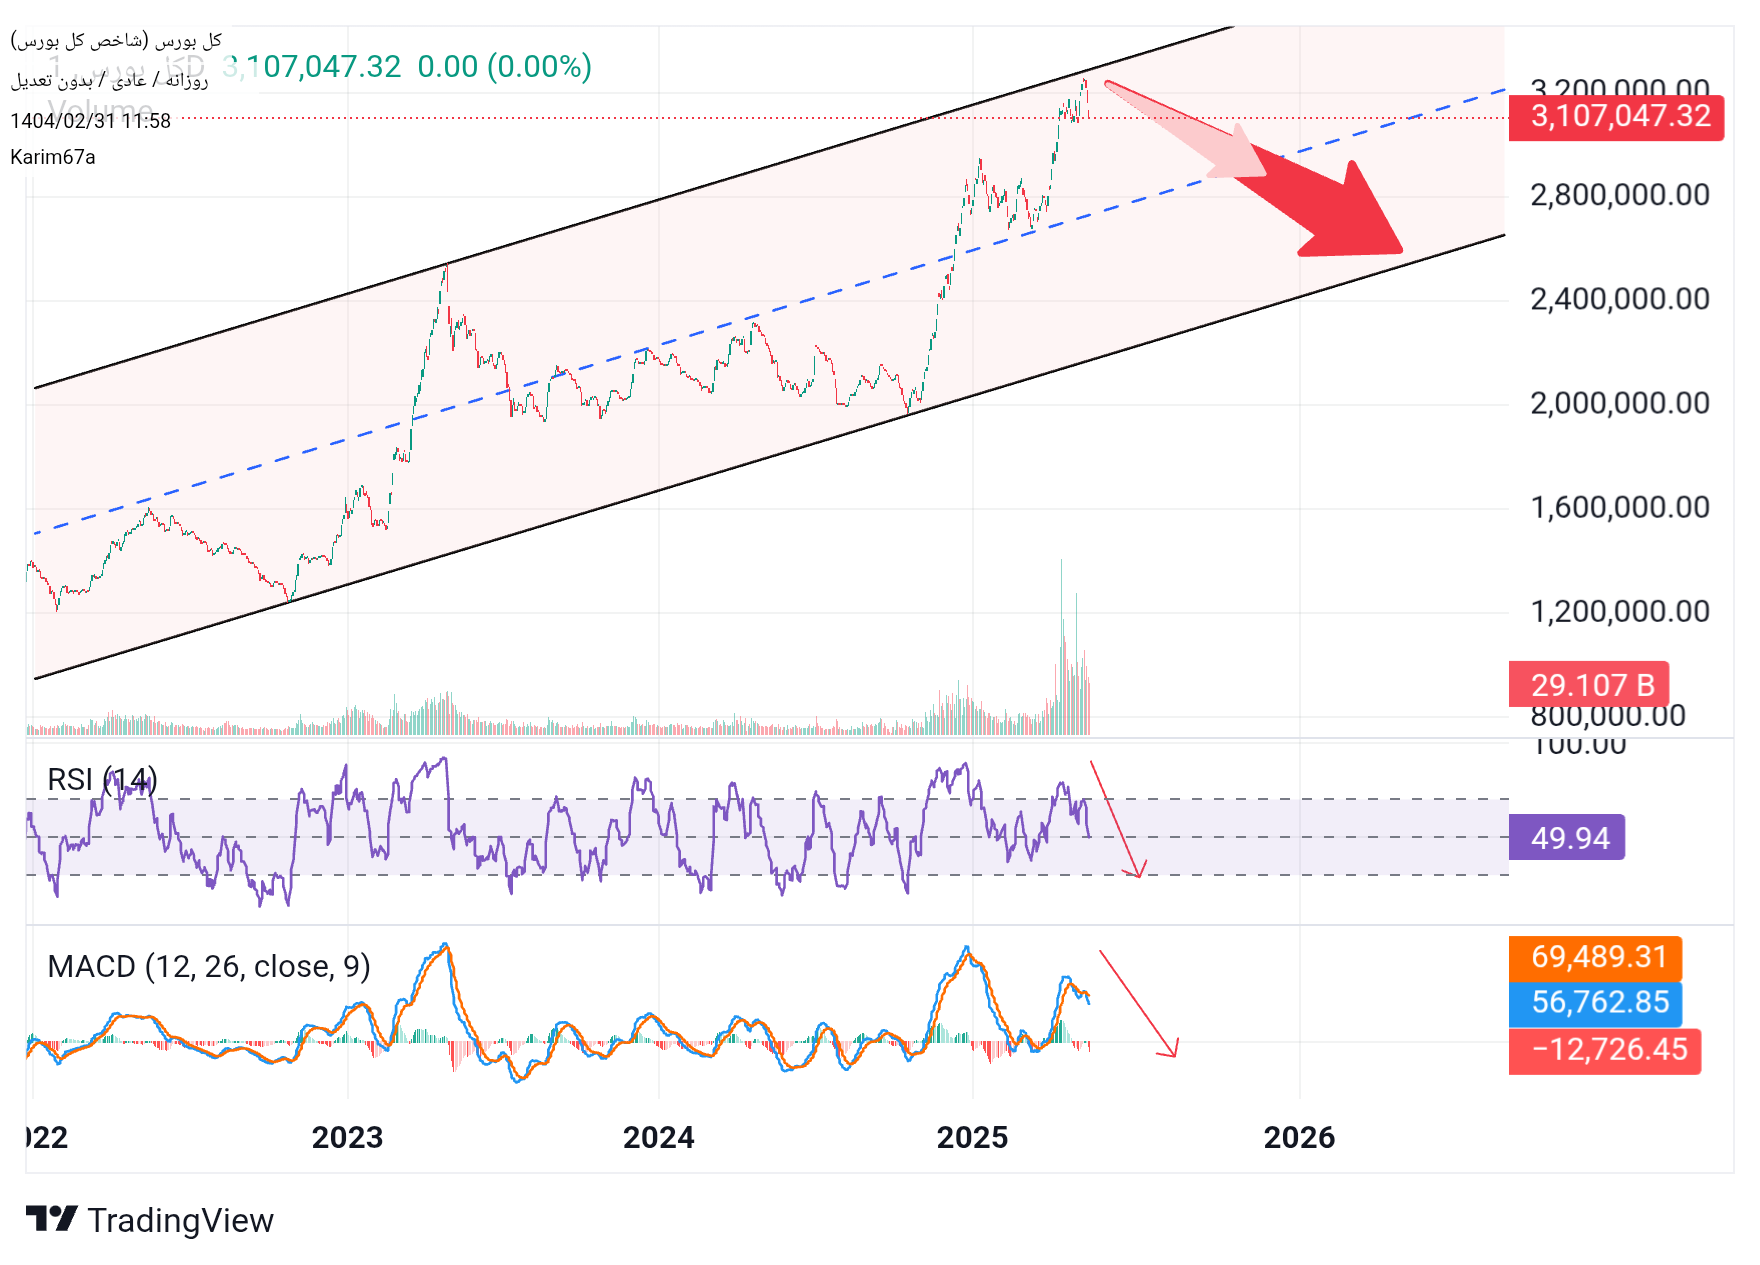
Technical Analysis of Stock Exchange Index based on RSI Indicator The RSI (Relative Power Index) is one of the most commonly used technical analysis tools that shows the relative power of buyers and sellers in the market. This indicator fluctuates between 1 and 2, and its key levels are as follows: More than 1: Buy saturation zone (possibility of price correction) Less than 1: Sale saturated area (possibility of price return) Between 1 and 2: Balance Area (Neutral Market Behavior) --- Current Status of RSI: Current Indicator value: 1.2 Located in the middle area (between 1 and 2) The downtrend from the range above 1 to 2 indicates the weakening of buyers' power. The overall index has now entered a phase of rest and caution since the recent powerful growth. If RSI falls below 1 and then 2, it can be a serious warning of the possibility of pricing starting. As long as the RSI remained between 1 and 2, the market situation is considered neutral. --- Summary: Currently, there is no definitive purchase or sale signal. The indicator's tendency to reduce, strengthens the need for caution in new ones. If you fail the range 2, it is best to pursue buying situations or take risk management more seriously.
شاخص_کل_بورس
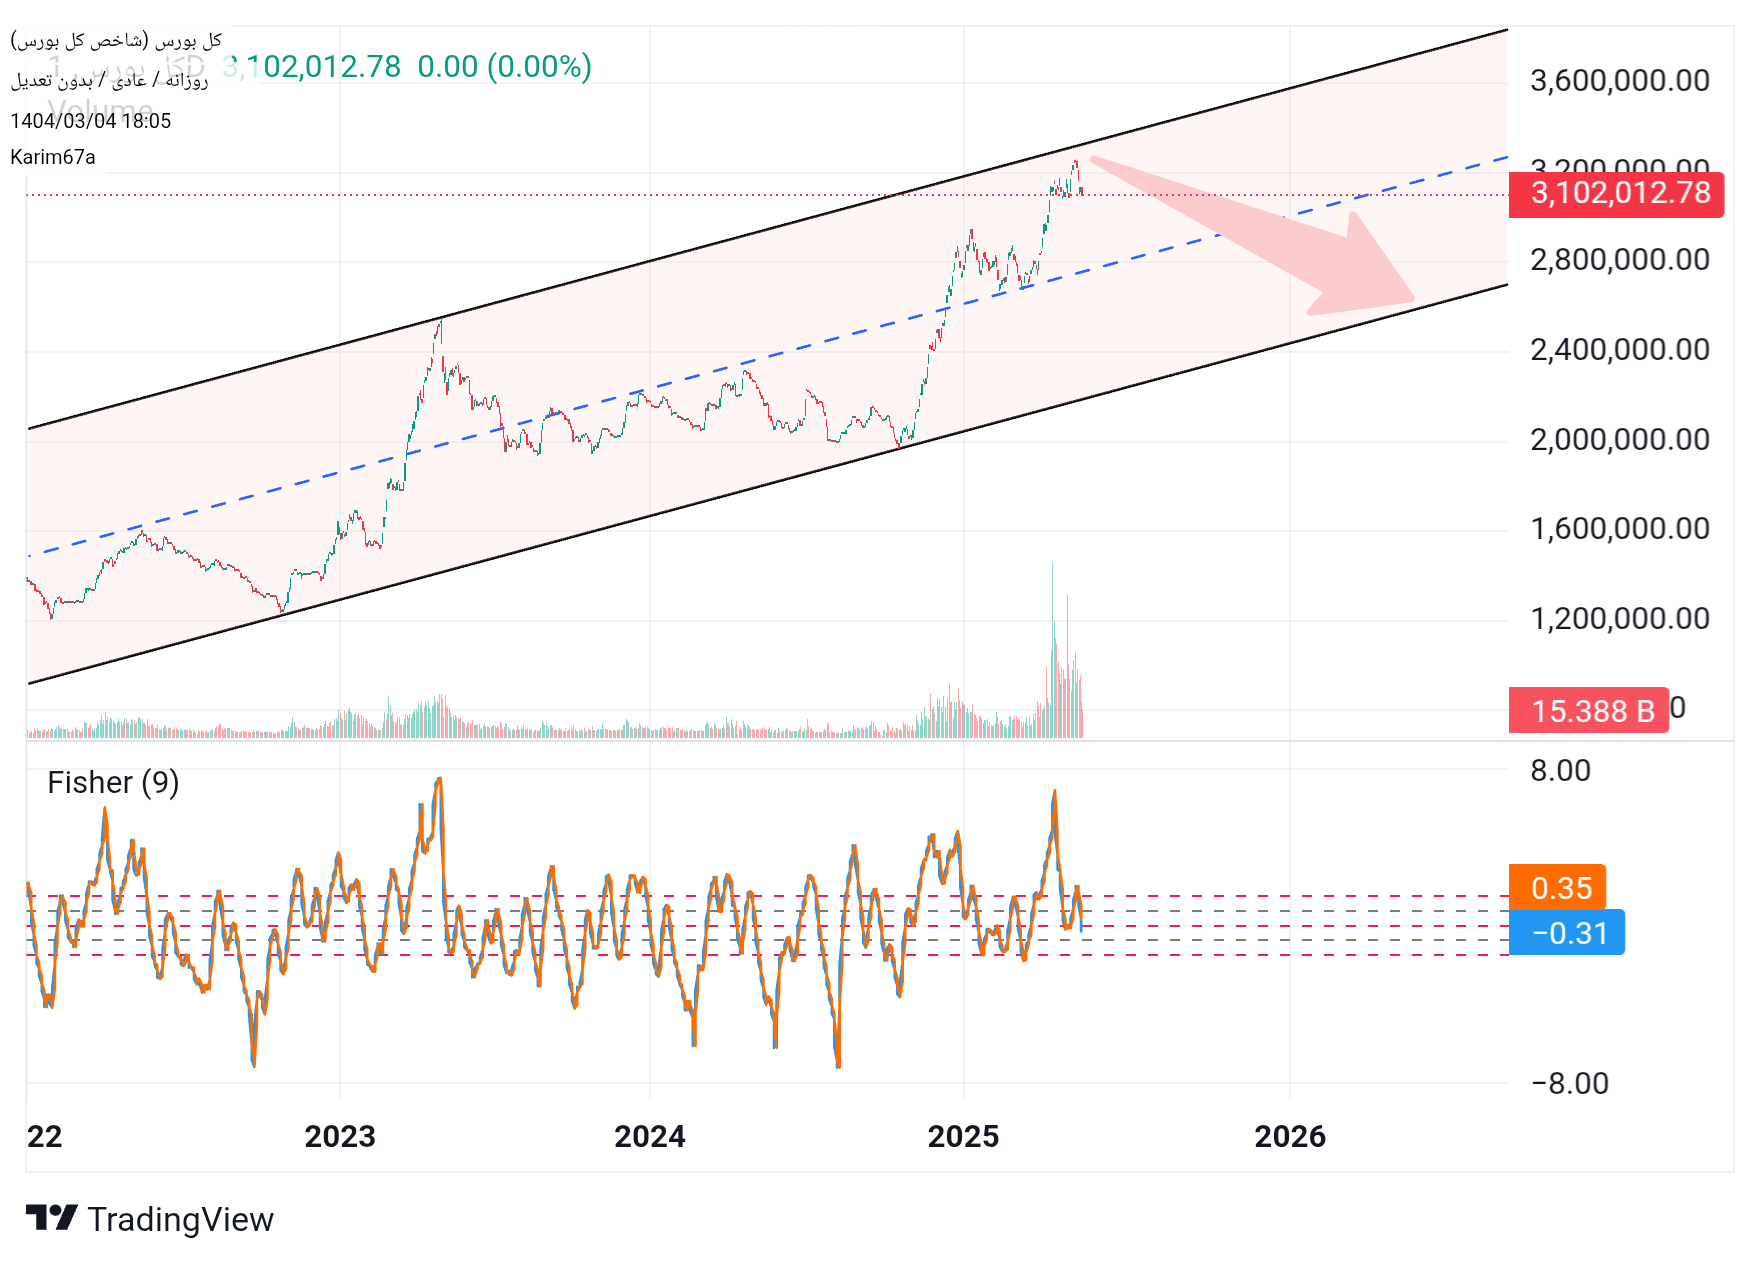
Analysis based on Fisher Transform indicator: The Fisher Transform Indicator is one of the most commonly used tools in technical analysis that allows for more accurate identification of market rotation by converting price data into a normal distribution function. This indicator is particularly used in the recognition of saturation and saturation areas as well as the issuance of return signals. Current Status Indicator: Fisher value: about 0.5+ Signal line value (TRIGGER): About 1 Given the relatively large distance between the two lines, the market seems to be at a stage of the inadequacy and expectation to determine the new path. Signal Analysis: 1. Fisher's decline from higher areas and its gradual decline is a sign of the weakening of the recent uptrend. 2. If the Fisher penetrates below the Trigger line, this situation can be regarded as a sales signal. 3. Given that Fisher is still in the positive area, the mid -term market trend is still upward; But there are signs of short -term correction. Summary: The market has entered the correction phase in the current situation. If the Fisher line passes below the Trigger line, the short -term exit signal will be reinforced. It is recommended to avoid heavy entry into the market and activate the profit or loss limit if the definitive situation is determined.
شاخص_کل_بورس
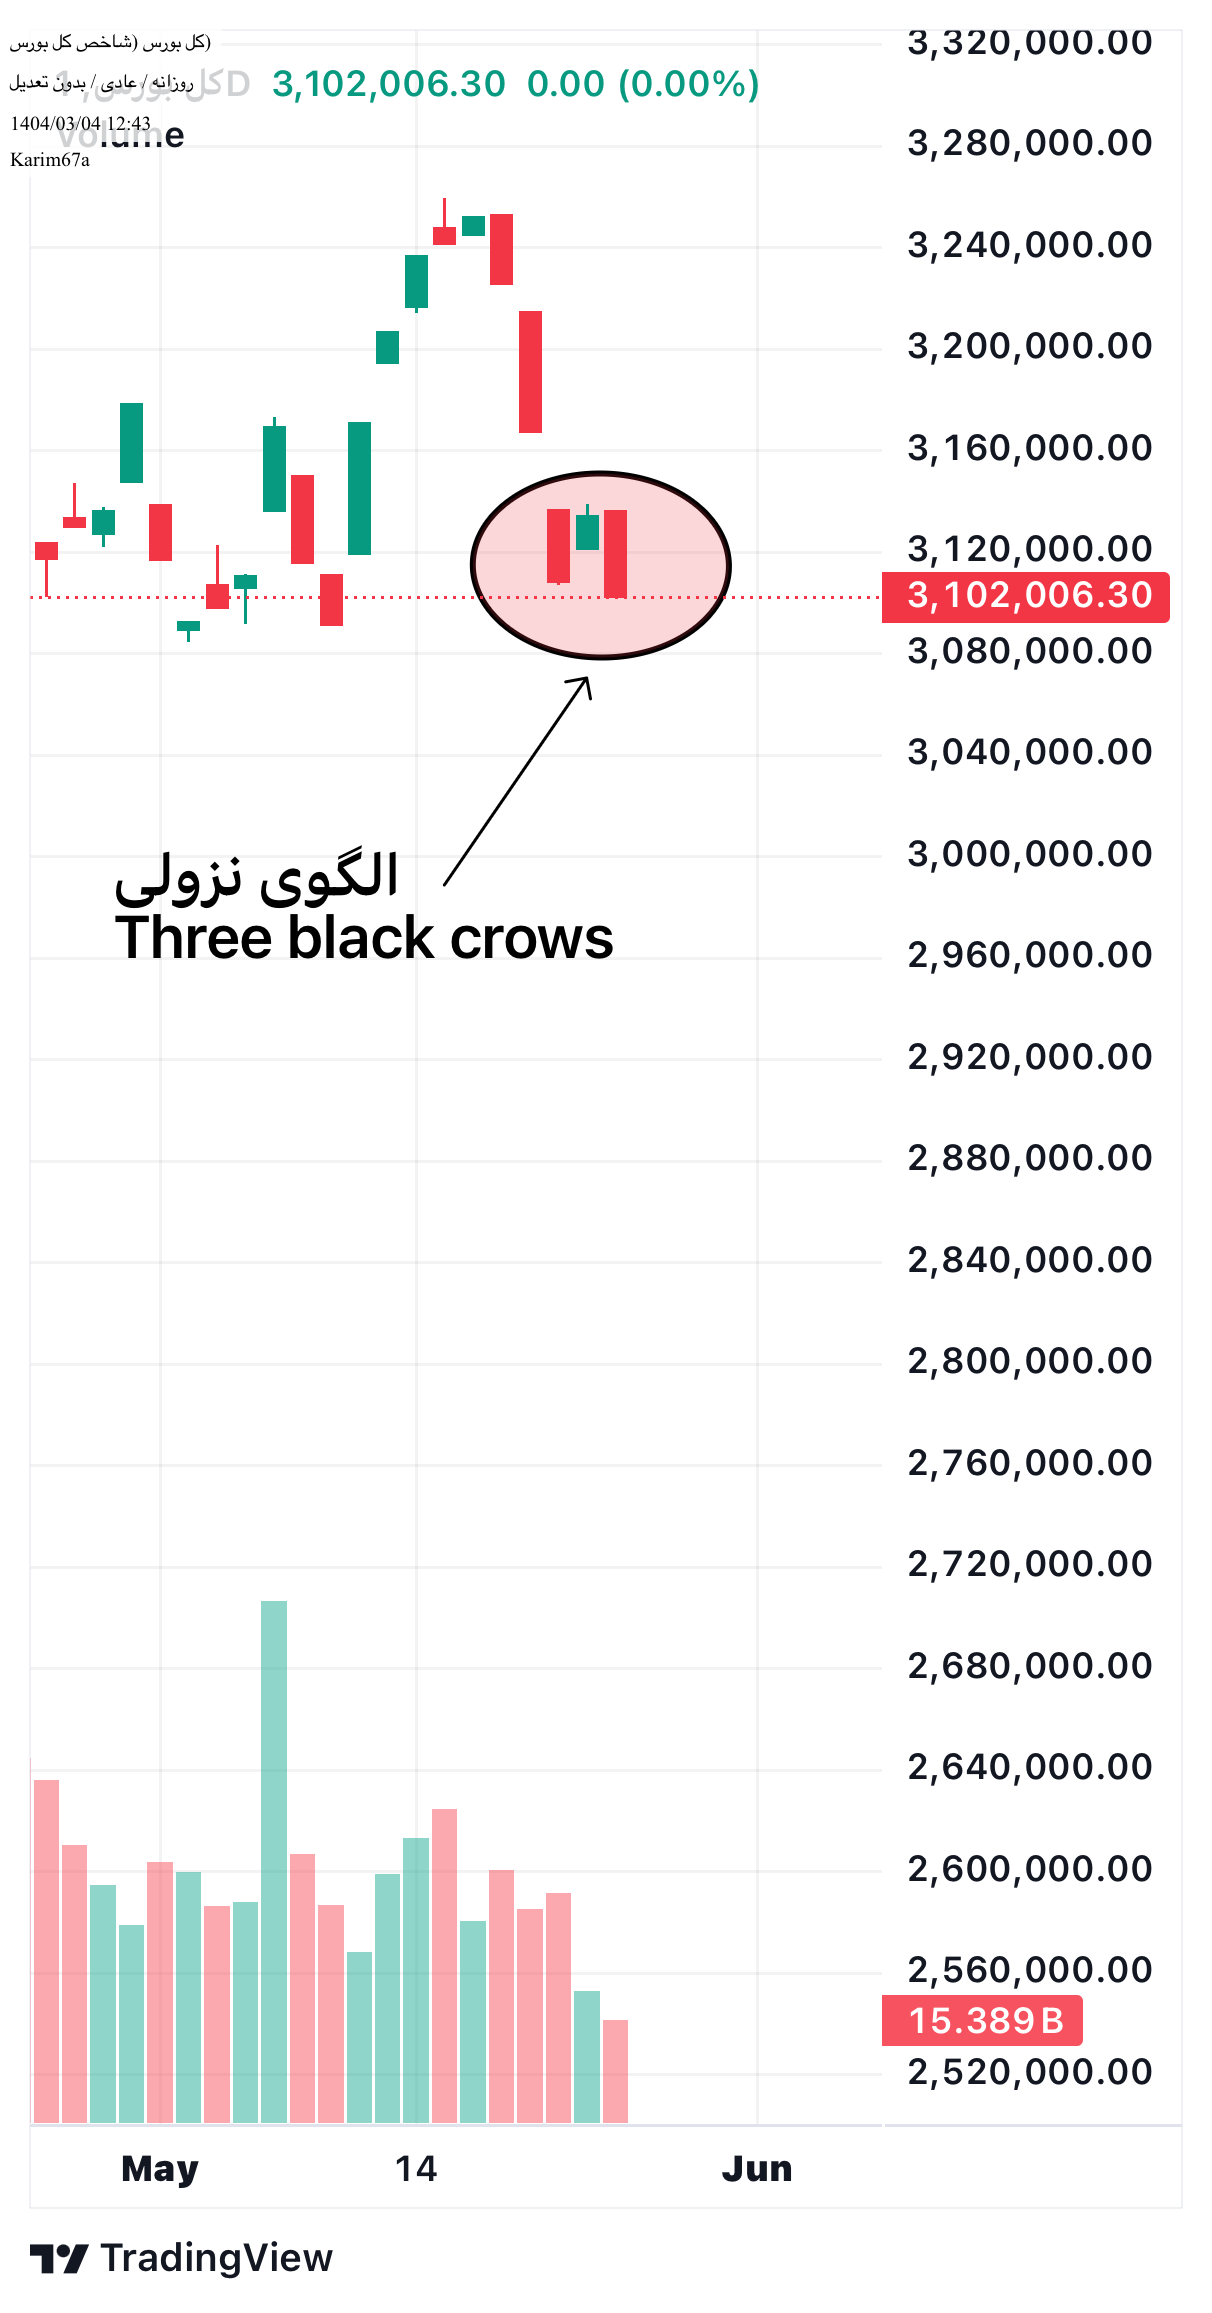
Analysis of the last Kendel (Red Kendel): • Type: Powerful descending candy (Marobuzo incomplete) • Features: The upper and lower shadows are very low or no shadow, the long descending body • Concept: Heavy sales pressure and full mastery of sellers on that day • Closing near daily floor: Symptoms of severe weakness and the possibility of continuing downward trend in the short term ⸻ Analysis of the Last Kendel: 1. The first (from the right): the big red (marobuzo incomplete) 2. Kandel II: Small green with a short body, in the range between two red candlesticks 3. Thirdly: Relatively large red ⸻ The technical pattern formed: Pattern of "Black Crown" incomplete or quasi -insee Down • These three candlesticks are somehow a sign of the beginning of the descending wave. • Since the middle candle (the second candlestick) is a little green, this pattern is not completely classic, but its psychology is as follows: • After an attempt to return (Green Kendel), they again have the power of market sellers. • The closure of the last candlestick is lower than the previous candlesticks. ⸻ Conclusion: • The index is fluctuating near the important support of 1.5 million units. • Failure to support 1.2 to lower can cause further fall. • In the absence of a significant volume or a backlog, the continuation of the downward trend is currently more likely
شاخص_کل_بورس
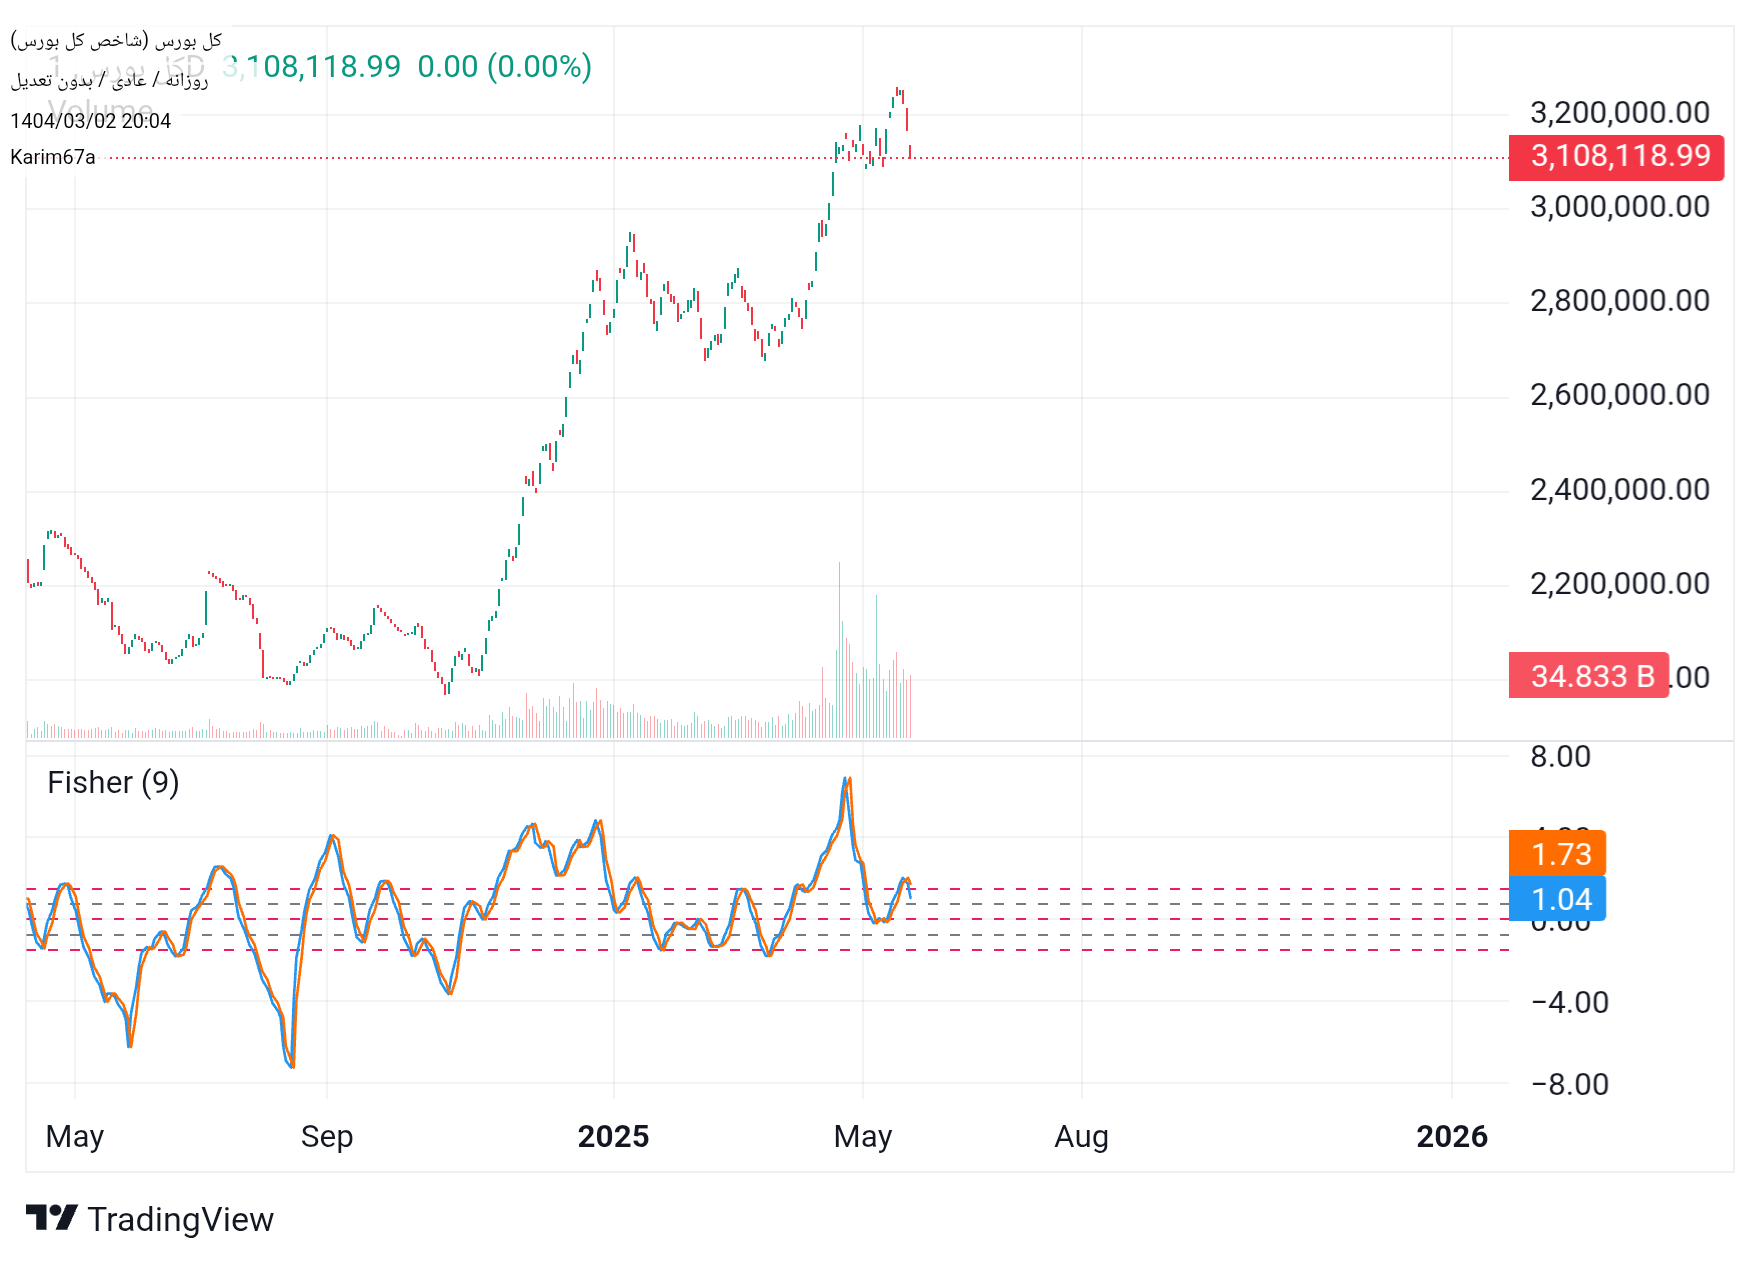
The analysis of the total index of the stock using the Fisher Transform (Fisher 2) Indicator is presented with the daily service of the companions: 1. The current value of the Fisher indicator is about 1.5 and its signal line is about 1.5 Currently, the Fisher line is lower than the signal line, which can be a sign of a decline in the uptrend and the possibility of correction begins. 2. The descending movement from the saturation area of purchasing The indicator has returned from the top of 1.5 to the bottom, which is usually regarded as a temporary correction alert or an end to the uptrend. 1. Similar behavior in the past At the previous stages that Fisher showed such a pattern, the index has entered the reform or consolidation phase. Summary: Currently, the Fisher signal is cautious. If you are in the purchase position, it is best to save some of the profits and observe the loss limit. There is still no definitive sales signal (such as crossing zero down), but weakness in purchasing power is evident.
شاخص_کل_بورس
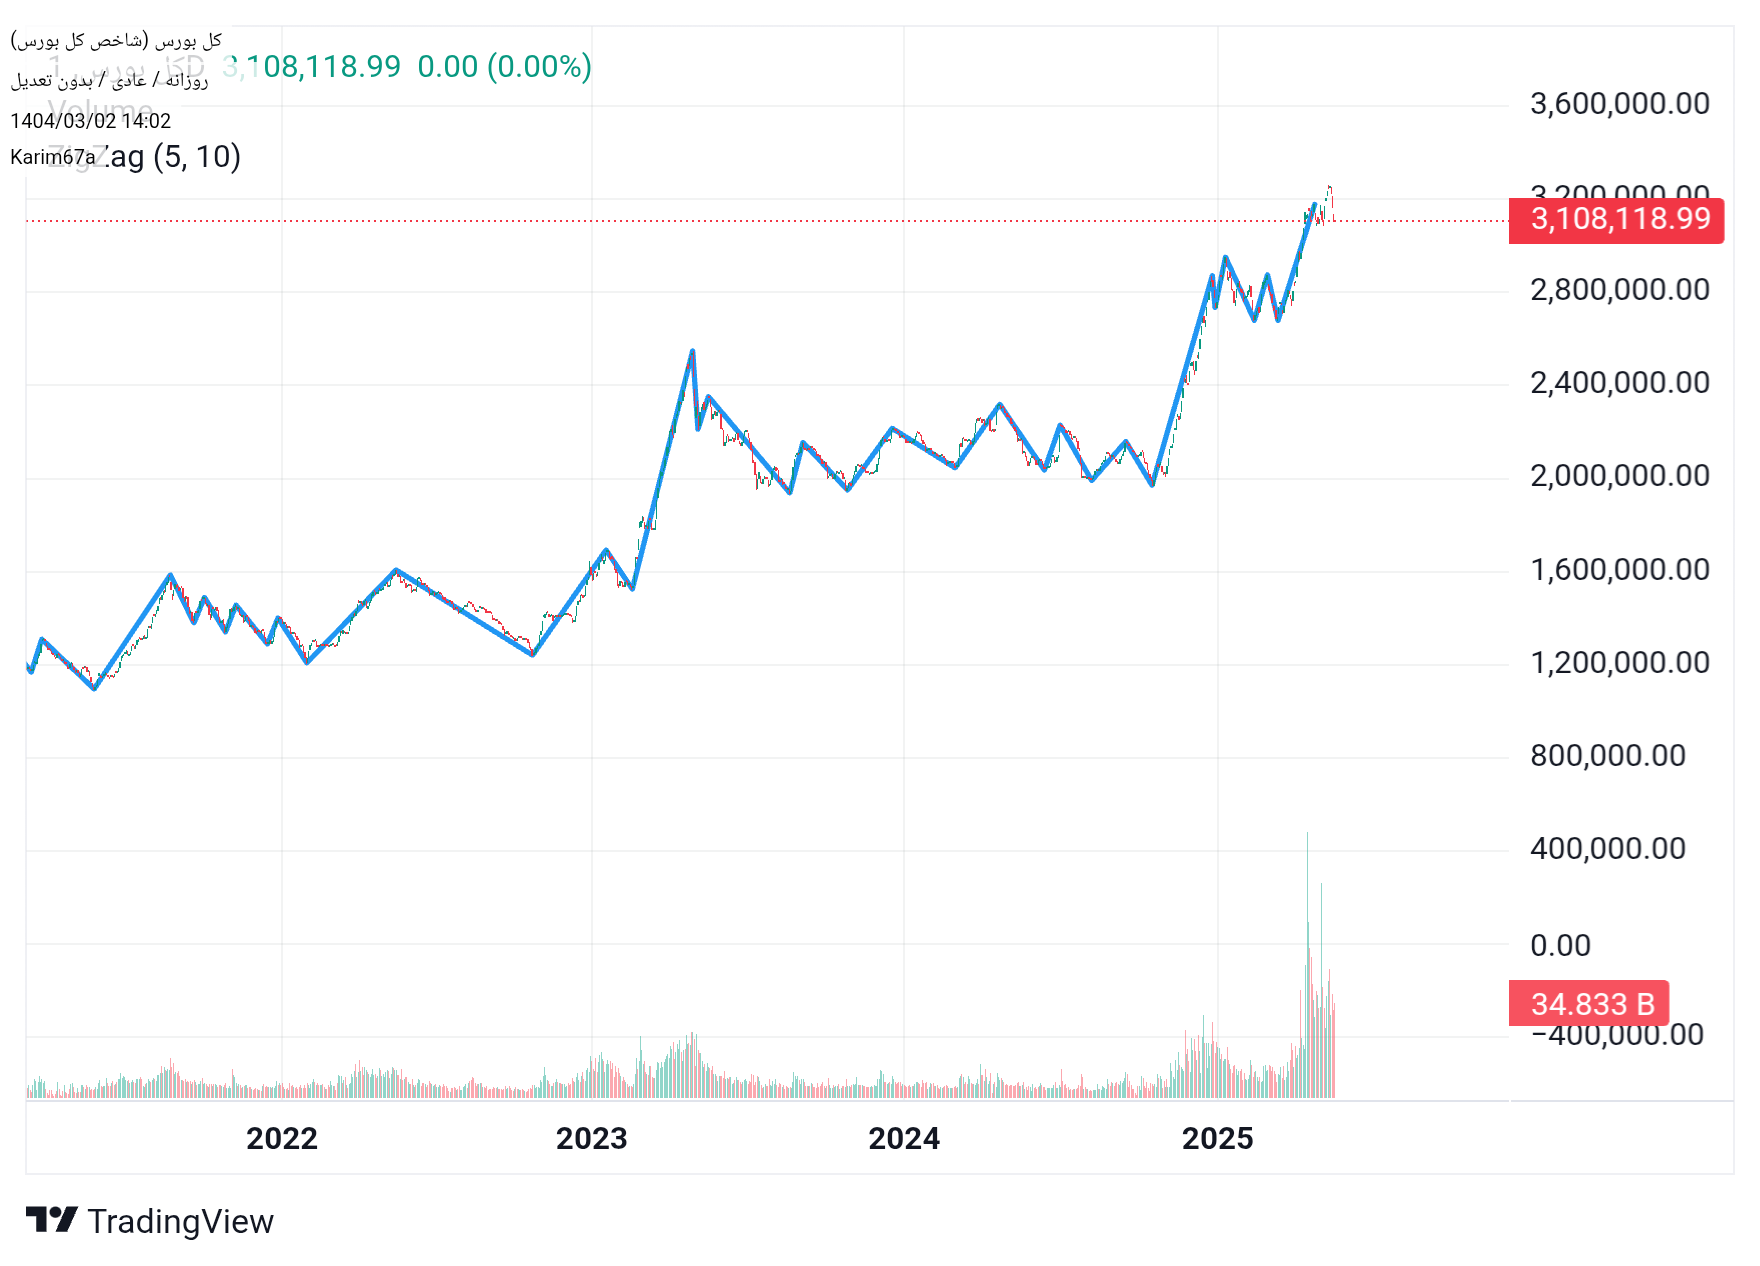
An analysis of the overall index based on the zigzag indicator and the chart is presented in the daily service of the dear companions: The Zigzag indicator is a technical tool that exhibits only important and significant price movements by eliminating price noise and minor fluctuations. In this chart, the Zigzag indicator (5,10) is used, which shows the price rotation points more accurately. The overall structure of the trend (2022 to 2025): 1. Swinging motion in 2022: The market this year is mainly rush and oscillatory and has no definite trend. The Zigzag indicator has recorded short -term and downward movements in the heart of a limited channel. 2. Sharp climbing in early 2023: The total index has moved up with a powerful jump; This growth may be the result of important economic news or high liquidity entry. This ascending wave is the first failure of the long -term descending structure. 3. Deep correction in the middle of 2023: After Sharp's growth, the market entered the reform phase. Zigzag shows several shorter waves of downward and upward, indicating doubt in the market. 4.. Stabilizing upward move in 2024: The price has been rising with multiple flooring. This phase is a phase of the market's relative confidence to continue the uptrend. Zigzag in this section has the Higher High / Higher Low structure, which confirms the uptrend. 5. Explosive Increase in the beginning of 2025: The overall index has once again experienced a large leap and reached its historical ceiling of 1.5 million units. The move has been confirmed by Zigzag with steep slope and the failure of the previous roof. --- Technical Analysis by Zigzag: Current Status (May 2025): The index reaches the historic ceiling and is in a state of consolidation. If subsequent candlesticks show high stabilization of this surface, there is a need for greater growth. Otherwise, it is possible to modify up to 2.6 or even 2.4 million units. --- Conclusion: The Zigzag indicator has good power in identifying the main trends in this chart and clearly shows that the market has entered a powerful ascending trend from the correction phase. The examination of this indicator alone is not sufficient and is recommended to combine with tools such as Fibonacci, RSI, MACD and trading volume to increase the accuracy of the analysis.
Disclaimer
Any content and materials included in Sahmeto's website and official communication channels are a compilation of personal opinions and analyses and are not binding. They do not constitute any recommendation for buying, selling, entering or exiting the stock market and cryptocurrency market. Also, all news and analyses included in the website and channels are merely republished information from official and unofficial domestic and foreign sources, and it is obvious that users of the said content are responsible for following up and ensuring the authenticity and accuracy of the materials. Therefore, while disclaiming responsibility, it is declared that the responsibility for any decision-making, action, and potential profit and loss in the capital market and cryptocurrency market lies with the trader.