
نوسانگیران وحشی
@g_1411995947

What symbols does the trader recommend buying?
Purchase History
پیام های تریدر
نوسانگیران وحشی

#reward_analysis 😄 Femli; The pillar of Iran's copper industry from the mine to the world market 🔺 Femli is the main axis of Iran's copper industry; A company with three large mines, a complete production chain and a high market share, plays a pivotal role in the economy and capital market. From extraction to cathode production, everything at Femli ends up creating a steady stream of income. 🔺 Copper cathode is the main engine of profitability; Where export growth, exchange rate jumps and global prices are directly transferred to financial statements. Along with that, extensive development plans have drawn the horizon of production growth and intrinsic value of shares more clearly than ever. Click here to view the full report 📷 Instagram Website 📱 LinkedIn 🏪 Bonus application 📞 021-58718
نوسانگیران وحشی

#reward_analysis 😄 Golghar; Today's performance and tomorrow's horizon 🔺 According to the report, Golgohar Mining and Industrial Company has maintained its strategic position as one of the main axes of the country's steel chain, with a high capacity of concentrate and pellet production and a significant contribution in providing feed to steelmakers. Recent reports also show that in spite of seasonal fluctuations in production, the sales flow and financial performance of the company are stable and significant Rial growth has been recorded. Along with this performance, #Kegel is running a series of development plans in the field of mining, value chain promotion, energy, logistics and new technologies, which will strengthen the future path of Golgohar and improve the company's profitability perspective. In the capital market, maintaining the support levels and improving the trading process is a sign of strengthening positive expectations for Kegel's share. Click here to view the full report 📷 Instagram Website 📱 LinkedIn 🏪 Bonus application 📞 021-58718
نوسانگیران وحشی
✍️ In the following, I present my complete analysis of the recent resolution of the Economic Council regarding the instructions on how to issue licenses for the export of petroleum products and its effect on refining symbols. This analysis is just my personal perception of the provisions of the resolution and its consequences in the oil industry and the capital market. From the perspective of the capital market, the implementation of this directive can have important consequences for refining symbols. First, clarifying the accumulated claims, settling debts with the product export method, and determining specific calculation rates will significantly reduce the financial uncertainties of the companies of this group. One of the important challenges of refining symbols during the past years was the dispersion in financial reports, sudden changes in the crack spread calculation, differences in qualitative coefficients, as well as uncertainty in the time and amount of claims settlement. With the implementation of the new law, these uncertainties will be reduced and the profitability of companies will become more predictable; An issue that is considered a fundamental positive signal from the point of view of the capital market. On the other hand, facilitating the collection of claims and making it possible to convert part of the government's debt into exports, significantly improved the cash flow of refineries and reduced the pressure on working capital. Improved liquidity allows companies to make more regular feed purchases, advance development projects faster, and reduce operating costs. This can directly lead to an increase in net profit and improvement of financial ratios in quarterly and annual reports; A problem that increased the fundamental appeal of the symbols of this group. At the behavioral level of the market, such a resolution is usually accompanied by a positive reaction from traders; Because it removes a set of market uncertainties towards the refining group. Especially in a situation where a significant part of the market value of this group is affected by profitability expectations and analysis of future cash flows, clearing the ambiguity in the area of pricing and settlements can bring significant demand into the symbols of this group. In the short term, there is a possibility that some symbols will see an increase in demand and even the formation of buying queues under the positive influence of جو; Especially the symbols that have bigger demands and get the most direct benefit from the implementation of this resolution. However, the stability of this positive reaction depends on the speed and quality of the instruction implementation. If the Ministry of Oil, refining companies and other relevant institutions implement the valuation, settlement and allocation of export licenses without delay, its positive effect on the market can be sustainable. But any new delay or ambiguity in the implementation of the decree may limit some of the initial optimism. For this reason, professional investors usually, in addition to the initial reaction, also observed the trend of the monthly performance reports of the companies and the actual numbers of claims settlement. In general, this directive can be one of the important drivers for the return of the market's attention to the refining group. From both a fundamental and a psychological point of view, this resolution has the capacity to improve the trading status of the respective symbols and cause significant price growth even in the short term. If the debt settlement is done on time and the companies show its financial reflection in their reports, the refining group can become one of the attractive groups of the capital market in the coming months. #refining #fundamental_analysis #stock market
نوسانگیران وحشی
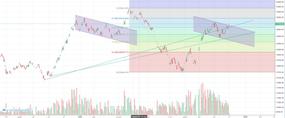
⭕️ The leveraged fund entered a structured correction phase after a strong upward wave that started from the range of 15,694 and continued up to the ceiling of 33,425. During this period, the chart has formed two correction channels that define the general nature of the price movement. The first channel was formed in the range of 29,600 to 26,000 and after exiting it, a new growth began. The second channel, in which the price is now, has fluctuated between 24,000 and 29,000, and its ceiling is exactly the same range that the price hit today. In this situation, the current price is around 27,750; That is, between two important Fibonacci levels, 0.618 at 26,852 and 0.786 at 29,630 are located. This area is practically the most important decision-making area to determine the continuation of the medium-term trend. In addition, the price is on the sub-uptrend line and has also reached the ceiling of the corrective channel. The important thing is that today's symbol is associated with the shopping queue; An issue that shows that demand has strengthened at a critical point and buyers tend to break the ceiling of the channel upwards. This behavior is of great importance for analysts, because usually a queue of purchases in such ranges is a sign of the market's willingness to accept higher prices and the end of the corrective phase. On the side of support levels, the 26,852 range is considered the first important support, and after that, the 24,559 level, which is equivalent to the 0.5 Fibo, was the next key support. The main and structural support of the chart is also around 22,267, which, in addition to the 0.382 Fibo, also overlaps with the main upward trend line. On the other hand, the most important upcoming resistances include the range of 28,300 to 29,000 (channel ceiling), then the level of 29,630 and then the targets of 30,500, 32,000 and the historical ceiling of 33,425. Due to the price being at the upper border of the channel as well as today's buying queue, the bullish scenario has gained more strength. If the price can stabilize above the range of 28,000 to 28,300, the exit from the corrective phase is confirmed and the probability of reaching the targets of 30,500 and 32,000 will increase a lot. On the other hand, if the price cannot cross the ceiling of the channel, there is a possibility of returning to the range of 26,850, and if it fails, there is a possibility of further correction up to 24,500. All in all, the leveraged fund is now at a point where it can be considered the area of determining the future trend. Today's market behavior and the formation of a buying queue have increased the weight of the bullish scenario, and if the price stabilizes above the ceiling of the channel, a new wave of growth can begin. #Total_Index #Exchange #Leverage
نوسانگیران وحشی
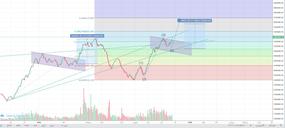
Total index analysis After its significant correction to the range of 3,065,000, the total index entered a strong uptrend and is now in the classic Elliott wave structure. The recent break of the historical ceiling of 3,263,000 showed that the market is out of the doubt phase and confidence and liquidity are being formed again. Today's correction is also evaluated in the framework of the market's natural behavior after breaking the historical ceiling. From the point of view of wave counting, the bottom index of wave (2) has been recorded in the range of 3,065,000 and has entered wave (3) with strong growth. Now the modification we observe is the wave (4) whose nature, according to classical structures, usually occurs in the form of a neutral channel or time modification. The graph also confirms the same issue; So that the recent correction was done inside a short-term downward channel and the index was able to react upwards again from the ceiling of the channel. This behavior is the sign of the beginning of wave (5). In the Fibonacci section, correction levels from the ceiling of 3,263,000 to the floor of 3,065,000 show that the index reacted positively in the most important areas, i.e. the levels of 0.5 (around 3,174,000) and 0.618 (around 3,193,000). Usually, the beginning of the fifth wave occurs after touching these areas, and this technical correspondence increases the validity of the analysis. From the point of view of the trend, the index is still above the main upward trend line and the breaking of the false ceiling of the corrective channel is also a sign of the increasing power of buyers. Regarding the volume of transactions, the point here is that the recent negatives are accompanied by appropriate volumes and are considered to mean "consolidation" and "taking power of the market" rather than a sign of weakness. Usually, in the poolback area to the historical ceiling, such volumetric behavior is quite natural and desirable. Considering all the above factors, if the index can stabilize above 3,263,000 for a few days, the entry of parked liquidity and the start of a new upward phase was far from expected. With the current scenario, the market has the ability to move towards the targets of 3,340,000, then 3,410,000 and in the longer term, 3,500,000 to 3,600,000. On the contrary, the important supports of the index are 3,174,000 and 3,108,000, respectively, and the level of 3,065,000 is considered as the key support of the trend. Overall, the technical structure of the total index is still bullish and the recent correction is not only not a threat to the trend, but is considered a natural part of the market's continued path towards higher goals. #total_index of #stock market
نوسانگیران وحشی

😄 world light competition; The power of Iran's aromatic giant 🔺According to Bogar report, in recent months, Nouri Petrochemical paints a picture of an aromatic giant on the verge of fundamental transformation; A company that strengthens its position in global markets with high production capacity and significant share of exports. The turning point of Nouri's story is its three strategic projects; Heavy cut sweetening transforms company profitability with 92% progress, flare gas recovery project creates powerful operational and environmental impacts, and petrochemical completion enables new company revenue engine. The sum of these factors puts Nouri in a position that can improve its income structure and make it one of the most attractive fundamental options in the petrochemical industry. Click here to view the full report 📷 Instagram Website 📱 LinkedIn 🏪 Bonus application 📞 021-58718
نوسانگیران وحشی

😄 Shespa; Base oil export giant 🔺 According to the report, Sepahan Oil Company with the symbol #Shespa has drawn a picture of a company on the path of fundamental leap in recent months; A company that relies more than 57% of its revenue on exports and focuses on base oil as its main competitive advantage, has a strong position in international markets. The 34% growth in October sales and the stunning 499% jump in earnings per share in the summer are only part of the brilliant performance of this company. At the same time, strategic projects such as FRW, TDAE and Group II and III base oil production will direct Shespa's path towards products with higher added value and higher profit margins. The sum of these factors shows that Shespa stands at a point where it can transform its income structure and become one of the most attractive fundamental options in the industry. Click here to view the full report 📷 Instagram Website 📱 LinkedIn 🏪 Bonus application 📞 021-58718
نوسانگیران وحشی
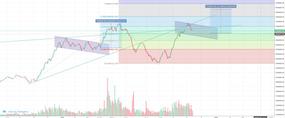
⭕️ Technical analysis of the total index After a deep correction to the range of about 2.4 million units, the total index entered a strong upward wave and is now in the range of 3,101,381 units. The movement structure of the index shows that the medium-term trend is still bullish; But the index has fluctuated in dealing with Fibonacci resistances. Examining the Fibonacci levels shows that the index had a negative reaction in dealing with the ratio of 0.618 Fibo in the range of 3,193,000 units and entered a short-term correction. The 3,043,000 range served as an important 0.5 Fibo level as well as valid short-term support. If the index stabilizes above this level, the recent correction is merely a break in the uptrend. In the structure of the pattern, the index oscillates in a triangle with a neutral angle inclined to the downside, and the recent collision with the ceiling of this pattern has caused the current correction. As long as the bottom of the pattern and the support level of 2,890,000 units (Fib 0.382) are maintained, the dominant trend is still considered bullish. 🔺 In the scenario of continued growth, the index goals in the first step were 3.25 million units and in the next step, the important range was 3,400,000 to 3,500,000 units; An area that has a complete overlap with the 0.786 Fibo ratio and is considered a serious resistance in the market path. In general, as long as the index is above the support of 3.03 million units, the dominant uptrend is still valid and the recent correction could be a prelude to the continuation of the upward movement. If the support of 2.89 million units is lost, there is a possibility of deepening the correction to the range of 2.7 million units.
نوسانگیران وحشی
⭕️⭕️ Minister of War Pete Hegseth; Trump ordered action, and the War Department is running Today, I announce Operation Southern Spear This mission, led by Joint Task Force Southern Spear and Southern Command, defends our homeland, removes drug terrorists from our hemisphere, and protects our homeland from the drugs that are killing our people. The western hemisphere is America's neighbor and we protected it
نوسانگیران وحشی
The total index is currently in the range of 3.2 million units and is not far from its historical ceiling of 3.3 million units. From a psychological and technical point of view, this range is considered one of the most important resistances of the market in the last few years. 🔺 In the past months, after a relatively deep correction to the range of 2.4 million units, the index managed to form a strong upward trend. The recent movement slope shows that the power of the buyers is increasing and in most of the candles, the pressure of demand prevails. The volume of transactions has also increased significantly compared to the previous months, which is a sign of the gradual entry of new liquidity into the market; Especially in recent weeks when many big symbols and index makers had significant growth. From the point of view of the price structure, the index is now in the final phase of the current upward wave and is probably retesting the historical ceiling. In case of decisive failure and stabilization above the range of 3.3 million units, the market can enter a new phase of growth, and the next targets in the range of 3.5 to 3.7 million units were likely. Conversely, if the index fails to break through this resistance, a temporary correction to the 3.0-3.1 million units area could be likely to gather energy for the next breakout. All in all, the general trend of the index is still strong and upward, and the current market structure shows no signs of weakness. The only cautionary point is that in resistance ranges, the possibility of short-term volatility and money transfer between industries increases. #total_index of #stock market
Disclaimer
Any content and materials included in Sahmeto's website and official communication channels are a compilation of personal opinions and analyses and are not binding. They do not constitute any recommendation for buying, selling, entering or exiting the stock market and cryptocurrency market. Also, all news and analyses included in the website and channels are merely republished information from official and unofficial domestic and foreign sources, and it is obvious that users of the said content are responsible for following up and ensuring the authenticity and accuracy of the materials. Therefore, while disclaiming responsibility, it is declared that the responsibility for any decision-making, action, and potential profit and loss in the capital market and cryptocurrency market lies with the trader.