
پایگاه قهرمانی بورس
@g_1384988132

What symbols does the trader recommend buying?
Purchase History
پیام های تریدر
پایگاه قهرمانی بورس
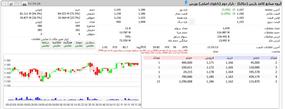
#Chekapa 167 Tomans, a share that has a record price fall in the stock market, has been noticed by the market. Share sales reports can be reviewed. 07/23/1404
پایگاه قهرمانی بورس
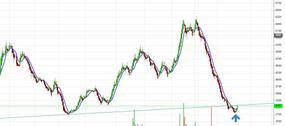
After 4 months, the chicker could make a move and go above the average of 9 days
پایگاه قهرمانی بورس
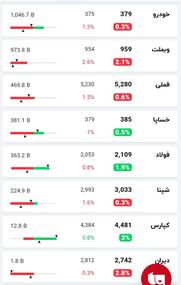
#Value_Churbs_ Some of today's symbols: #Car: Money to Denaplas #Khalep: Money 2 to Falcons #Webmolt: Influence of a Bank of Our Bank #Famil: Money 2 m Cable Cable #Steel: Money 2 to rebar #Shapna: Money of a gasoline tanker #Capars: Money 2 m 1 in 1 in 1 #Diran: Money to Cartoon Acetaminophen That is, the Iranian stock exchange
پایگاه قهرمانی بورس
#Index_Chritis in this terrible collapse only 5 % corrected, you might say to yourself, well, with the support of indexing shares, they were not allowed to reform the overall index, now let's go and see how much the stock index stocks fell. #Steel 2 % #Fars 2 % #Webmolt 2 % #Light 2 % #2 % #Tapico 2 % #Car 2 % #Khalea 2 % #Family 2 % #Rampena 2 % #Waghdir 2 % #Khagster 2 % #Camel 2 % #2 % trade #Website 2 % #Parsan 2 % #Kegel 2 % #2 % #Tsico 2 % #Mines 2 % #Pars 2 % #Visapa 2 % #Bu Ali 2 % #Sharak 2 % #Fakhoz 2 % #Melt 2 % #Children 2 % #Sheeps 2 % #Season 2 % #Hormuz 2 % #Zagros 2 % #Stock Exchange 2 % Judging with yourself, the Shepherd probably kept the index alone.
پایگاه قهرمانی بورس
Indicator's return on ceiling 99 Investigating Rial Returns of Indexes in the last 5 years: Nouri: 732 percent Family: 155 percent Parsan: 145 % Webmolt: 108 % Fars: 101 percent Wagir: 80 % Steel: 44 % Shapna: 16 % Shasta: -30 percent AH:-72 percent Dollar: 316 percent Coin: 641 percent
پایگاه قهرمانی بورس
#Value_Deliness 13 -year -old market support ranging Since 2013, large companies have entered the capital market and, since 1977, with the arrival of larger companies such as #Shosha into the capital market, the market value of the $ 90 billion market has increased its $ 125 billion and reached $ 450 billion in 1399. The 13 -year market growth in the dollar's point of view: 1392 to 1397 Start Slow Movement: The dollar value of the market fluctuated in the range of $ 90 to $ 100 billion. The arrival of some large companies and the improvement of trading structures to the market deepened the market, but it still did not deepen and the value of the market is recorded. Historical jump: 1977 to 1399 With the arrival of large companies such as Shasta and Maternal Industries, and of course severe rial inflation, with the stabilization and suppression of the exchange rate and the sharp decline in interest rates in the money market, the capital market saw an unprecedented growth, and at the height of 1399 the market value of the market reached about $ 450 billion; An unprecedented record in the country's financial history. From 1399 to today's gradual erosion and destruction process: From 1399 to today, the capital market has been involved in a set of policy crises and mistakes, from repeating the wrong decisions within the economy to the monetary and financial policies that in the short term only the key to the way, the sharp decline in the value of the rial and the national currency in the free market, and the consolidation of the exchange rate in the reports and the forcing companies to increase the market rates. In fact, this price suppression in key industries (petrochemical, refining, metal, automotive) has led companies to finance higher than the average free -risk market, on the other hand, the issue of unpopular issuance of debt securities and the unjust competition with the stock market eventually led to a decline in financial outflows. These factors led the market to $ 450 billion, under $ 200 billion, and now near the critical border of $ 90 to $ 100 billion, and the range that has always been supported as a support floor in the past 13 years was on the verge of being broken. Now we have to ask this warning is a sign of a change in the historical phase of the market or is the policy maker ready to accept a smaller market?
پایگاه قهرمانی بورس
What is a trading point on the stock exchange? As you know, the shares that are traded in the capital market have a price fluctuation range. Therefore, in small share of low liquidity, there is a possibility of forming heavy sales queues. In this case, shareholders will not be able to buy or sell their shares. If these conditions persist for a few days and the symbol is locked on the queue or sale, the so -called trademark has a trademark. When does the trading node happen? According to Article 2 of the Transaction Instructions on the Stock Exchange, the symbols of the following conditions were included in the trading node: مانی The following are subject to the following conditions at the end of the trading day and with the queues of buying or selling: A symbol that, despite the purchase queue or sales queue, at least one equivalent to the volume of the base for companies whose number is three billion or more or doubles the volume of the base for other companies is not traded for at least five trading days. ✅B) for at least five trading days, their average daily transactions (except trading in the major trading market) should be less than five percent of the base volume. Previously, in the trading node conditions, the range of fluctuations increased to twice as much and the base volume remains unchanged. According to the new reforms, in addition to increasing the range of fluctuations, the base volume in the symbols of the trading node is determined by the number one. #Training #Stock Exchange
پایگاه قهرمانی بورس
#And all can be reviewed 1/4/7
پایگاه قهرمانی بورس

#Group sales report #Cement Cement companies sold 9911 billion tomans in June 1404, which increased by 89 % compared to the same year last year. 💵 Export sales of 1134 billion tomans, which increased by 46 percent compared to the same year. 🔥 The monthly sales record was broken. #Anthem Company with 207 billion USD recorded the highest export. ✅ #Staran Company with 689 billion USD registered the highest sales in the company. The following companies recorded the highest growth rate compared to the same year. #237% #School 🔥 202% #Sabaqir 🔥 168% #Sabic 🔥 154% #154% #Setran 🔥 138% #Sasoufi 🔥 136% #Anthem 🔥 118% #70% #Sevine 🔥 109% #108% #907% #92% Saman #89% cycle #88% #Sarbill 🔥 88% #84% Sedasht #81% sarom #79% Sefano #72% Sausage #Strma 🔥 70% #68% #67% #Ardestan 65% #Saveh 🔥 65% #64% Sarab #56% speech #52% Sabzeva #47% ambassador #44% #42% sessions #29% Saqina #20% Sedor 📅 Last Update: 1404/04/16
پایگاه قهرمانی بورس
Cementation #Sasoufi checks 1/4/7
Disclaimer
Any content and materials included in Sahmeto's website and official communication channels are a compilation of personal opinions and analyses and are not binding. They do not constitute any recommendation for buying, selling, entering or exiting the stock market and cryptocurrency market. Also, all news and analyses included in the website and channels are merely republished information from official and unofficial domestic and foreign sources, and it is obvious that users of the said content are responsible for following up and ensuring the authenticity and accuracy of the materials. Therefore, while disclaiming responsibility, it is declared that the responsibility for any decision-making, action, and potential profit and loss in the capital market and cryptocurrency market lies with the trader.