
مهدی میرزایی (انستیتو امواج الیوت)
@g_1083379888

What symbols does the trader recommend buying?
Purchase History
پیام های تریدر
Filter
مهدی میرزایی (انستیتو امواج الیوت)
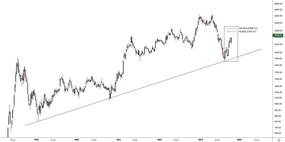
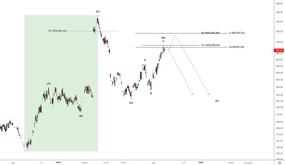
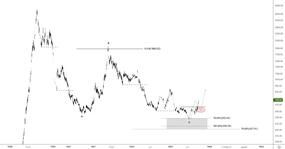
#Folad / weekly timeframe / update The most powerful indicator of the current market is undoubtedly steel. The scenario with which we rose from the price floor was the Corrective scenario that we had in mind and in the last update of this scenario we said that although it has reached a very important resistance range, it does not confirm the correction! And it may be at the noise level, which is what happened, and the modification in steel was only at the noise level. With the news of the supply of steel currency in the second hall, the resistance quickly moved upwards. We can put aside the corrective scenario of this wave for the time being so that the chart moves a little further and the path of the wave becomes more clear. However, it is possible to pay attention to the range of 315-330 Tomans; This range is the ratio of 78 and 100 wave 1 in the boxed structure, which gives potential wave 5 targets if the recent move is impulsive. @mahdy_mirzaiie
مهدی میرزایی (انستیتو امواج الیوت)
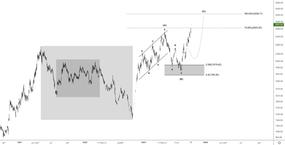
#D / daily time frame / update We followed Bank D from the price floor on the channel, which you can see through the chain of replicated posts. In the last update, it was mentioned that he has finally activated the trigger and is on the way up. It gained a good upward momentum and with the breaking limit of wave C bottom, you can follow the ascending scenario for this symbol. The @mahdy_mirzaiie
مهدی میرزایی (انستیتو امواج الیوت)
#وتجارت / weekly timeframe / update In the recent analysis of this symbol, it was said at the price floor that we seem to have entered an upward corrective wave in the market as a whole, and we announced the range of 50 to 61.8 Fibonacci levels as the target of this upward corrective wave. After about two months and a 40-45% growth in trade, now the candles have entered the range we are looking for, and we have to wait and see how the weekly candle closes at the end of this week, the weakness of the trend or whether it continues to rise strongly. The type of market behavior in this range can reveal the short-term future of the symbol. @mahdy_mirzaiie
مهدی میرزایی (انستیتو امواج الیوت)
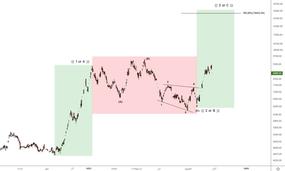
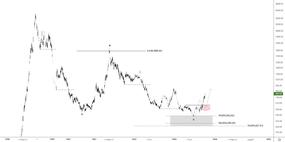
#Persian / daily timeframe It reopened today with the limit of swing range and closed a heavy buying queue. It seems that the ceiling of the recent upward wave in Fars has been completed one ceiling earlier than the ceiling of May and the ascent at the beginning of the year is wave B of correction! In this case, the rise of Fars should continue rapidly upwards. The initial target can be the range of 1360 tomans (100 percent of the Fibo level of the current rising trio). @mahdy_mirzaiie
مهدی میرزایی (انستیتو امواج الیوت)
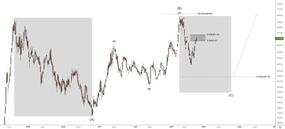
#Khasapa / daily timeframe Similar to many other important stocks, Khasapa is suspected of a threefold corrective pattern, which has stopped growing in the first target of this threefold. If the market is going to continue to rise, the current ranges in most important symbols should be broken strongly to the upside, and there are potential ranges to push the market lower, at least in the short term and temporarily. As mentioned in most of the analysis, we do not have confirmation of the correction in Khasapa and we have to wait until the decision phase of the market to start the correction, or break the resistance and move to the next important price level. @mahdy_mirzaiie
مهدی میرزایی (انستیتو امواج الیوت)
#Folad / daily timeframe / update They say that the steel report was not good and today because of the bad report, there was a heavy selling queue, which of course gathered at the end of the market. We, as technical analysts, say that what the market has reached now, we predicted long ago on the chart. It still does not confirm the correction and it may be at the noise level and pass the resistance to the top too soon. To confirm the correction, we have to wait for it to stabilize below 260 Tomans. The @mahdy_mirzaiie
مهدی میرزایی (انستیتو امواج الیوت)
#Shetran / daily timeframe / update When no one was talking about the profit and reports of refineries, the chart gave us an alarm and in the recent analysis of this symbol, it was pointed out that "refineries are among the attractive industries of the market in terms of waves." That's all, and these symbols were among the leading industries in the recent rise of the market. The camel report has made a lot of noise today and there was a heavy buying queue for it, and it is on the verge of crossing the historical ceiling. However, for us, the first target has been reached in terms of the chart, and only if it stabilizes above this target, it will activate the second target in our mind. The @mahdy_mirzaiie
مهدی میرزایی (انستیتو امواج الیوت)
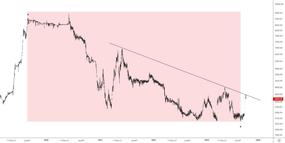
#Midco / daily timeframe / close-up update You can see the previous analytical posts related to this symbol by clicking on the hashtag #midco. After several consecutive buying lines, it has reached the downward trend line and has a negative reaction for now. After breaking the trend line and possible pullback, it can create good conditions for new buyers. @mahdy_mirzaiie
مهدی میرزایی (انستیتو امواج الیوت)
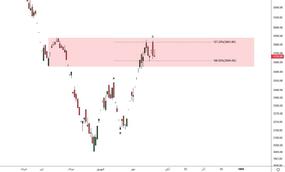
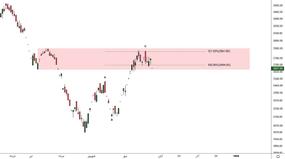
#Folad / daily timeframe / update See the previous analysis of this symbol through the chain of replicated posts, or the #steel hashtag on the channel. In the analysis update, it can be seen that the price has entered the target range and the negative reaction is quite evident, and it is suspicious of the classic twin ceiling pattern. In the coming days, if the correction of this symbol continues with momentum, the above analytical scenario will be confirmed. Otherwise, it needs to be updated. The @mahdy_mirzaiie
مهدی میرزایی (انستیتو امواج الیوت)
#D / daily time frame / update Finally, he activated the trigger and is on the way. With the breaking limit of wave C bottom, we can follow the bullish scenario for this symbol. The @mahdy_mirzaiie
Disclaimer
Any content and materials included in Sahmeto's website and official communication channels are a compilation of personal opinions and analyses and are not binding. They do not constitute any recommendation for buying, selling, entering or exiting the stock market and cryptocurrency market. Also, all news and analyses included in the website and channels are merely republished information from official and unofficial domestic and foreign sources, and it is obvious that users of the said content are responsible for following up and ensuring the authenticity and accuracy of the materials. Therefore, while disclaiming responsibility, it is declared that the responsibility for any decision-making, action, and potential profit and loss in the capital market and cryptocurrency market lies with the trader.