Technical analysis by VIPCryptoVault about Symbol BTC on 12/28/2025

Busted Chart Patterns...What They Are?
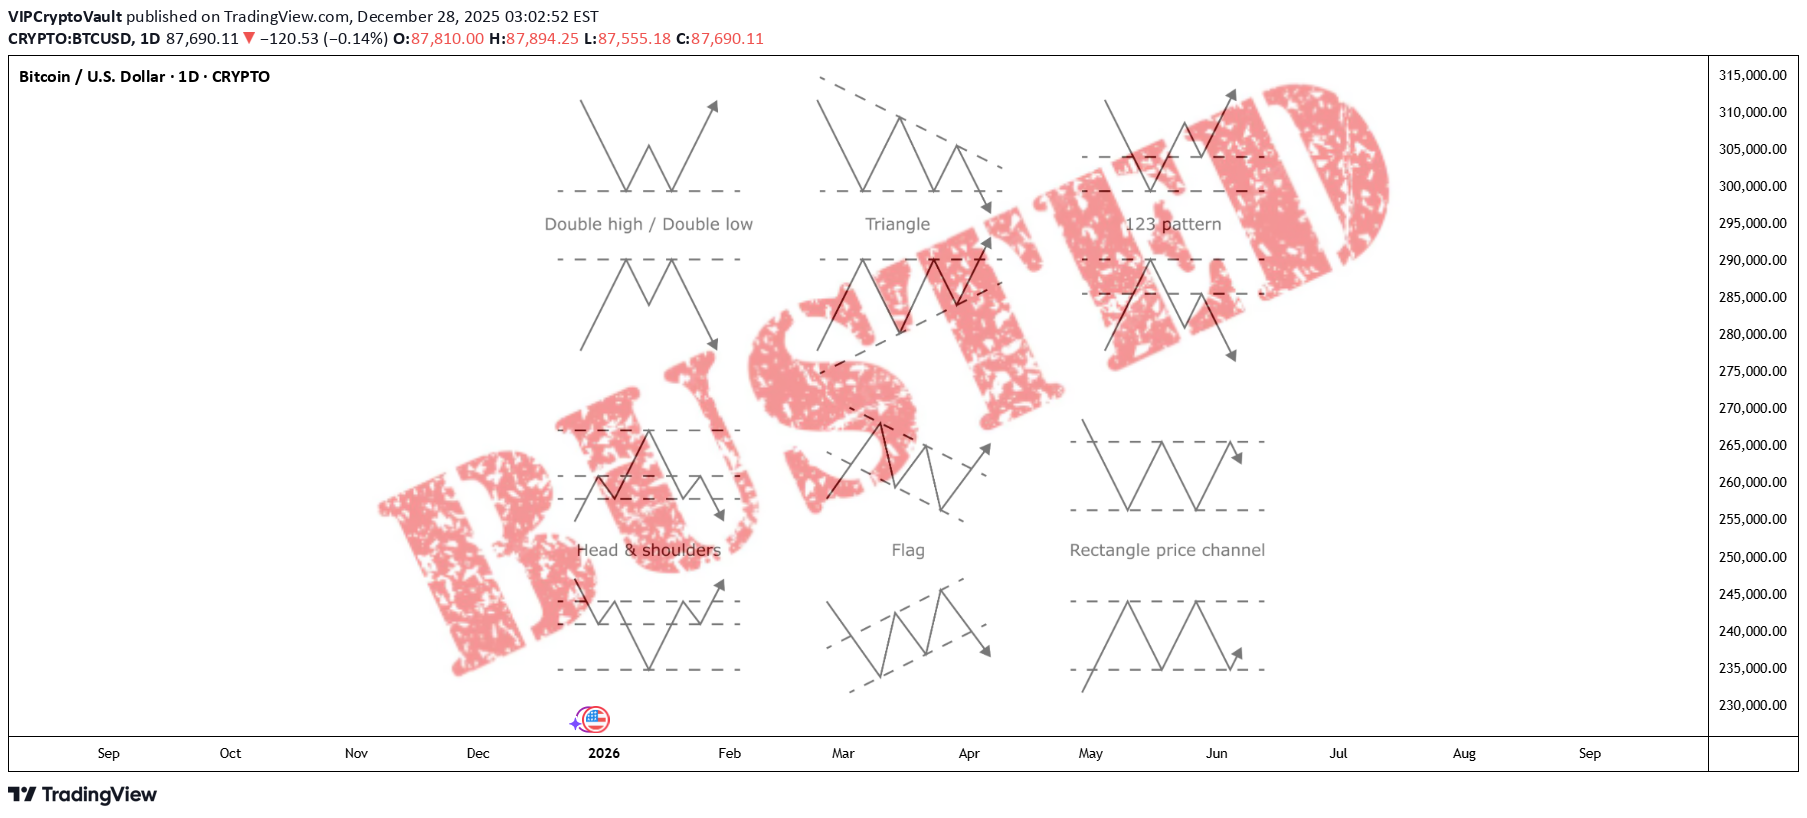
Hello traders, Ever saw that textbook double bottom with all rules applied? Price broke the swing high and stayed above, clear entry, stop loss and tp targets. All of a sudden, price reverts and continues the move downwards. But why? its a double bottom for god's sake!! Every guru said its a guaranteed trade. This was not a double bottom. This was "busted double bottom". So what is a busted pattern? -------------------------------------------------------------------------- 🔍 What defines a busted chart pattern? A pattern is considered "busted" when all of the following occur: 1️⃣ Typical price breakout Price closes above resistance or below support, or outside a pattern boundary (e.g., triangle trendline). 2️⃣ Limited follow-through Price travels no more than ~10-15% in the breakout direction. 3️⃣ Failure & reversal Volume and momentum stalls and price reverses 4️⃣ Invalidation close Bearish breakout → price closes back above the top of the pattern Bullish breakout → price closes back below the lowest low of the pattern -------------------------------------------------------------------------- 🔄 Can a single pattern bust more than once? Yes. Patterns can experience: Single (most common), double or triple bust. Price could oscillate for days, weeks or months, repeatedly failing in both directions. Usually that is a clear sign of distribution, accumulation, or liquidity sweeping. -------------------------------------------------------------------------- 🧩 How this fits modern price action? Busted patterns often align with: - Liquidity grabs - False breakouts - Stop-hunt behavior -------------------------------------------------------------------------- 🛠️ How to capitalize on this in our trading? If the normal pattern momentum is fading, wait for failure confirmation - Use the reclaimed level as invalidation - Expect expansion in the opposite direction - Risk is often cleaner than chasing breakouts -------------------------------------------------------------------------- 📌 Examples Busted Head & Shoulders Busted Double Top -------------------------------------------------------------------------- Patterns fail not because they are “wrong.” But because our mindset becomes one-sided. Educational content only. Always manage risk and do your own analysis. This knowledge and concepts are adapted from Thomas Bulkowski’s chart pattern research