Technical analysis by Quaid_3 about Symbol PAXG: Buy recommendation (12/17/2025)

4300 level is holding steady. Consider a long position.
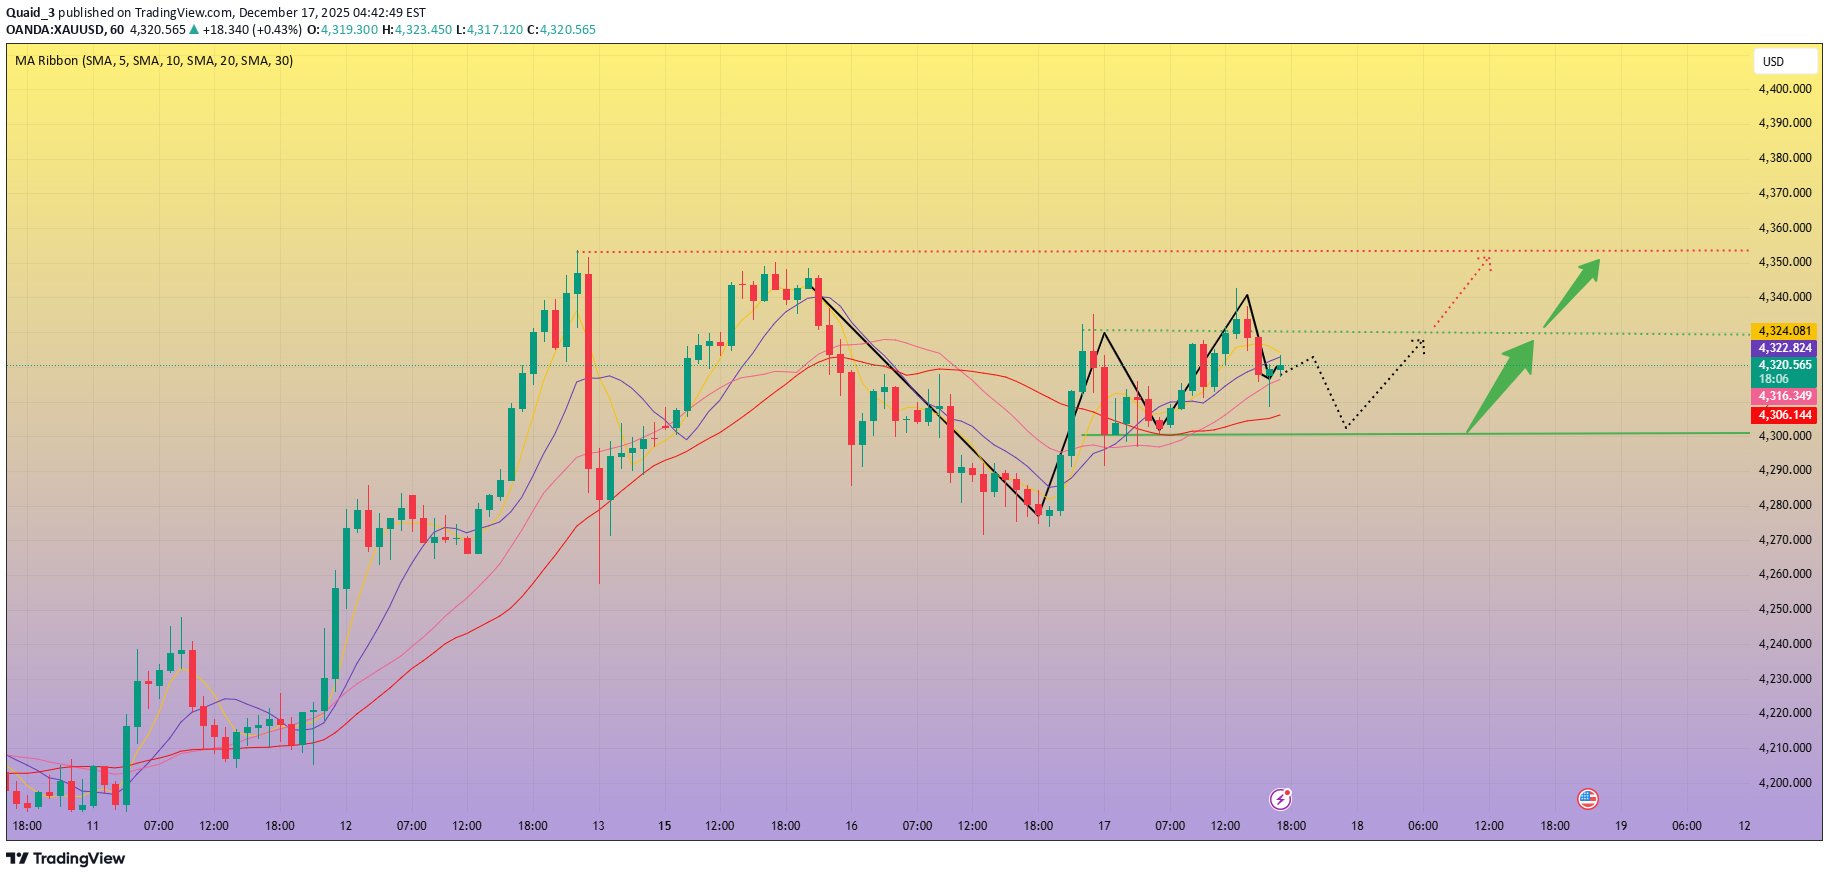
Gold initially faced resistance at 4320 on Tuesday, fluctuating before retreating to around 4272. The US session saw a rebound, but the contradictory non-farm payroll data and unemployment rate ultimately triggered market strength, leading to a further rise in gold prices after the data release. Gold tested resistance around 4335 before retreating to around 4300. On the 1-hour chart, in the short term, gold is facing resistance around 4330, the upper edge of the triangle pattern. If it can hold above this level, the next resistance level to watch is around 4350, the previous high. On the downside, watch the lower edge of the hourly triangle pattern around 4285-4280, while 4300, the middle area of the triangle pattern, needs to be closely monitored. Regarding recent gold price movements, a clear time-based pattern is evident: regardless of the direction of movement during the Asian session, the European trading session mostly shows sideways consolidation, lacking trend continuation; while the US trading session often sees directional reversals. Since the price rebounded from 4308, the moving average system shows that the trend has not yet stabilized and volatility remains significant. The ideal entry point is the support zone of 4300-4290. Quaid suggests focusing on stabilization signals in this zone during the European session. If there is no significant decline during the European session, consider a long position strategy in this support zone to capture a potential reversal during the US trading session. I will update more trading information in the channel.With the price breaking through the first resistance level of 4330, traders executing a long strategy should pay attention to the second resistance level of 4350.