Technical analysis by BullBearInsights about Symbol NVDAX on 15 hour ago

BullBearInsights
NVDA Sitting on a Decision Zone – Dec. 15 Could Be Explosive
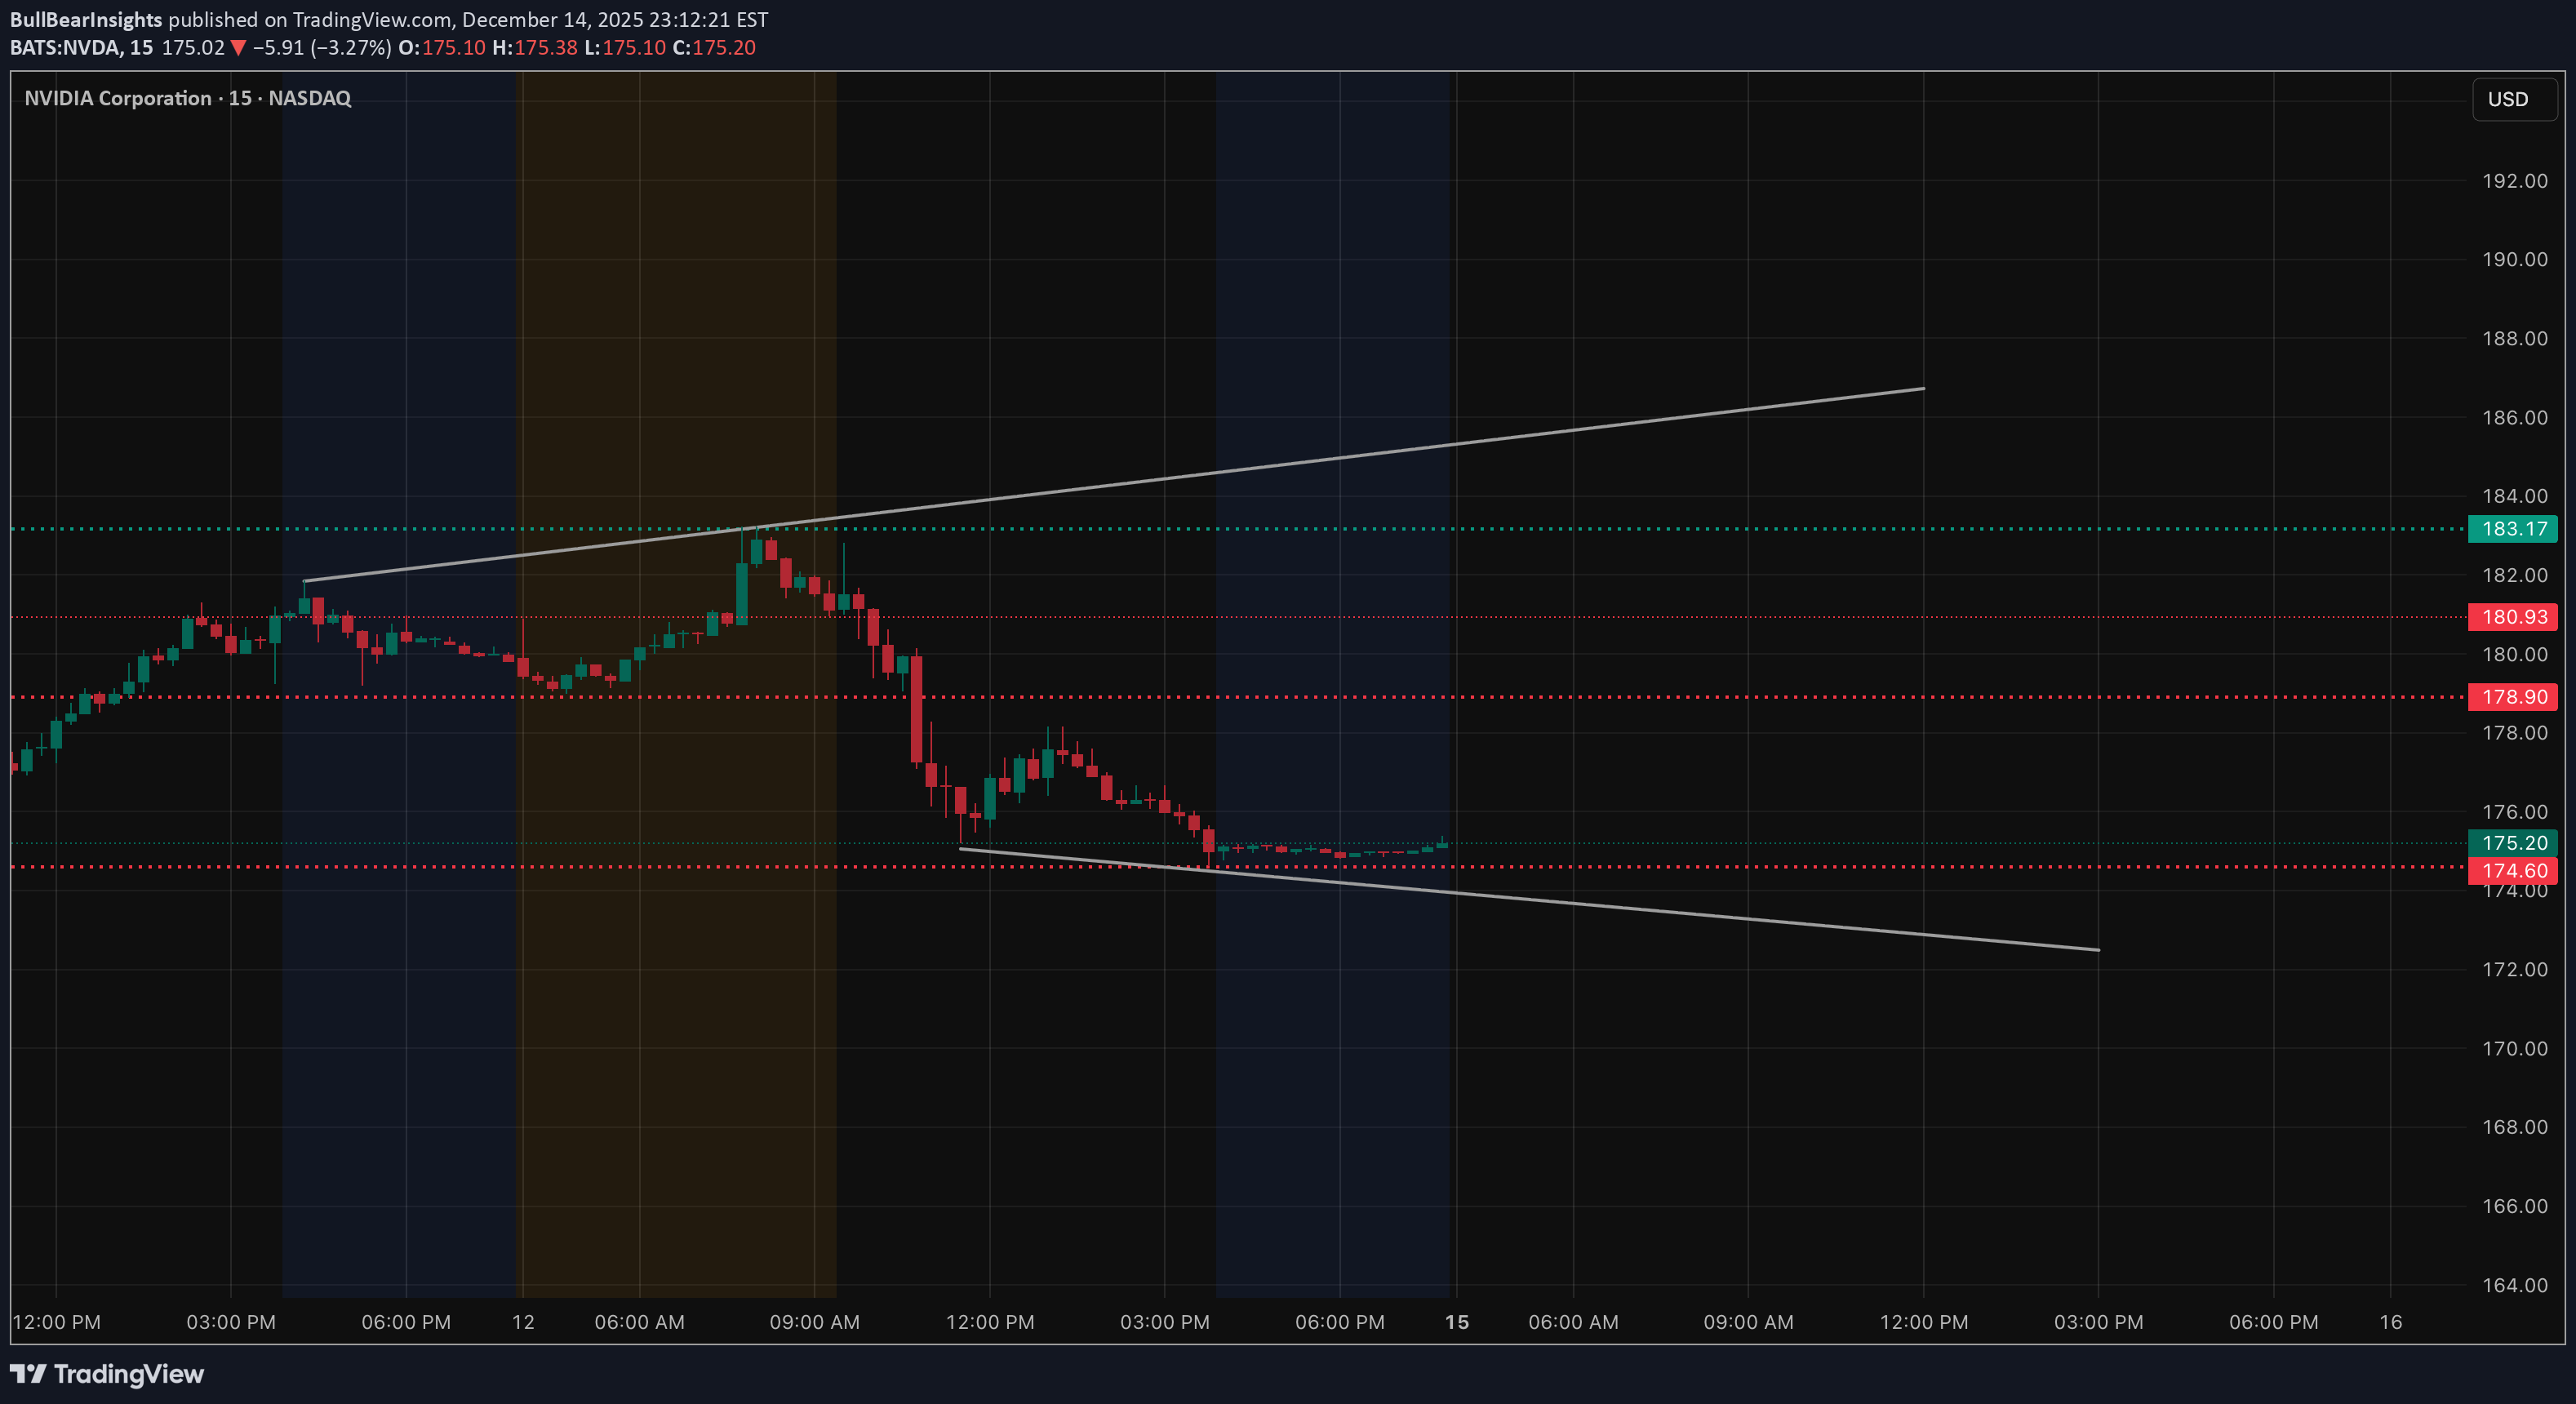
NVDA doesn’t look healthy right now. The structure has already rolled over, and what we’re seeing now feels more like damage control, not buyers stepping in with confidence. After the breakdown from the prior range, price tried to bounce, but every push higher has been weak and quickly sold. That tells me sellers are still active, and buyers are mostly reactive. Right now, NVDA is hovering around the 175 area, which is acting like a temporary pause. It’s holding for now, but it doesn’t feel like a strong base — more like the market catching its breath. Levels that matter The first level I care about is 175. That’s where price is trying to stabilize. If NVDA loses this area, the downside opens up fast. Below 175, I’m watching 172–170. That zone lines up with prior support and liquidity from earlier moves. If price gets there, I’d expect some reaction, but if it doesn’t hold, things can accelerate lower quickly. On the upside, 178–180 is the first real resistance. This area has rejected price multiple times already. If NVDA can’t reclaim and hold above it, upside moves are likely just short-lived bounces. Above that, 183–185 is the bigger test. That’s where the previous structure really broke down, and sellers are likely waiting again. Let check GEX options positioning to see if it fits the picture Options positioning lines up with the weakness on the chart. There’s strong PUT interest below, which explains why price is pausing instead of free-falling. But overhead, CALL resistance is stacked, especially above 180, which makes sustained upside harder. That’s why downside moves feel sharper, and upside moves feel slow and heavy. How I’m approaching NVDA As long as NVDA stays below 180, I’m cautious leaning long. That level needs to be reclaimed and held for the chart to start improving. If price loses 175, I’d expect momentum to pick up toward 172–170. For me: * Below 175 → downside continuation risk * Between 175–180 → chop and traps * Above 180 with acceptance → relief rally attempt Until proven otherwise, this still looks like bearish consolidation, not a reversal. This analysis is for educational purposes only and does not constitute financial advice.