Technical analysis by RexTraderSignal about Symbol PAXG: Buy recommendation (12/15/2025)

Gold Is Not Correcting — It’s Loading the Next Impulse
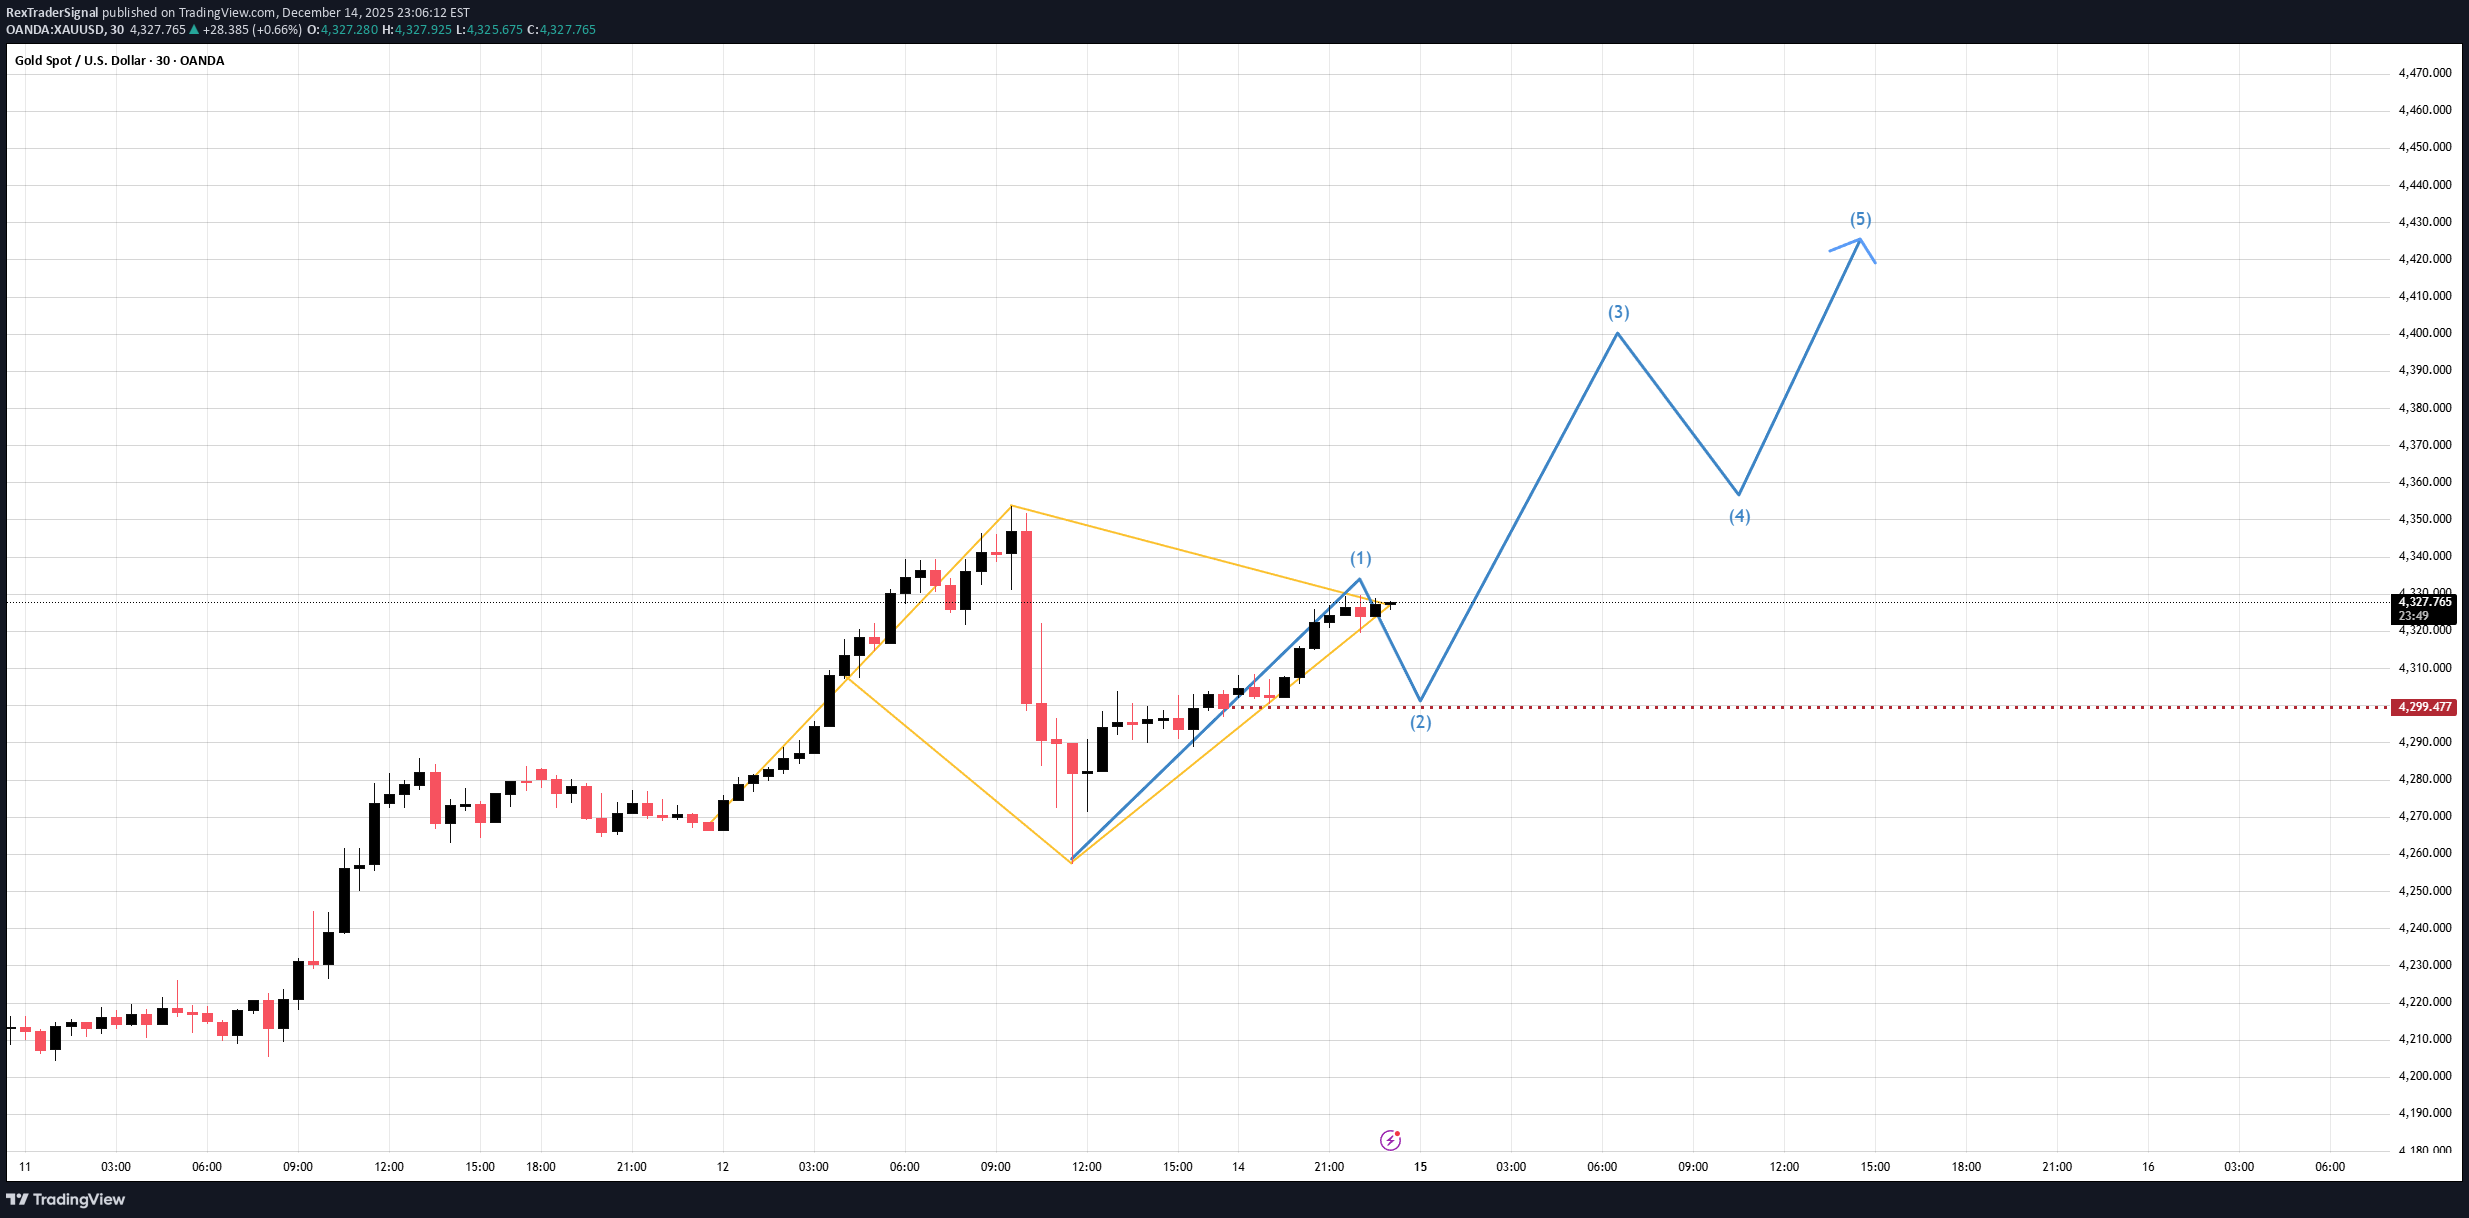
XAUUSD M30 – Intraday Market Analysis 1. Current Market Structure Gold remains in a healthy bullish structure after completing a sharp technical correction. The recent pullback was corrective in nature, and price has successfully reclaimed and held above key moving averages, confirming that the primary trend is still bullish. From a wave perspective, price is forming a (1) – (2) corrective structure, with wave (2) holding firmly above the key support area. This behavior signals trend continuation, not reversal. 2. Key Support & Structure Zones Primary Support Zone: 4286 – 4300 → Strong demand reaction, buyers defended this zone aggressively Structure Low (Wave 2): Still intact → Failure to break this level confirms seller weakness Upside Projection: Wave (3) → (4) → (5) remains valid as long as price holds above support This zone acts as a launchpad for the next impulsive leg. 3. Momentum & Flow Momentum indicators remain elevated, showing active buying pressure Selling volume decreases on pullbacks → correction lacks strength Price consolidating above support suggests smart money re-accumulation This is a classic pause-before-expansion behavior. 4. Today’s Market Scenario 🔼 Primary Scenario – Bullish Continuation If price continues to hold above 4300 – 4305, the market is highly likely to: Complete the corrective base Initiate wave (3) expansion Continue toward higher intraday targets as projected on the chart Corrections at this stage are considered buying opportunities, not trend failures. 5. Intraday Trading Plan Intraday Bias: 📈 Bullish (Increase) 📌 SET UP 1 – Timing Sell Zone (Counter-trend scalp) SELL ZONE: 4379 – 4382 TP: 4376 – 4371 SL: 4386 📌 SET UP 2 – Timing Buy Zone (Trend-following) BUY ZONE: 4286 – 4289 TP: 4292 – 4297 SL: 4282 ⚠️ Always apply proper capital management to protect the account. Conclusion Gold is not showing signs of distribution. The market is absorbing supply after a technical correction, maintaining bullish structure, and preparing for the next impulsive expansion. As long as price holds above the key support zone, the roadmap remains clear: Correct → Accumulate → Expand.Based on the latest update and the current price structure, the accumulation-before-ATH-breakout scenario is becoming increasingly clear. After the sharp pullback from the highs, XAUUSD has absorbed selling pressure and transitioned into a controlled sideways consolidation above the key support zone around 4,290–4,300. Price is no longer making lower lows; instead, it is oscillating within a tight range, signaling seller exhaustion and quiet accumulation by larger players. The price path you projected accurately reflects typical pre-breakout behavior: liquidity sweeps on both sides, volatility compression, and then expansion. As long as this accumulation base holds, the structure suggests this is not distribution at the top, but rather a loading phase ahead of an ATH breakout, with potential for a strong upside expansion once confirmation appears.