Technical analysis by BullBearInsights about Symbol NVDAX on 12/12/2025

BullBearInsights
NVDA Dec 12 Market Structure and Options. Driven Levels
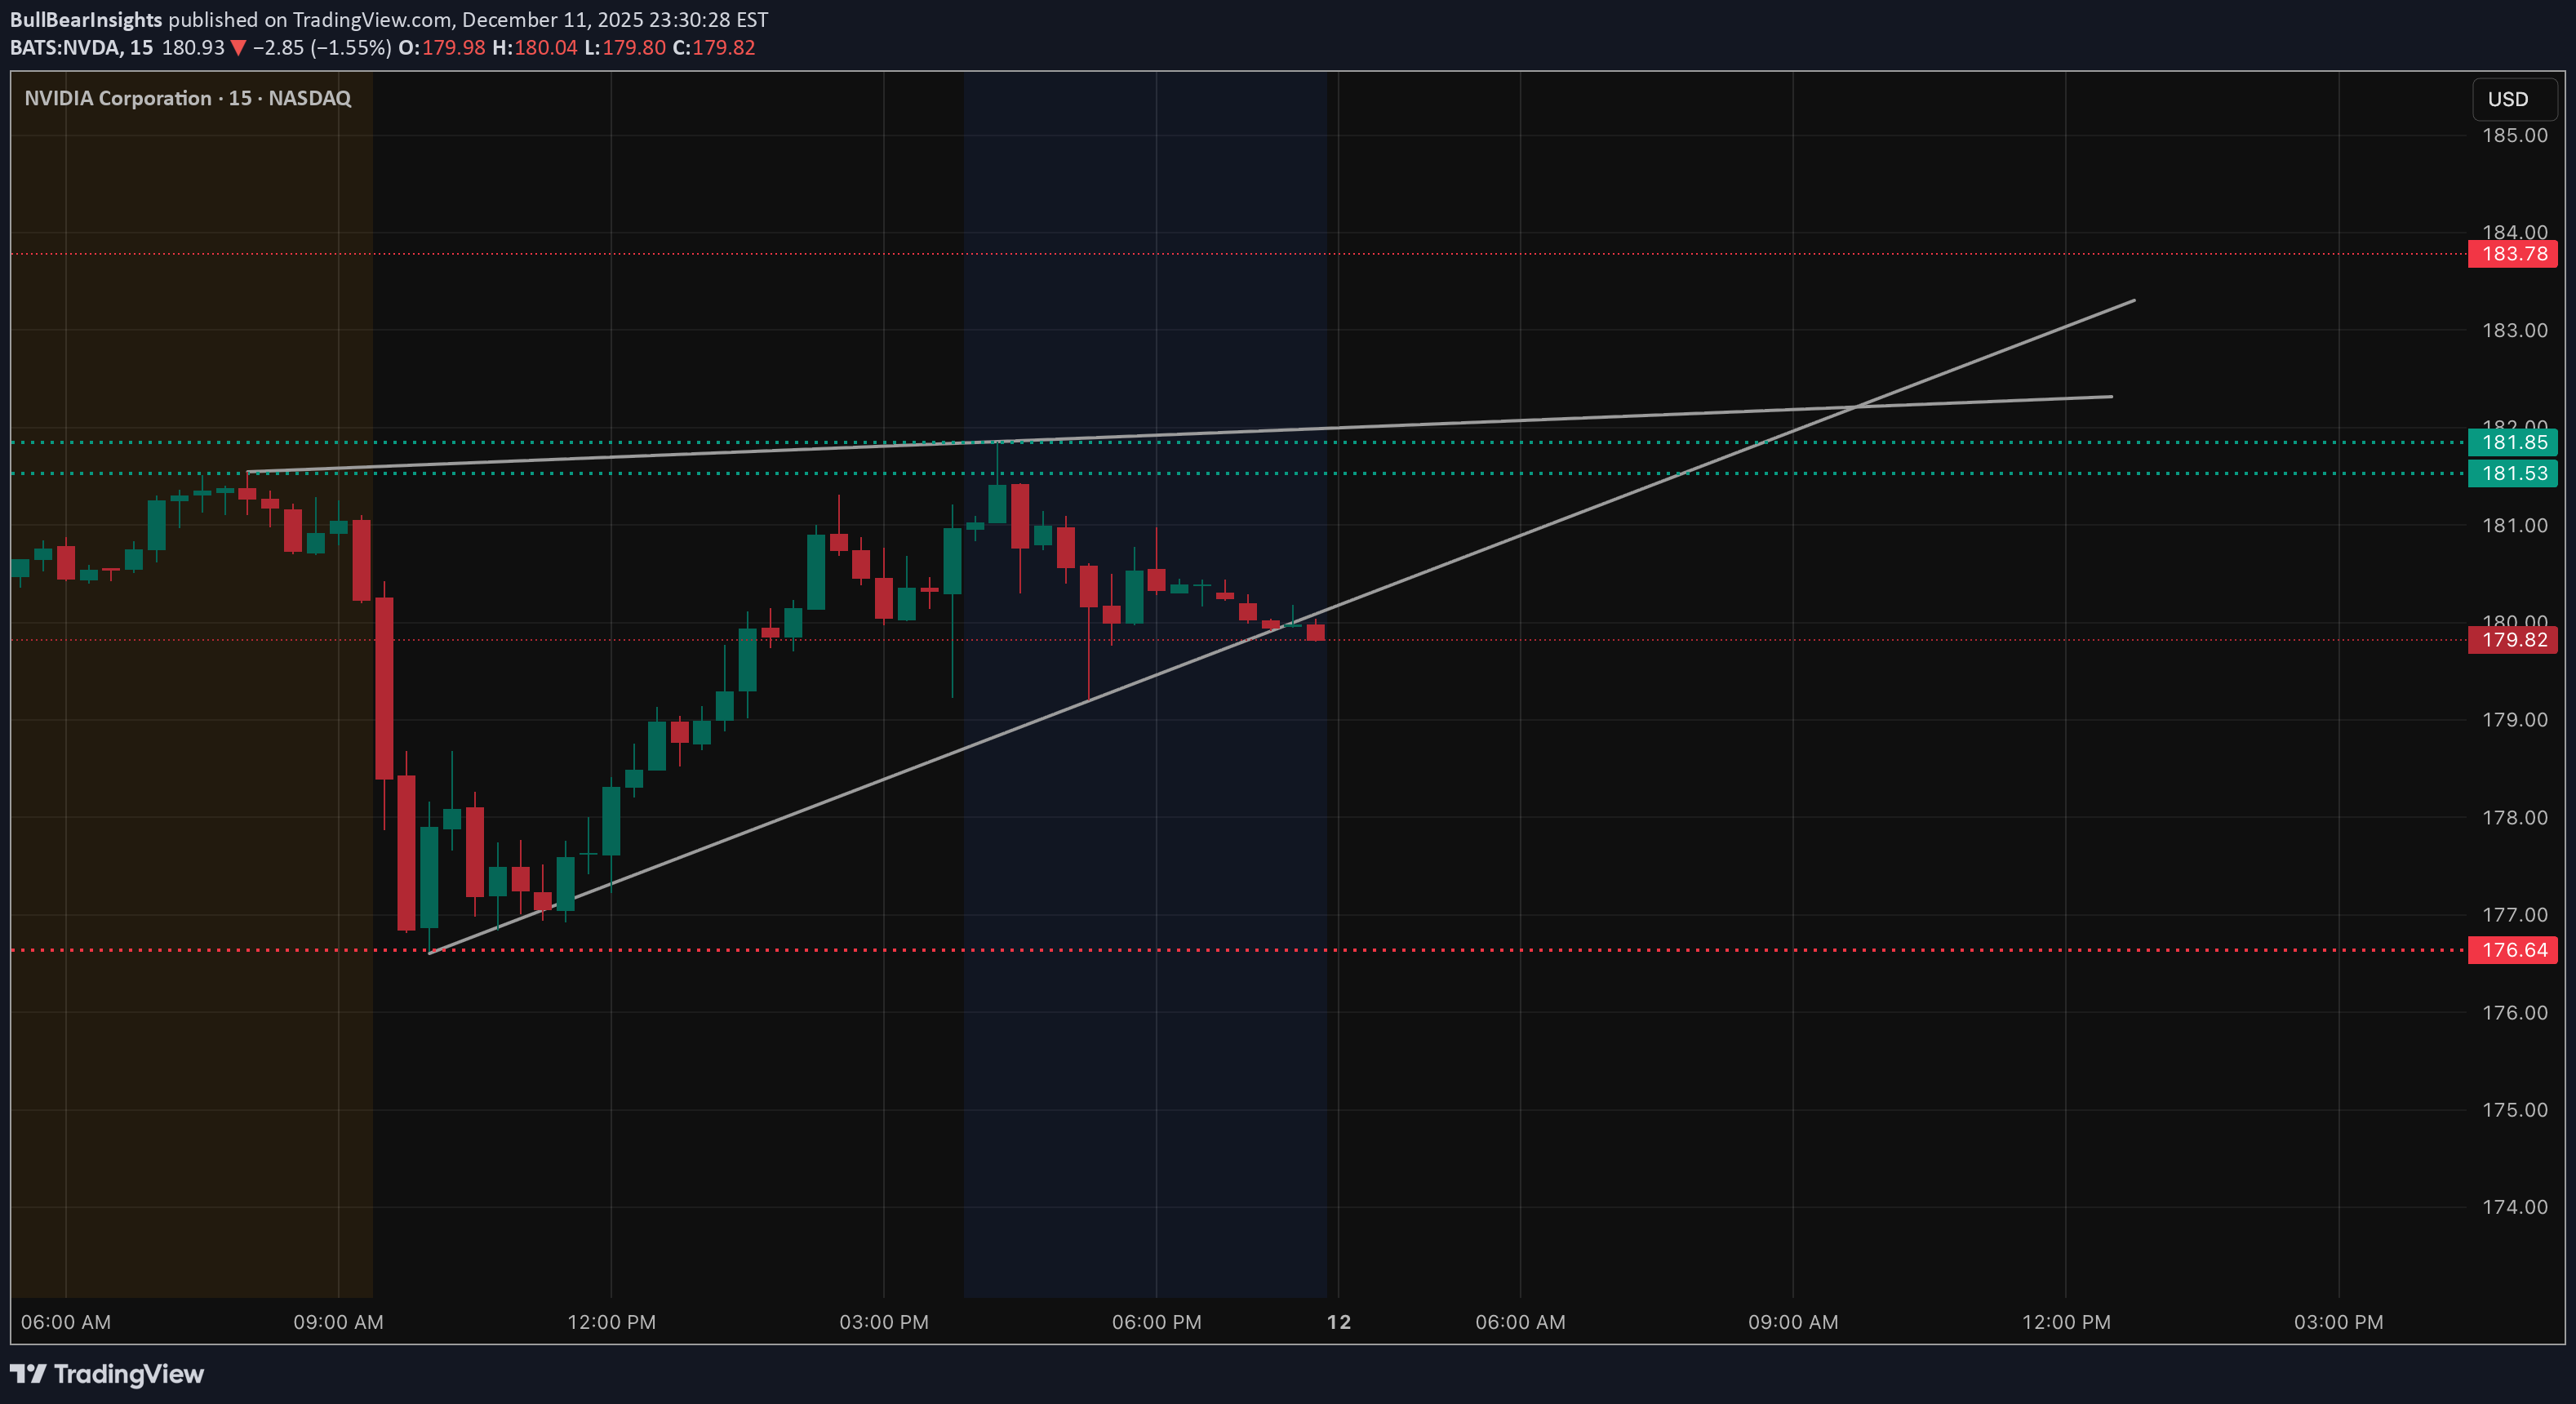
NVDA 15-Min Market Structure NVDA has been riding a steady intraday trendline from the morning rebound, but the most recent candles show price slipping underneath that trendline. This shift tells us momentum is slowing, and the market is waiting for a key directional trigger. Above price, the intraday resistance band near 181.50–182 has rejected multiple times. Until NVDA can claim and hold above that zone, the chart leans neutral-to-slightly-heavy. Below current levels, the lower trendline (local rising support) interacts with 179.50–180 — a zone that has already acted as a short-term pivot. If this area breaks cleanly, a deeper correction becomes more likely. Now Look at How Options Positioning (GEX) below That Aligns With the Chart: Looking at the options landscape, NVDA shows concentrated call-side resistance stacked from 182.5 up toward 187.5–190. These levels often behave like “upper gravity zones” — price may approach them, but if call positioning is dense, dealers tend to hedge in a way that suppresses sharp upside. This aligns well with the technical rejection seen around 181.50–182. The market had multiple chances to break through but failed, confirming that supply is reinforced by options positioning. On the downside, the negative GEX region around 177–175 marks where put positioning thickens. These zones often act as stabilization areas during pullbacks because dealer hedging can slow the decline as price approaches them. This creates a very clean structure: * Resistance and upside hesitation: 181.5 → 182.5 → 187.5 * Neutral zone: 180–179.5 * Downside absorption: 177 → 175 Technically and options-wise, NVDA sits in a narrow decision range. Breakout above 182.5 could open room toward 185 and possibly 187.5 if momentum builds. Break below 179.5 puts 177 and 175 into play. Directional Thoughts for Dec 12 * Bullish Case: NVDA must break above 181.5–182.5 and hold. If achieved, the next push could target 185, with an extension toward 187.5 where another cluster of call resistance sits. * Bearish Case: A clean breakdown under 179.5 shifts momentum firmly downward. In that scenario, price may gravitate toward 177 first, then 175 where options positioning suggests downside may slow. Why This Setup Is Interesting NVDA’s chart is not moving on pure price action alone — the intraday reactions line up almost perfectly with the major GEX concentrations. When technical structure and options-based levels reinforce each other, markets often behave more predictably because both chart traders and hedging flows are interacting at the same spots. This makes NVDA one of the cleaner names to watch on Dec 12. Disclaimer This analysis is for educational purposes only and does not constitute financial advice. Always perform your own research and manage risk according to your individual trading plan.