Technical analysis by tradecitypro about Symbol HBAR on 12/7/2025

tradecitypro
HBAR در کانون بحران: آیا حمایت حیاتی شکسته میشود یا خرسها باز میگردند؟
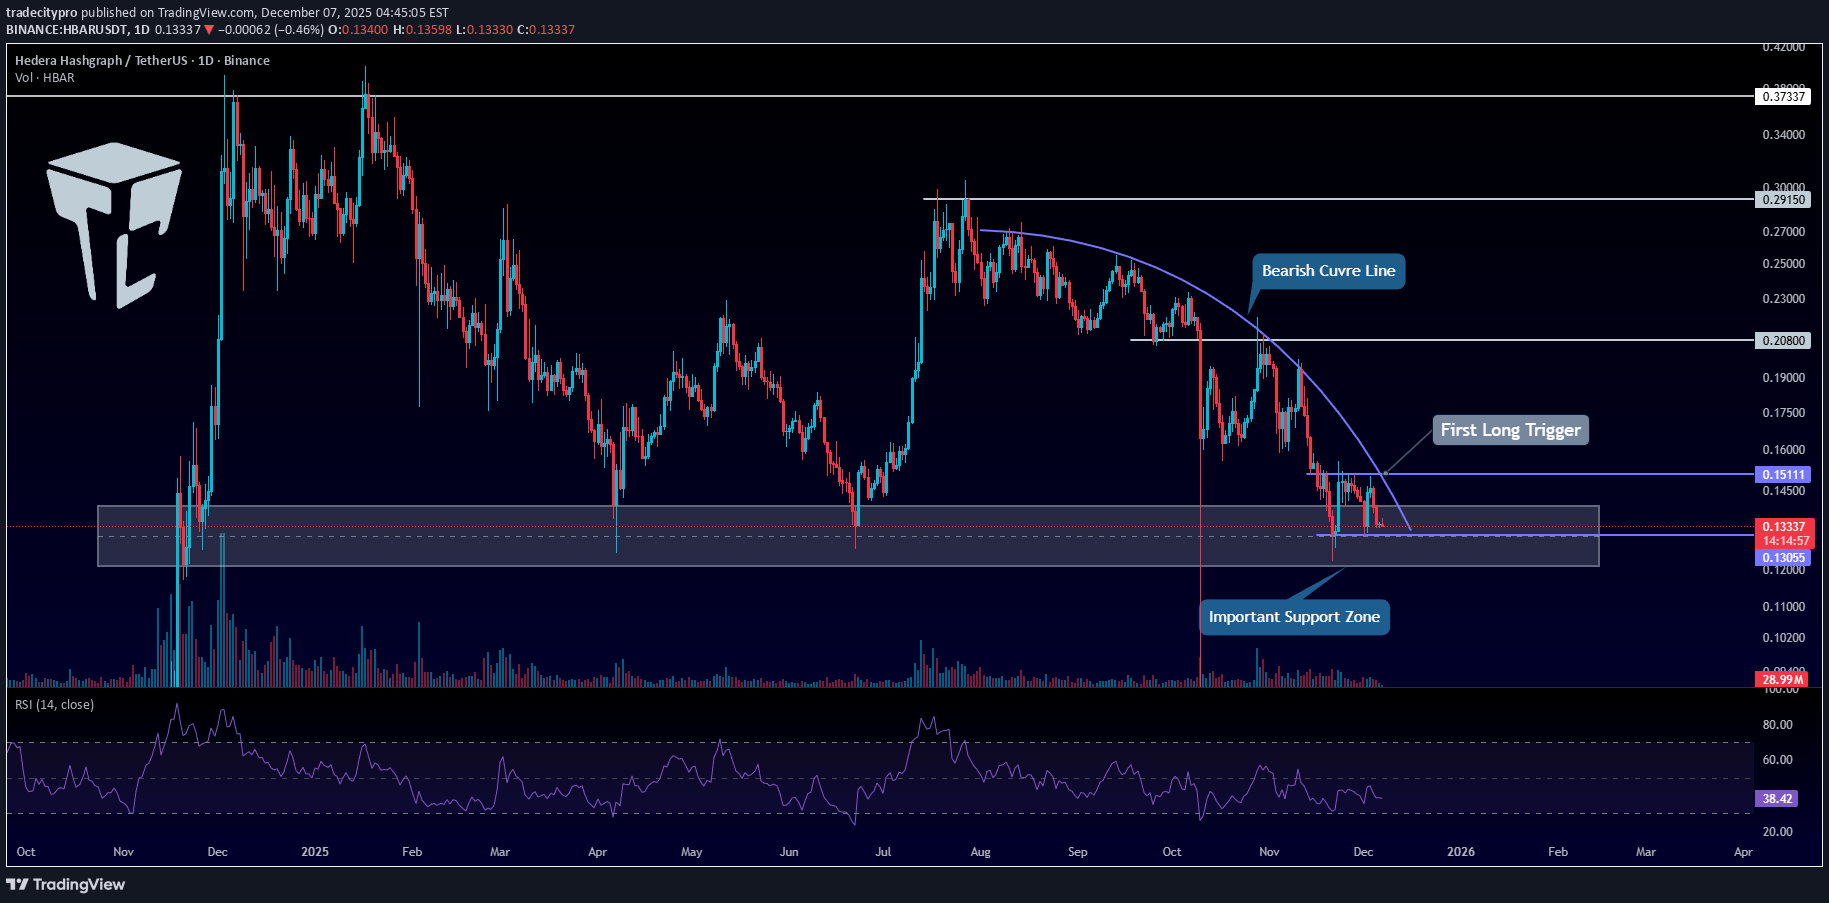
👋 Welcome to TradeCityPro! In this analysis, I want to review HBAR, one of the RWA-focused projects, currently ranked 21st on CoinMarketCap with a market cap of $5.71 billion. 🗓 Daily Timeframe On the daily timeframe, this coin is sitting on a very important support zone. ✔️ There is also a curved descending trendline visible on HBAR, which started forming from the 0.2915 top. 🎲 Every time the price has touched this trendline, bearish momentum has increased. 🎯 Right now, the price is inside this support area, and considering the strong selling pressure in the market, the probability of this zone breaking is high. 💥 The RSI oscillator has also taken a bearish direction after the rejection from 0.2915, spending most of the time below the 50 level, which indicates bearish momentum dominating the market. 💧 If RSI enters the oversold zone, this bearish momentum will intensify even further, increasing the likelihood of a breakdown of support.A break of 0.13055 would be a very strong short trigger. 📊 For long positions, after the descending trendline breaks, we can enter using the 0.15111 trigger. ⚡️ Signs like increasing volume and RSI stabilizing above 50 will act as strong confirmations for a bullish reversal. 📝 Final Thoughts Stay calm, trade wisely, and let's capture the market's best opportunities! This analysis reflects our opinions and is not financial advice. Share your thoughts in the comments, and don’t forget to share this analysis with your friends! ❤️